UEA
ENV
CRU
Homepage
Data
CRU links
CRU staff
CRU data
External links
InterpretingCC
Homepage
NAO
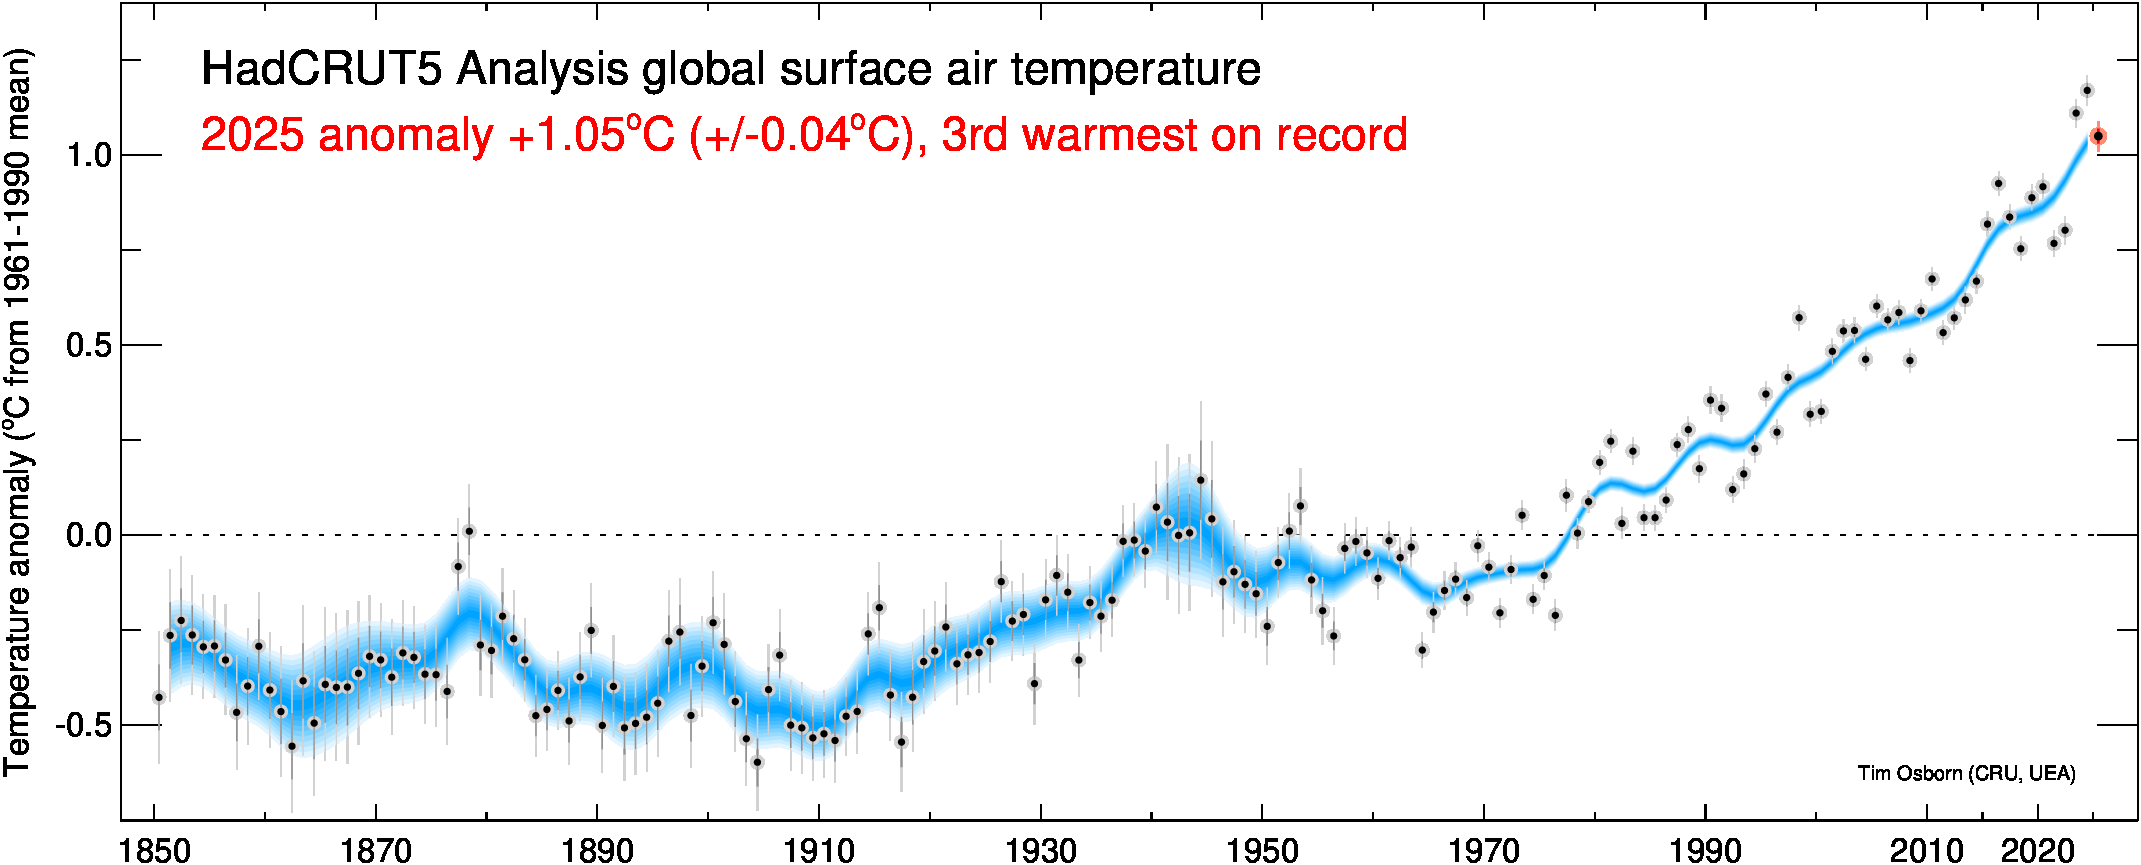
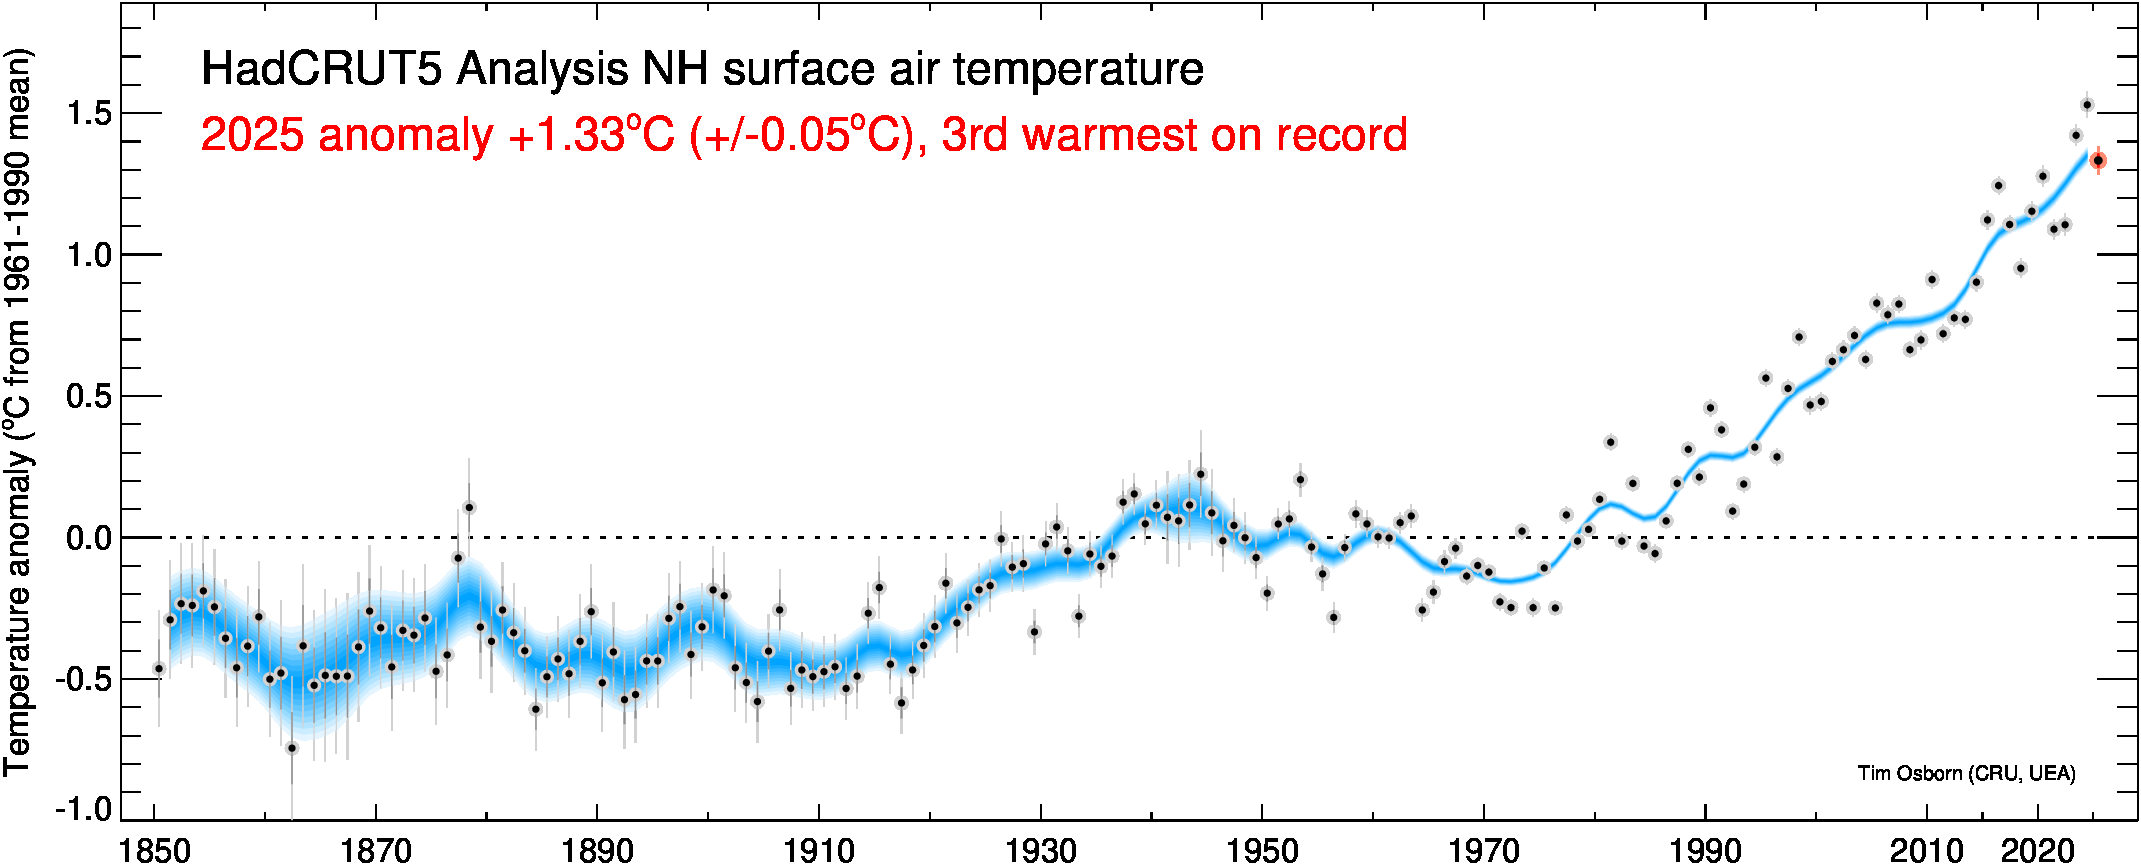
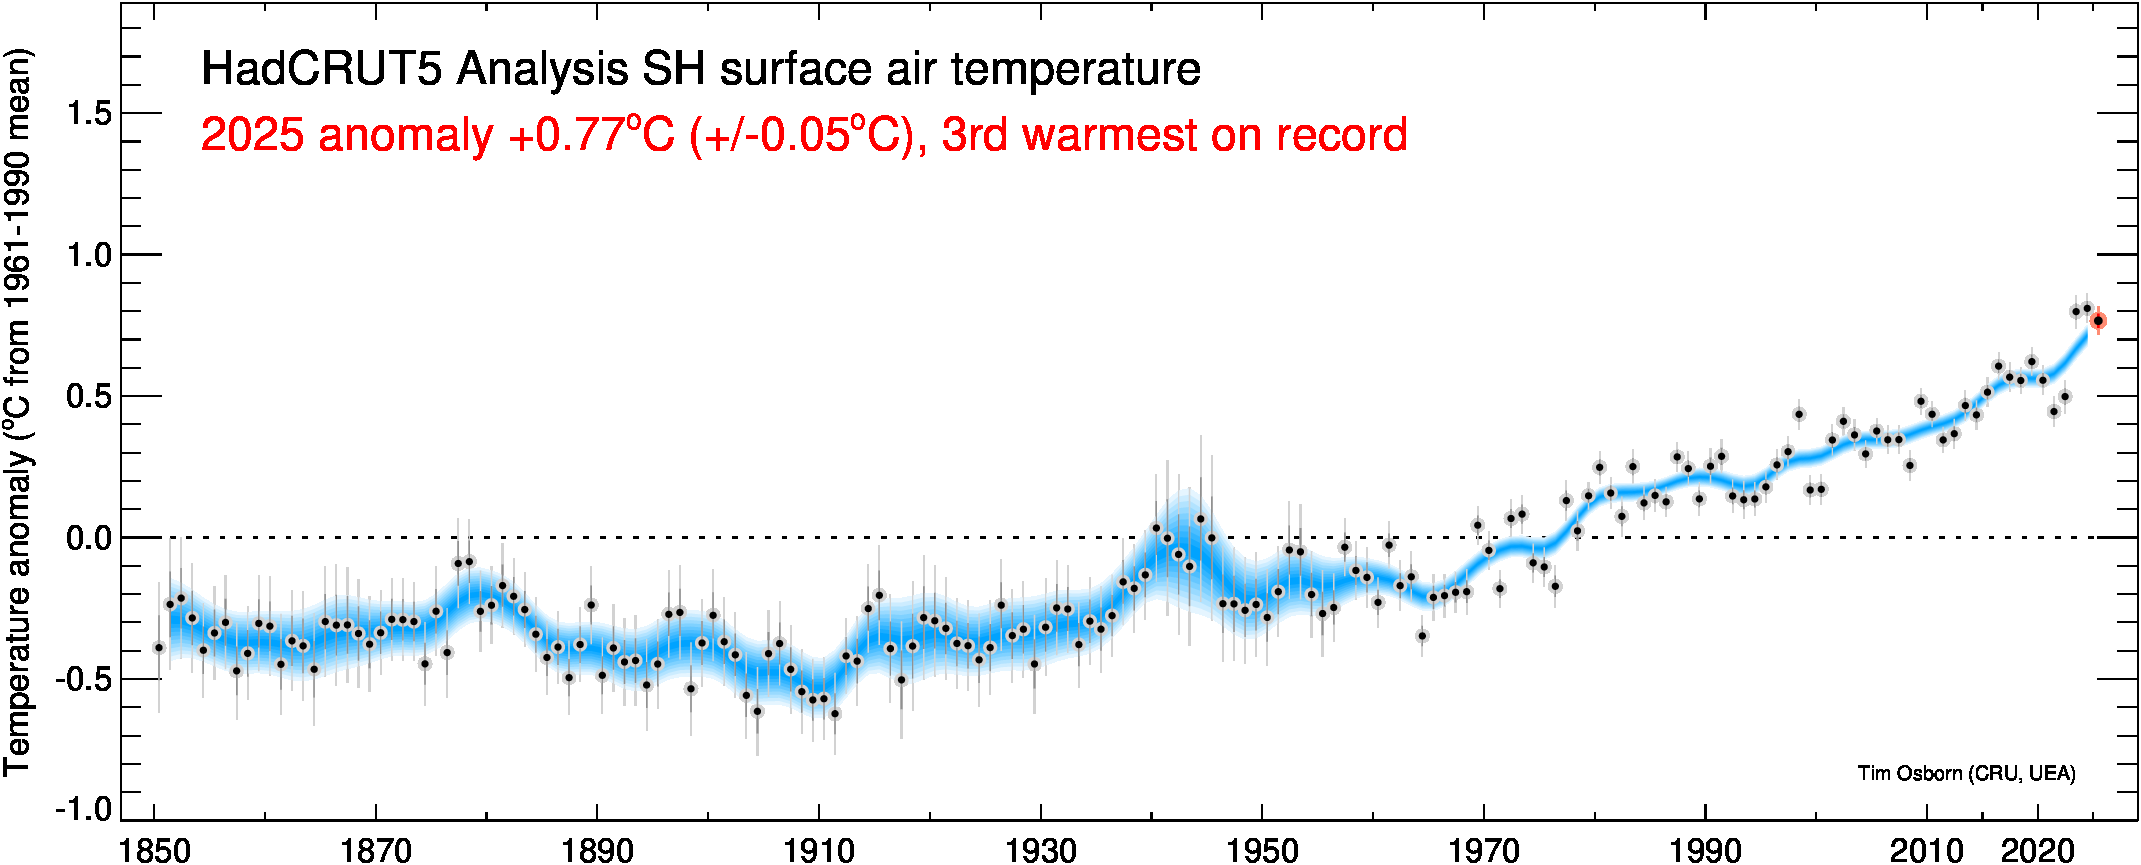
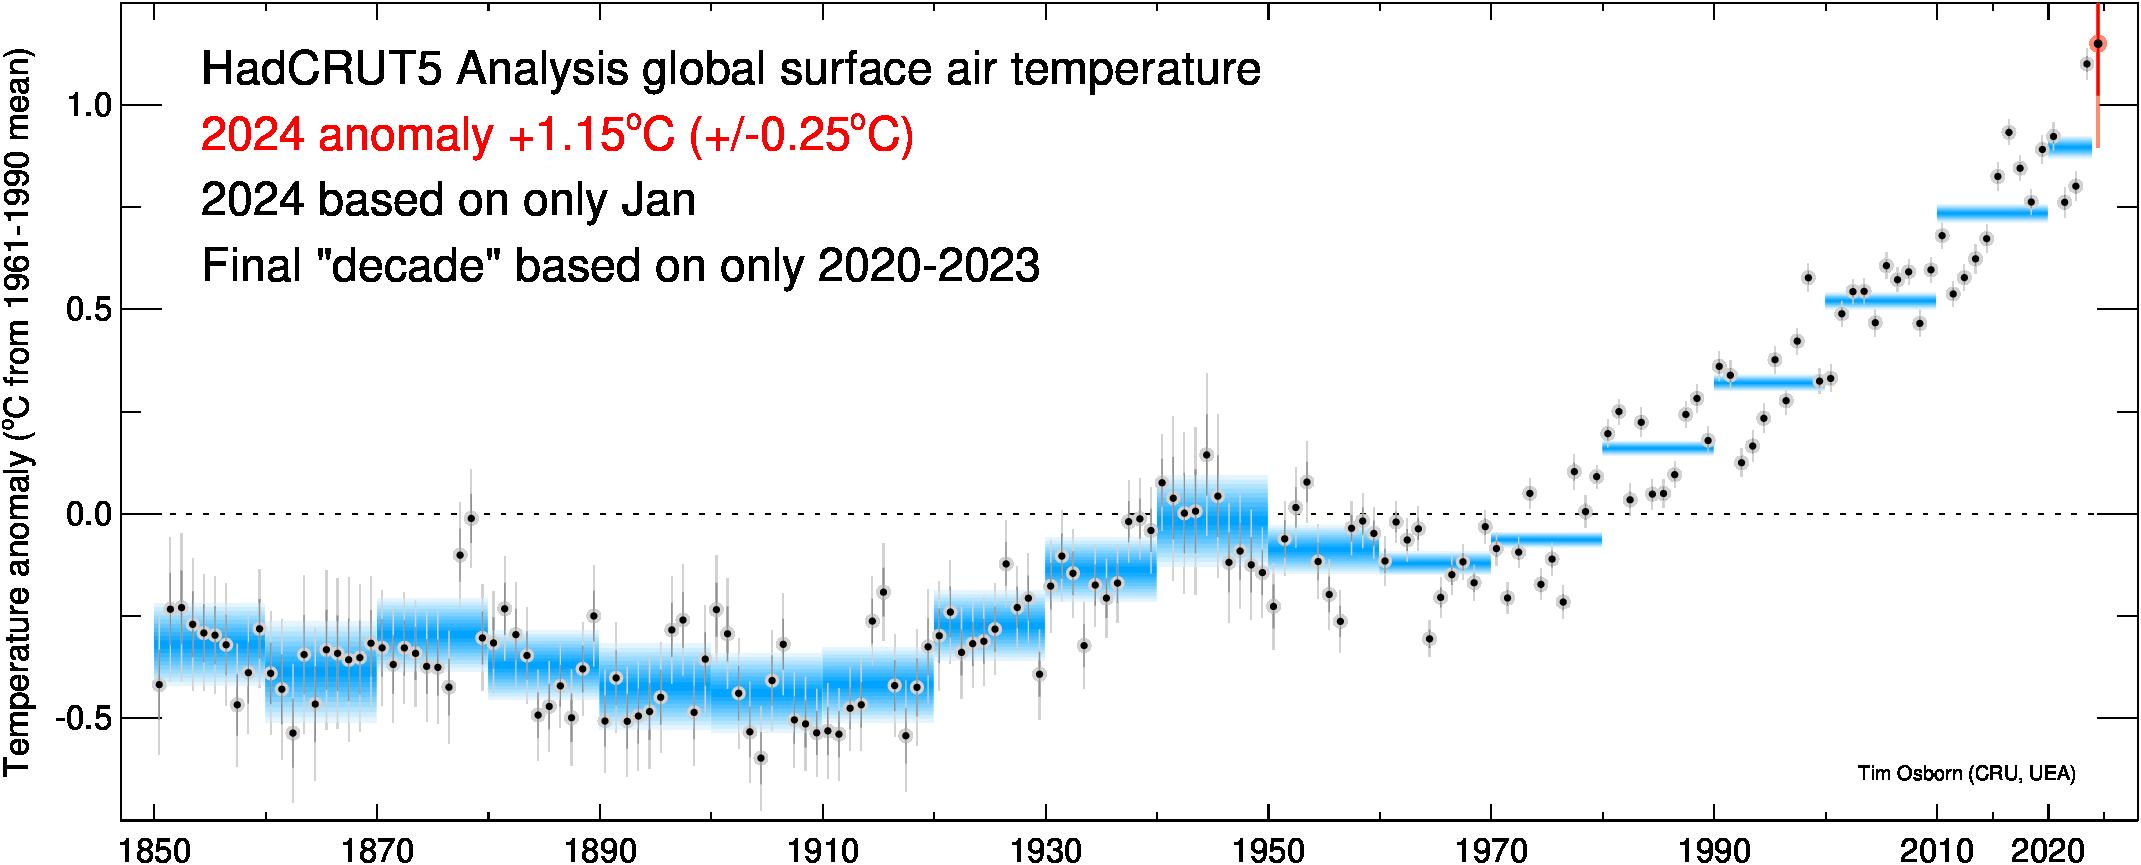
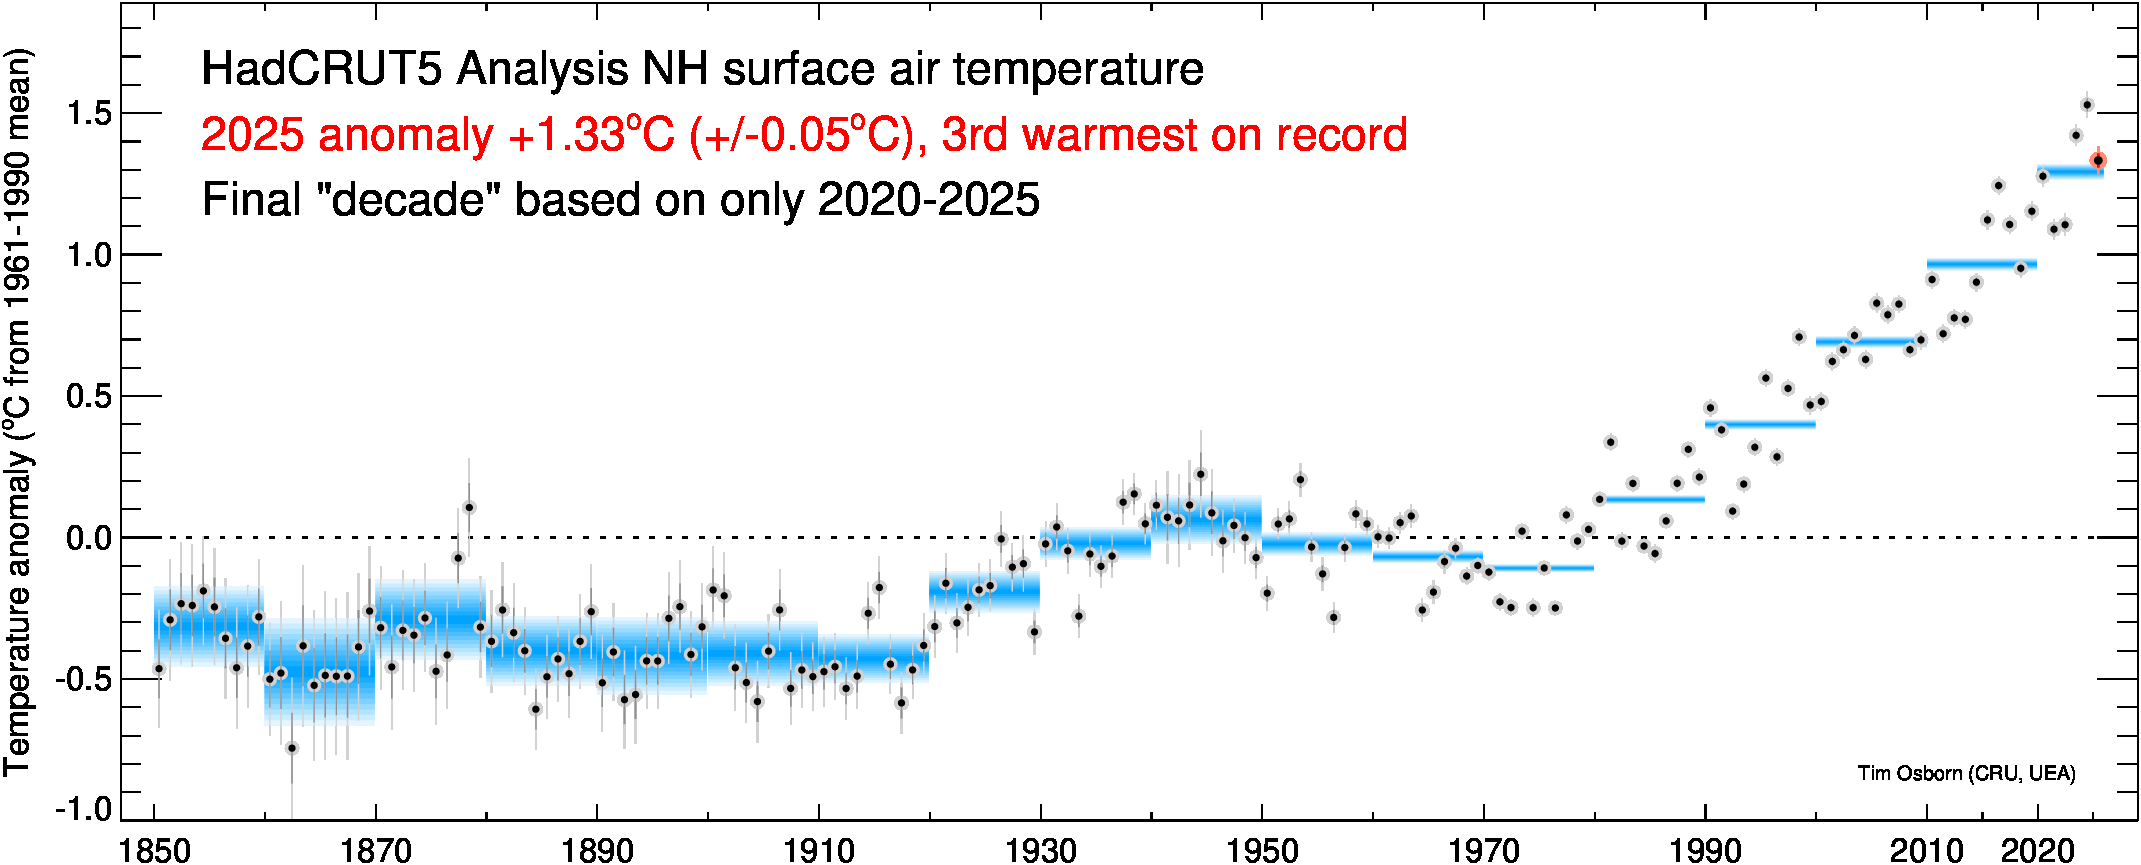
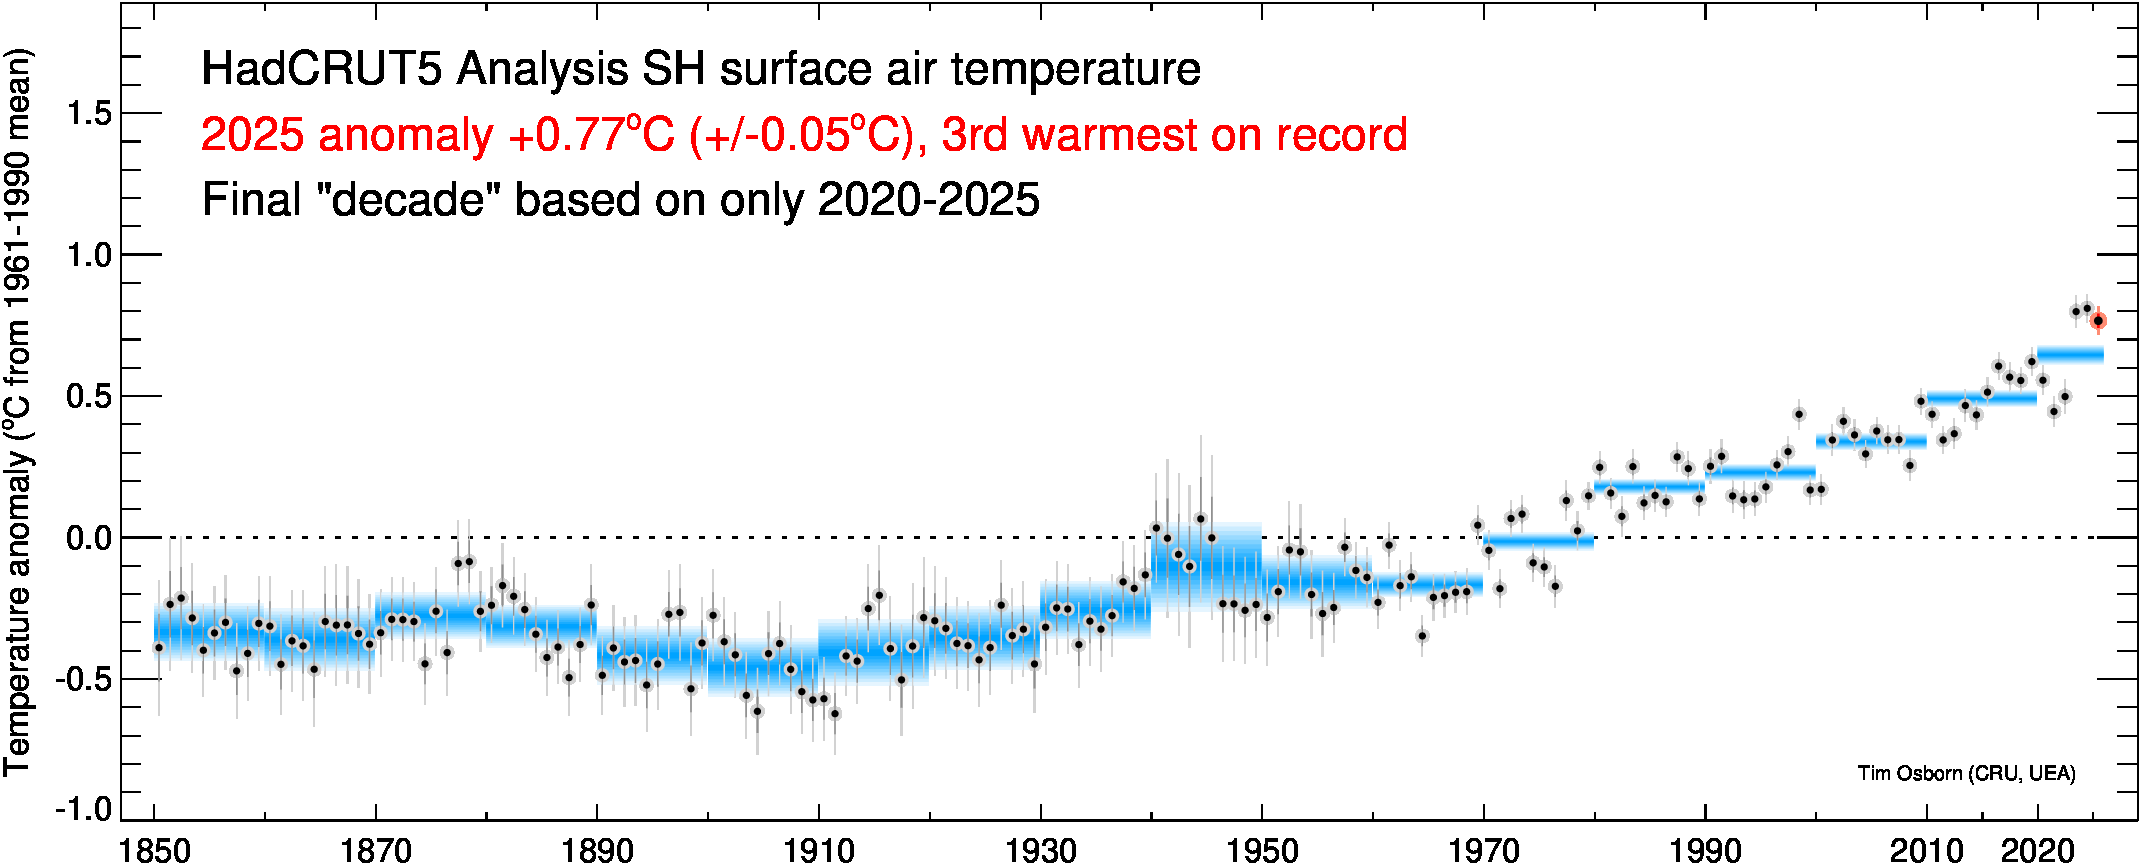
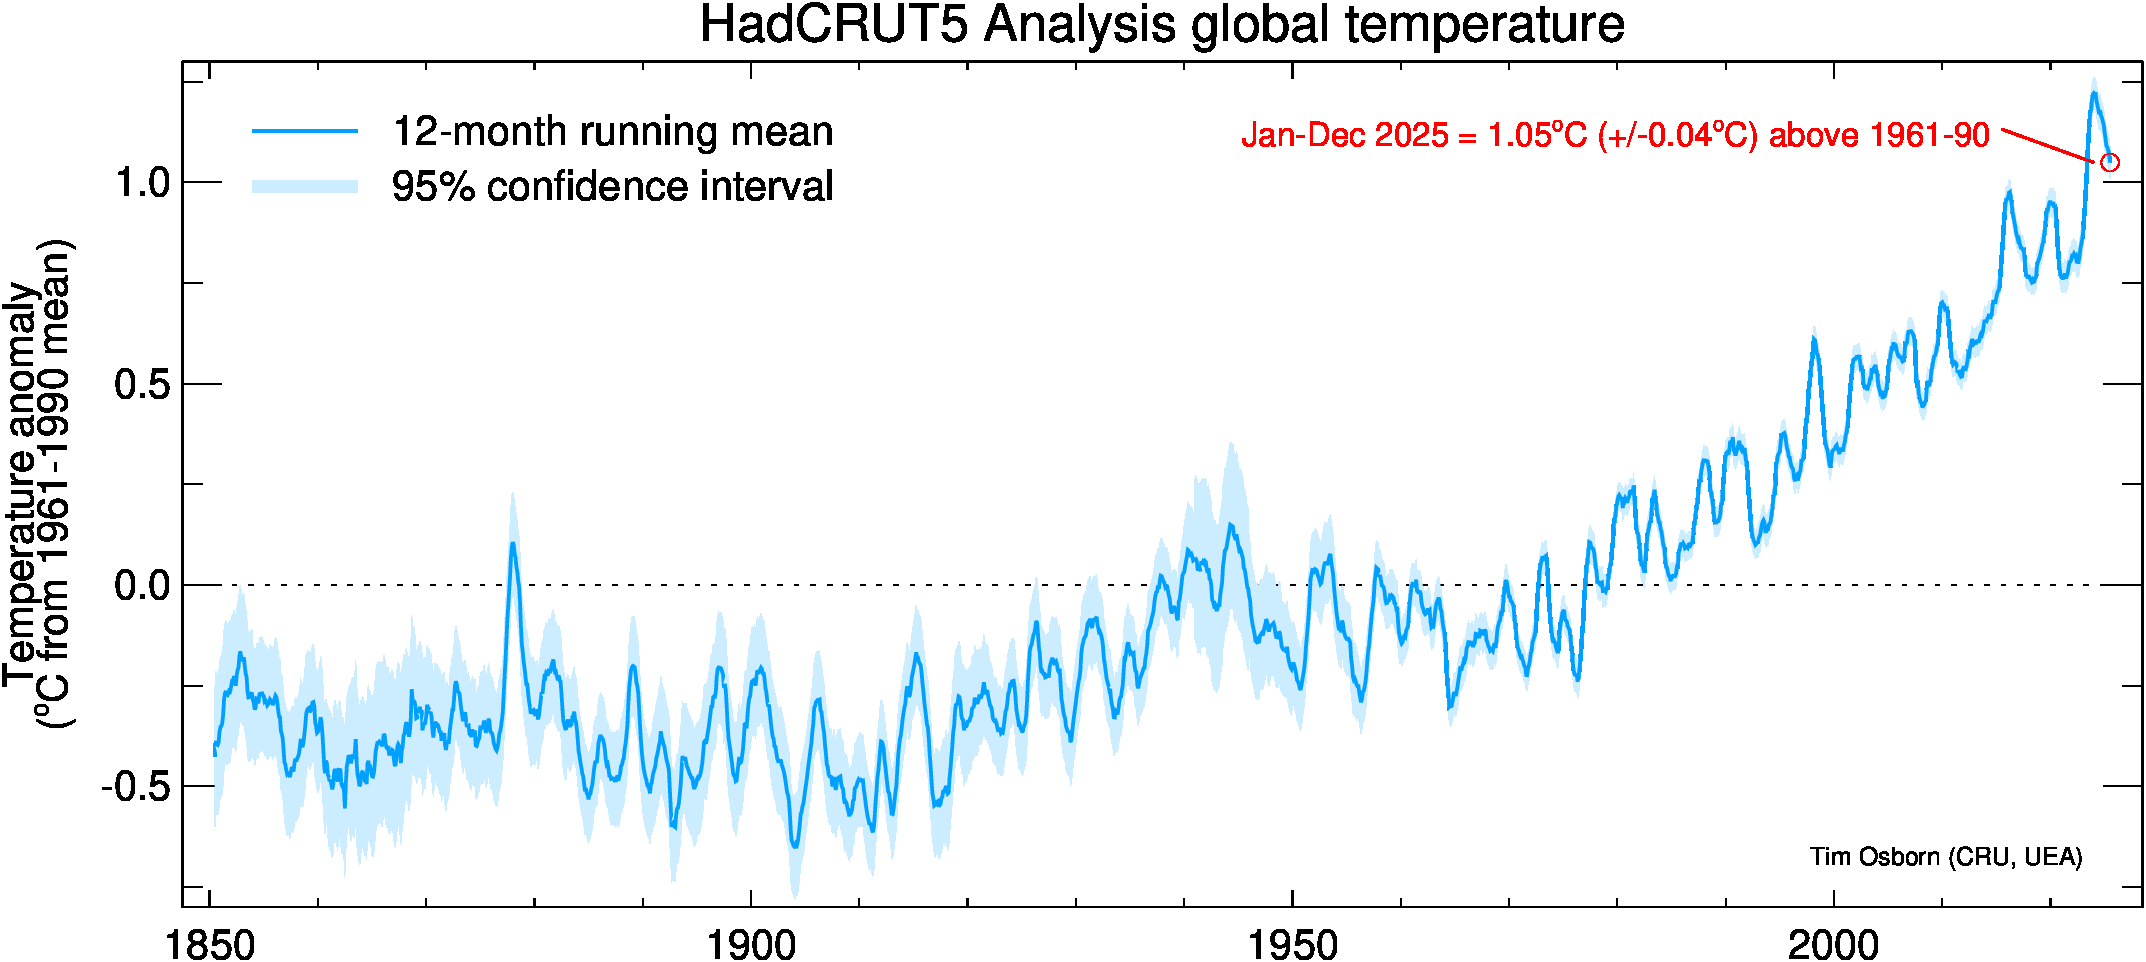
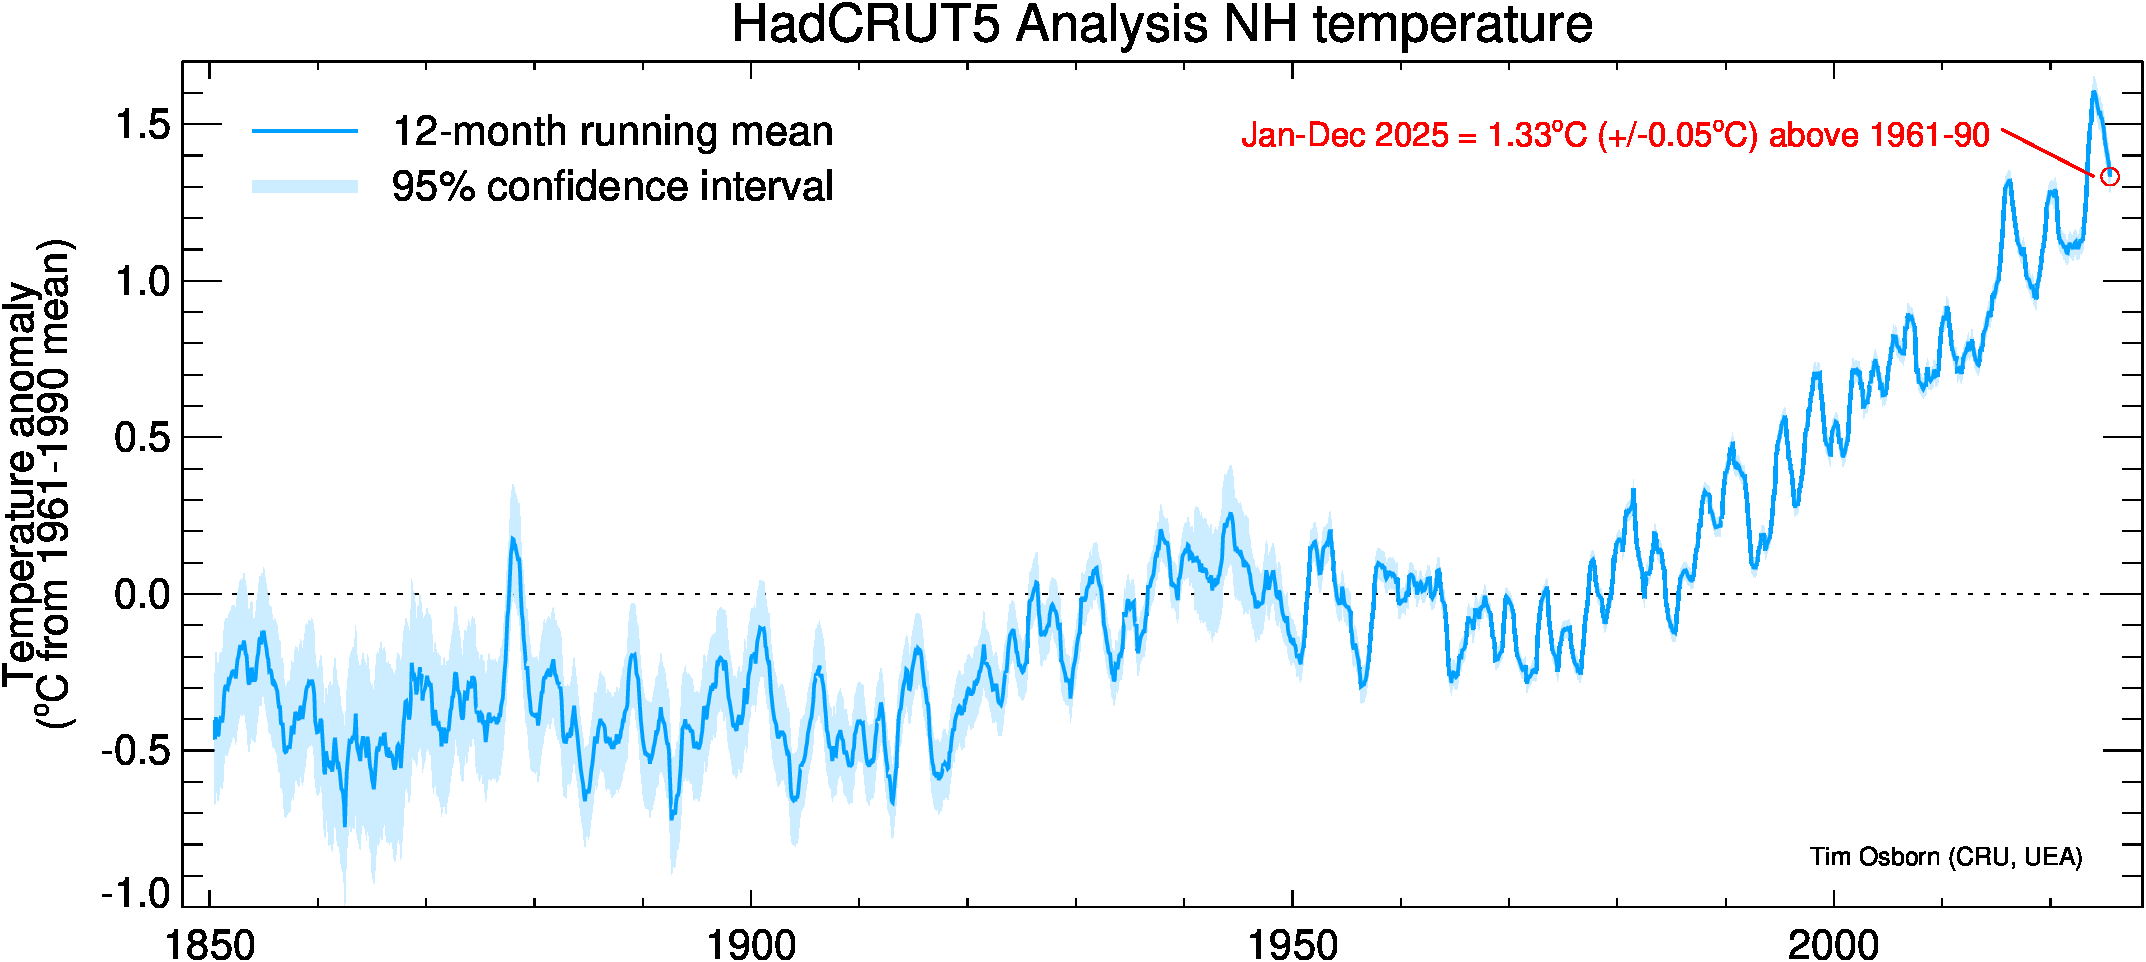
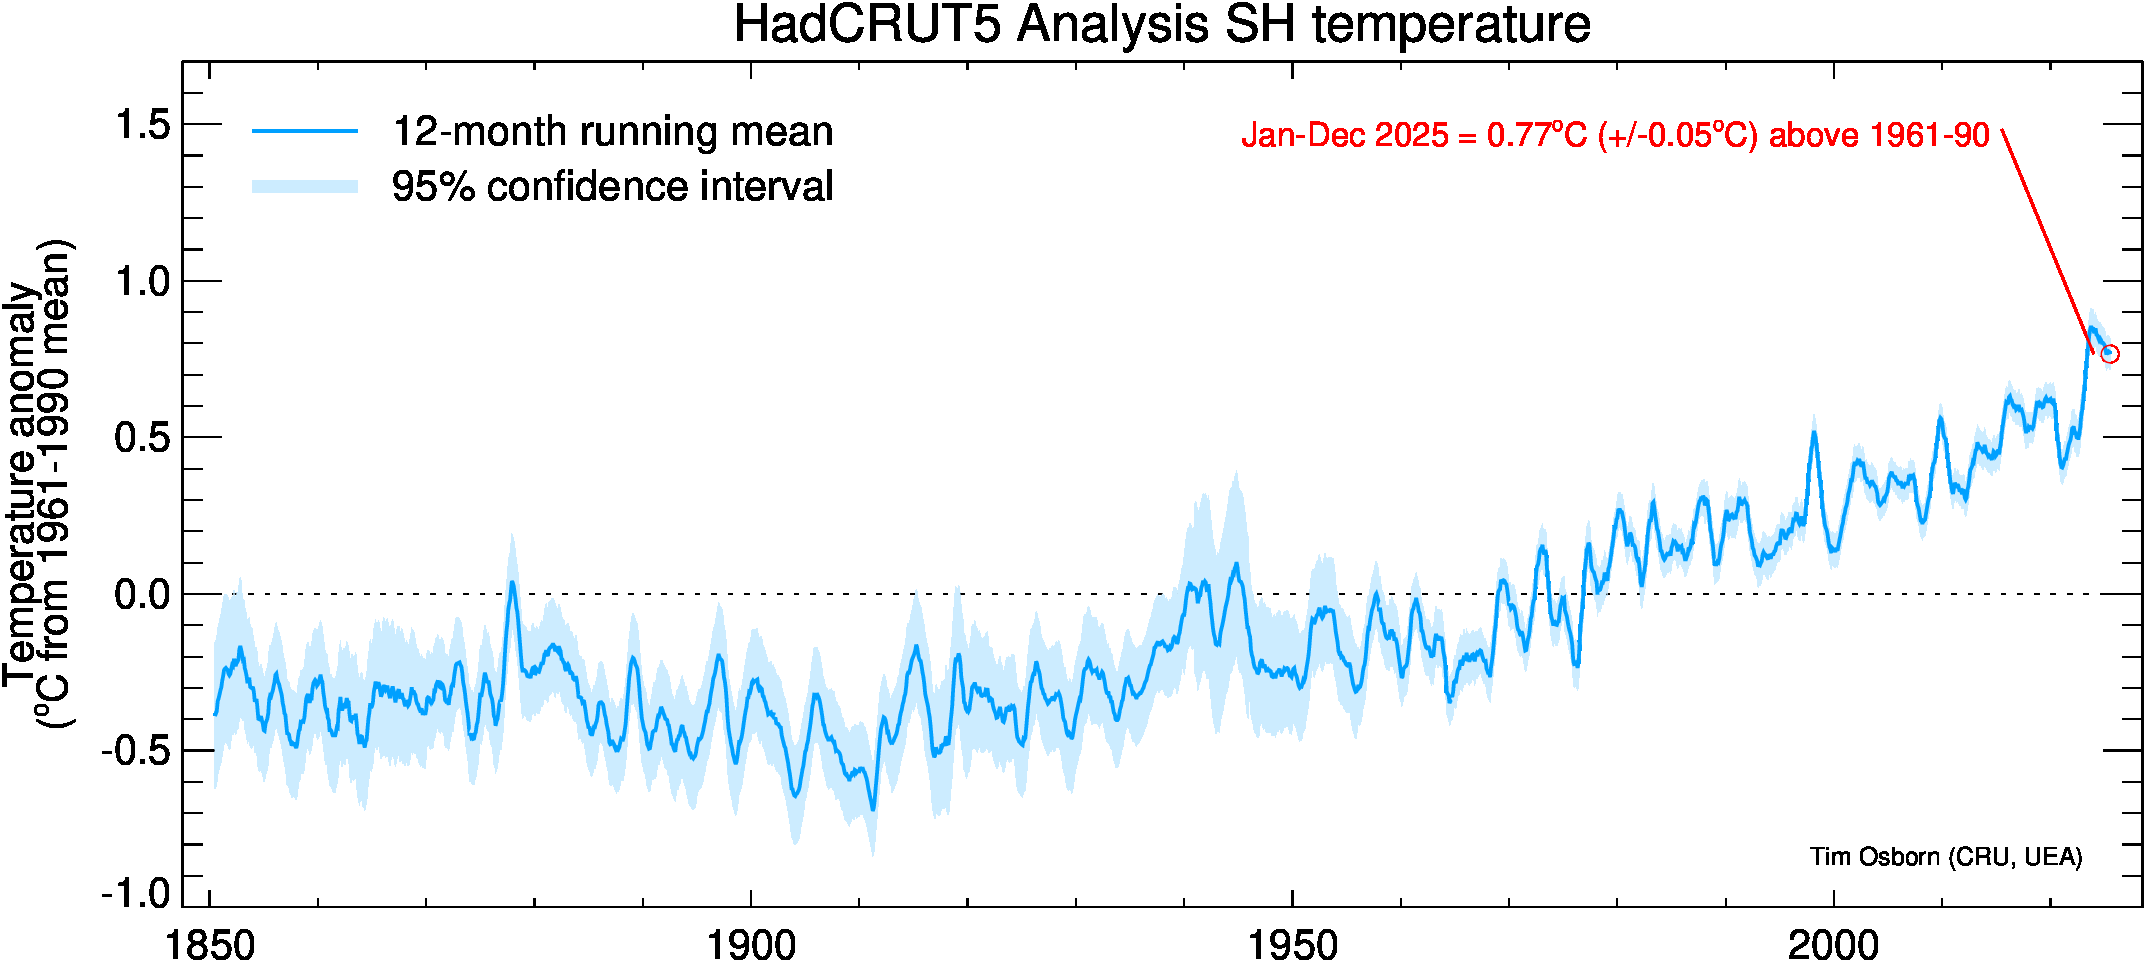
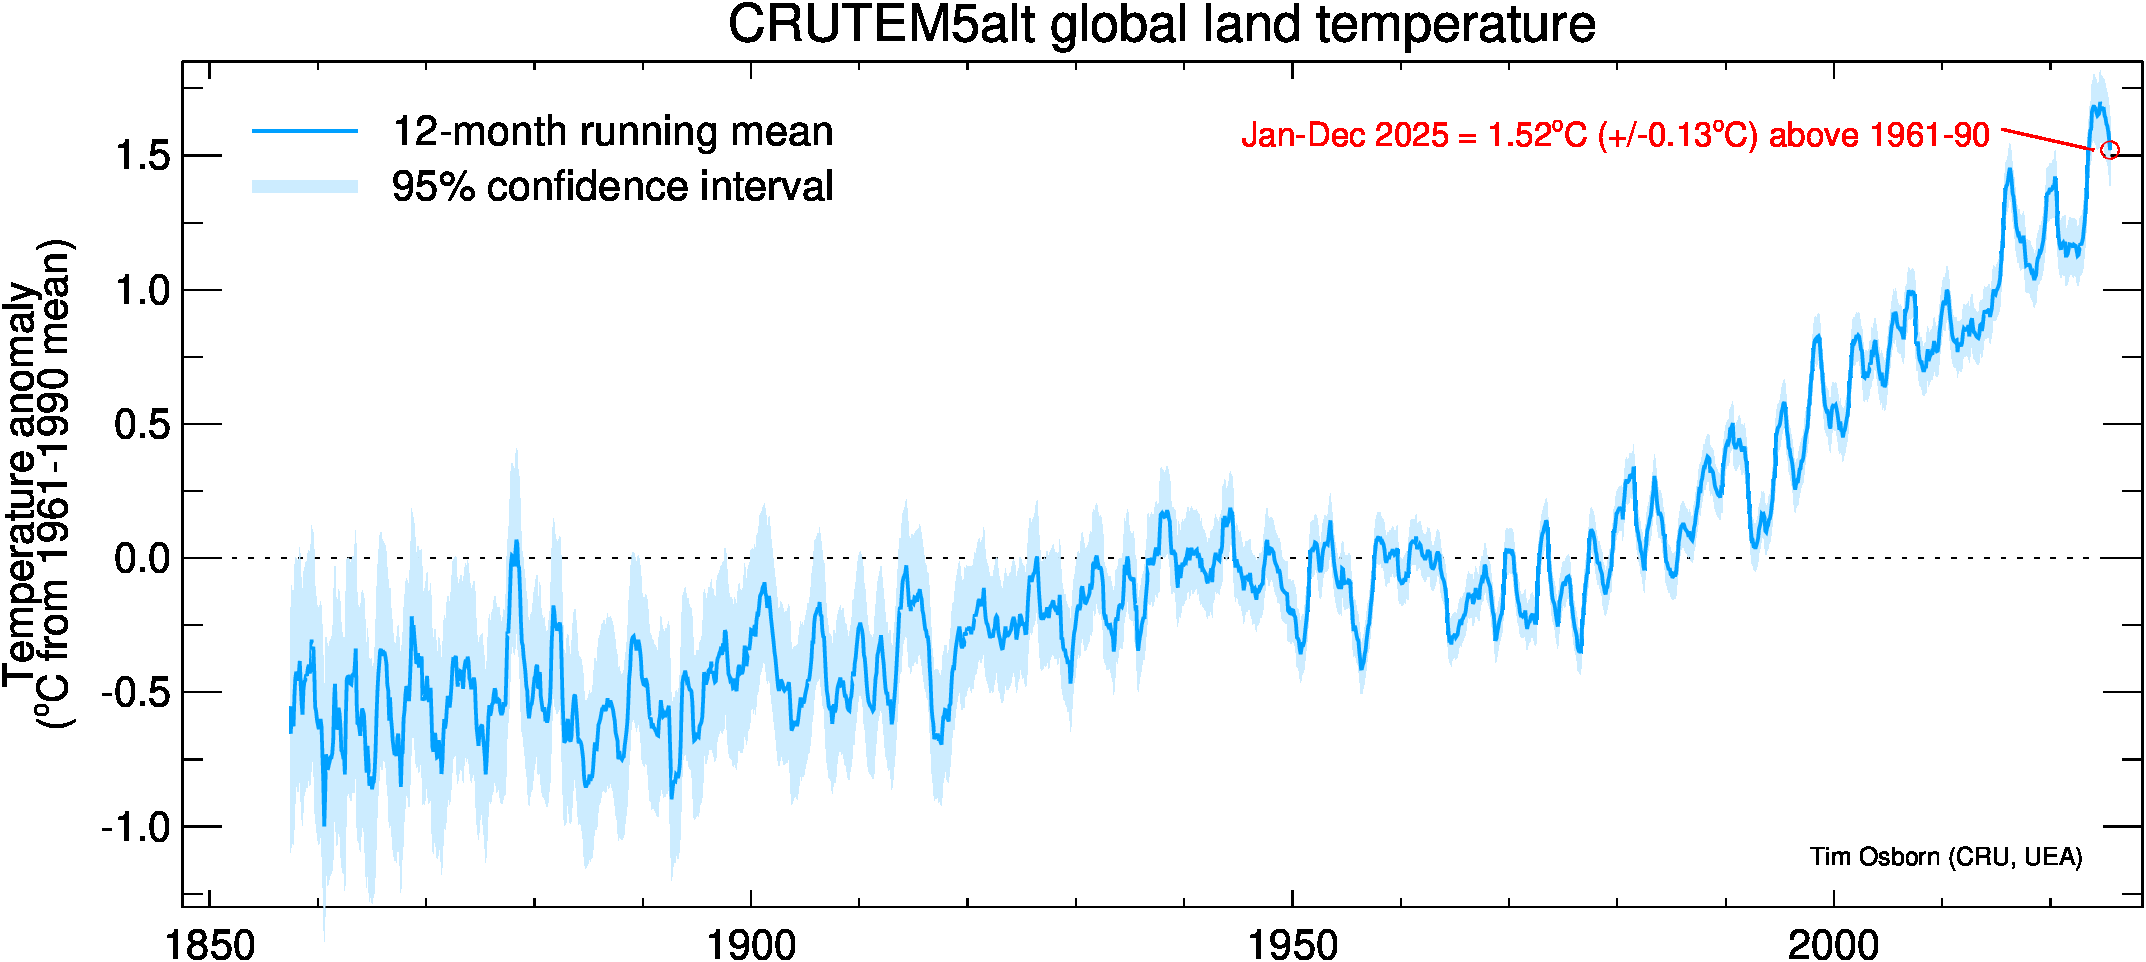
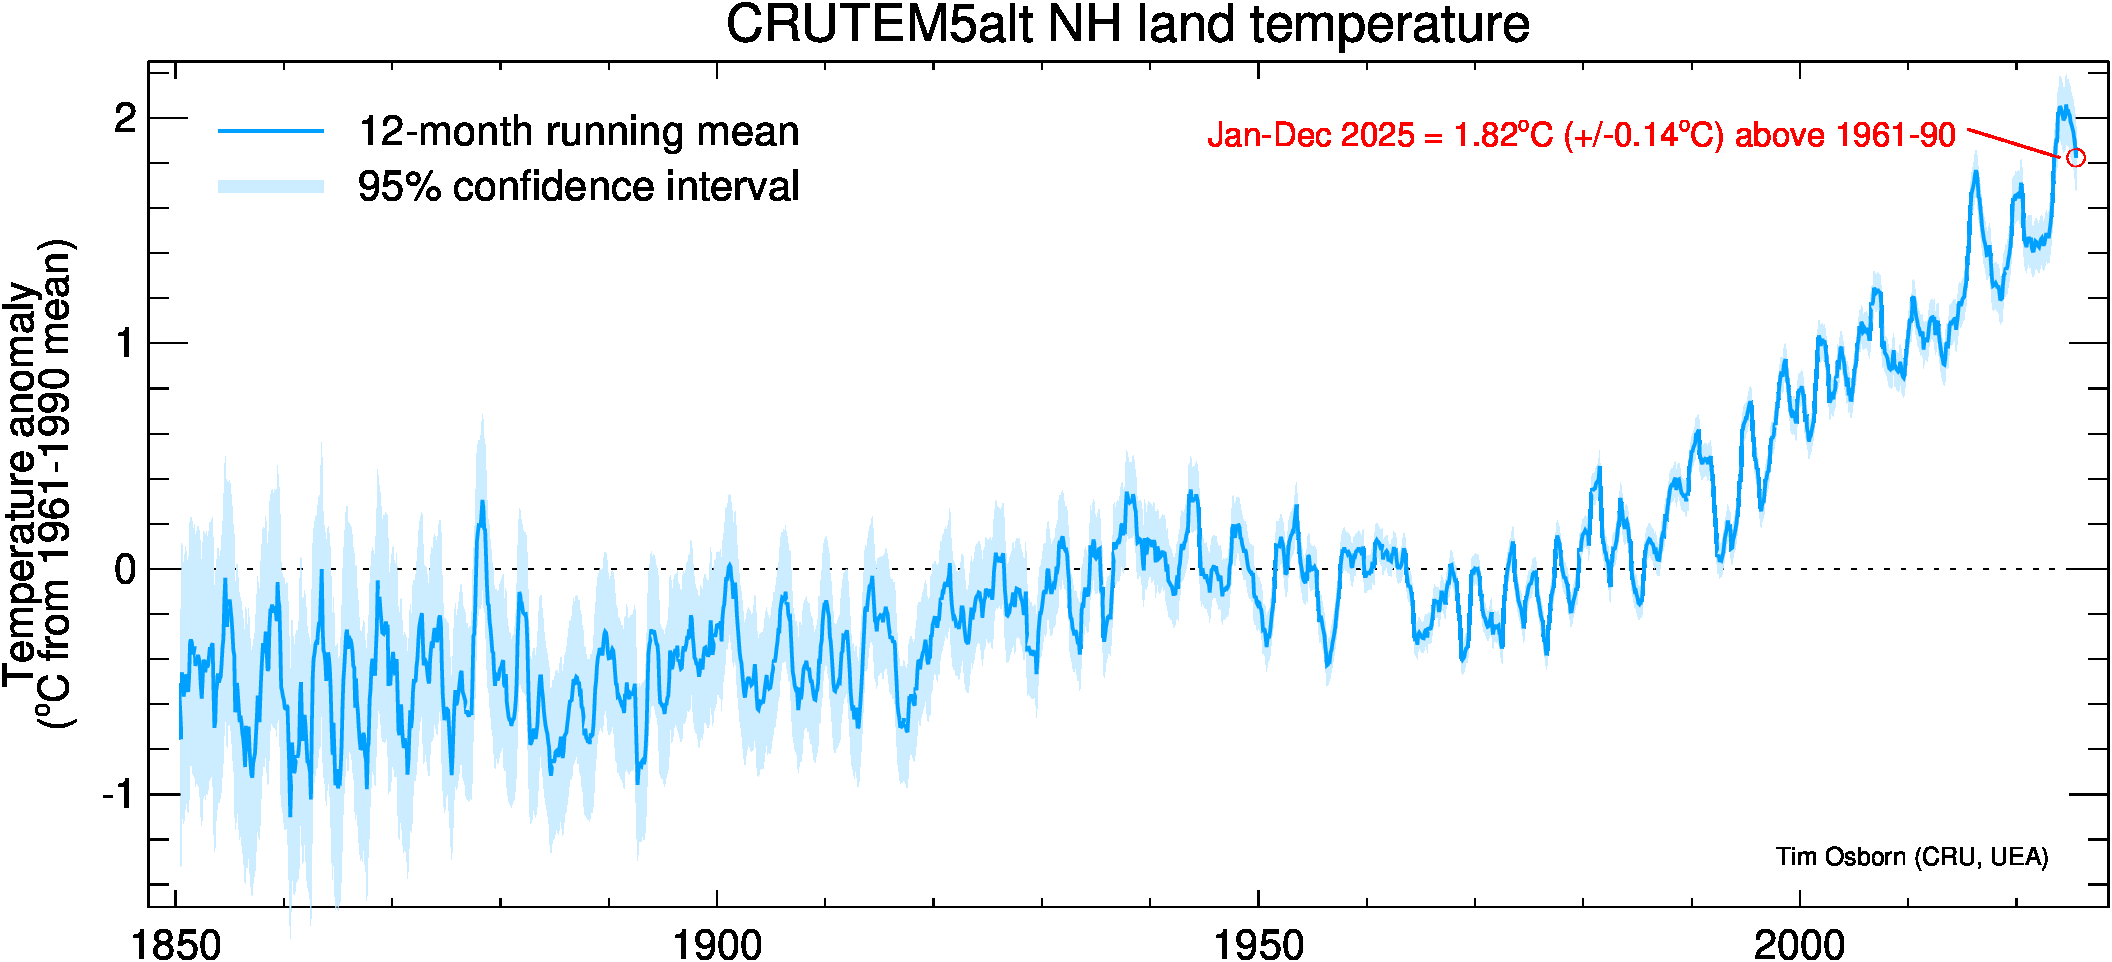
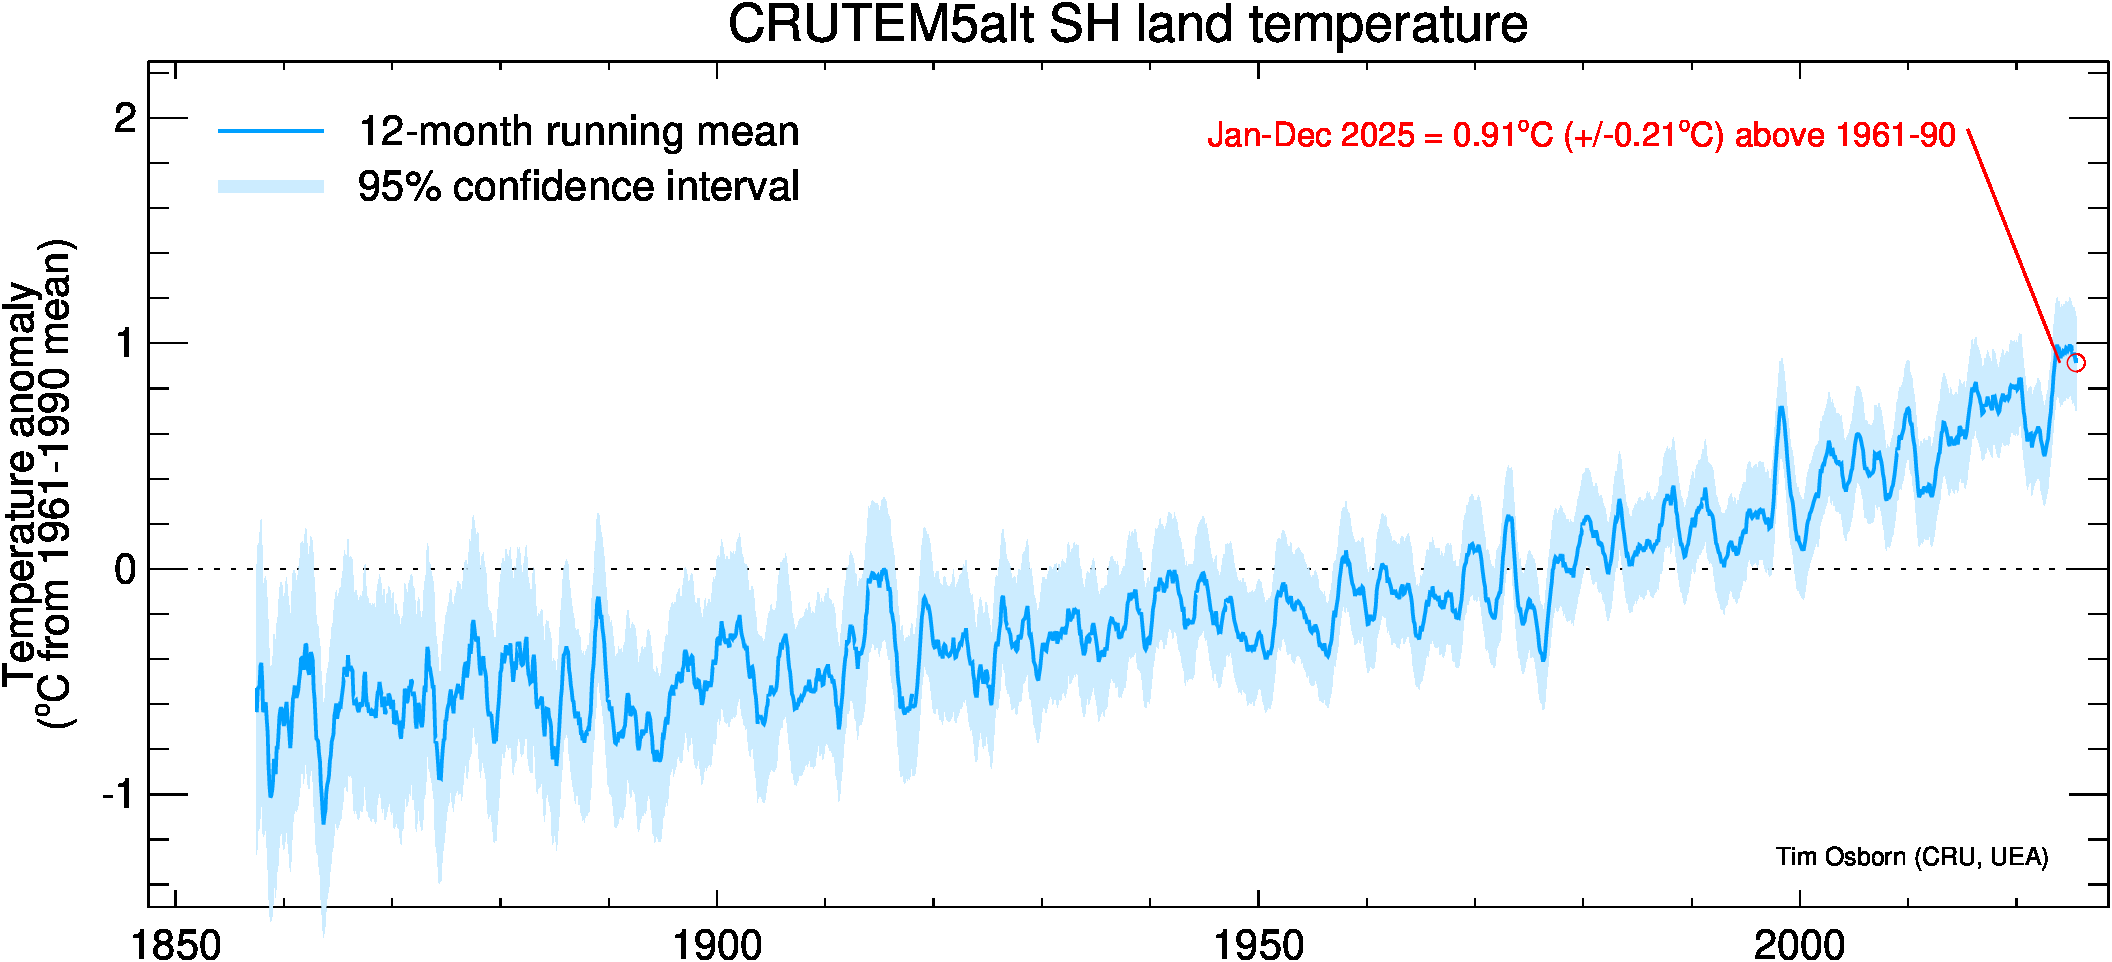
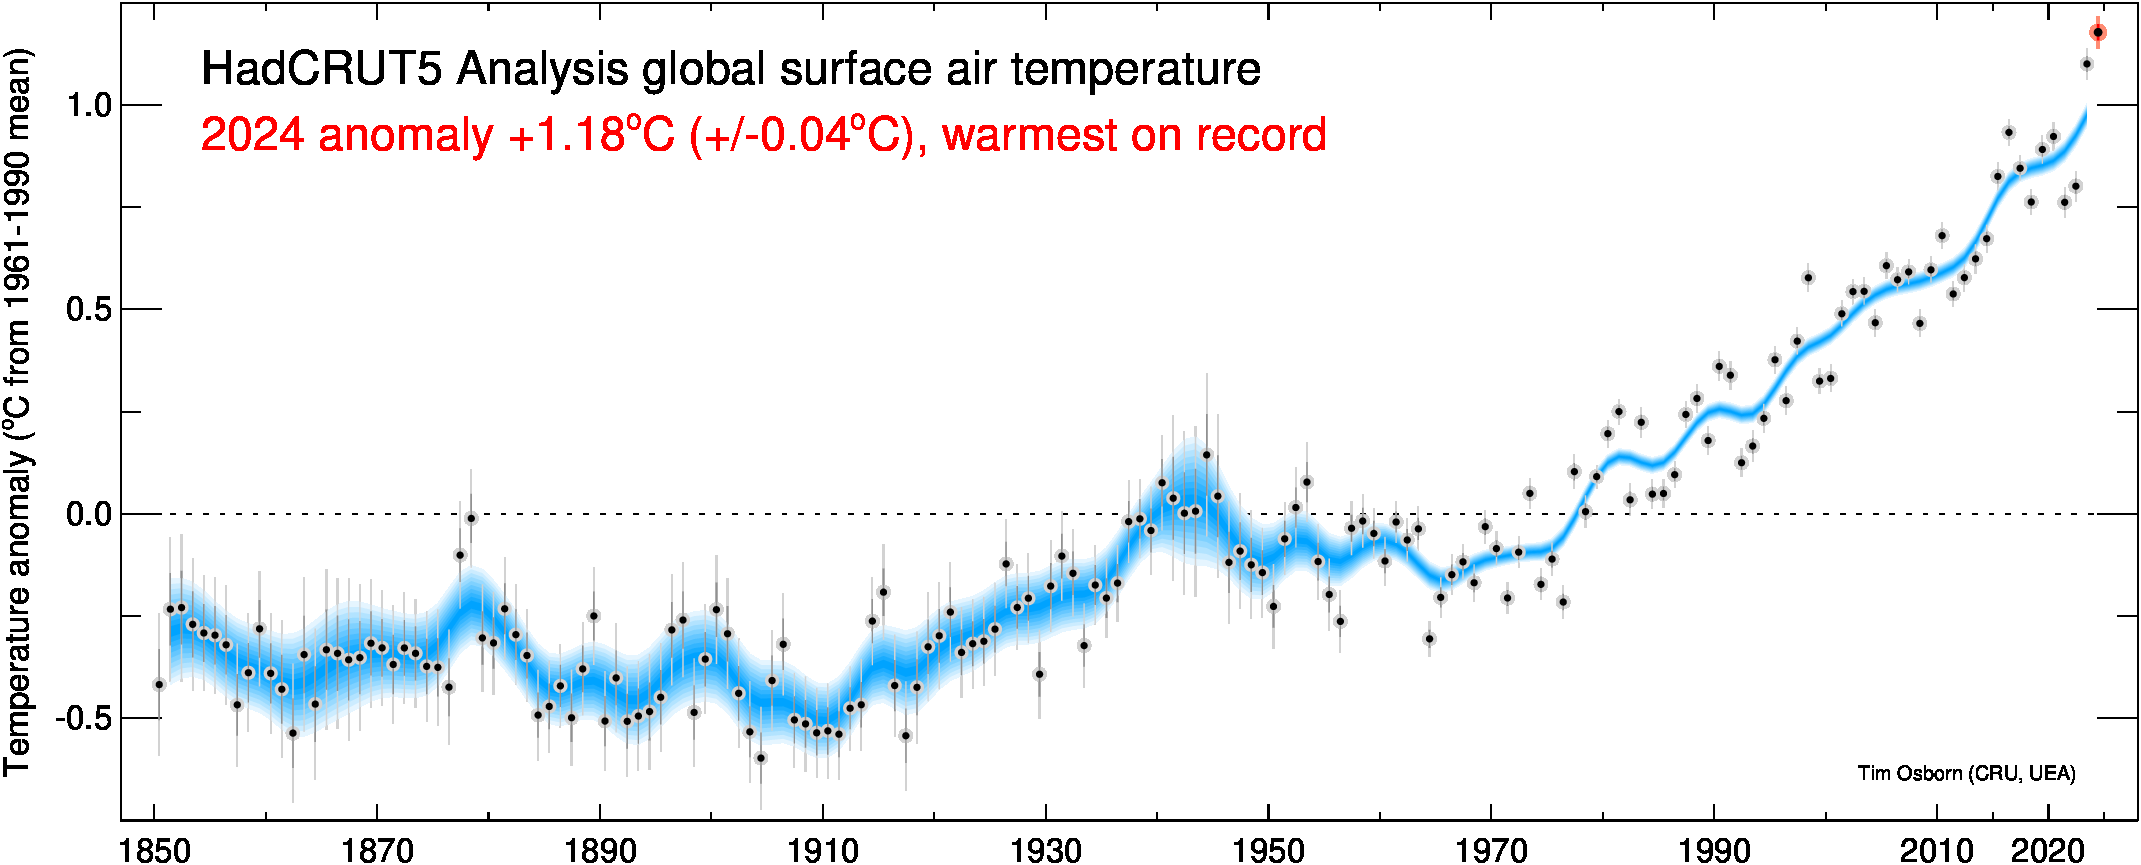
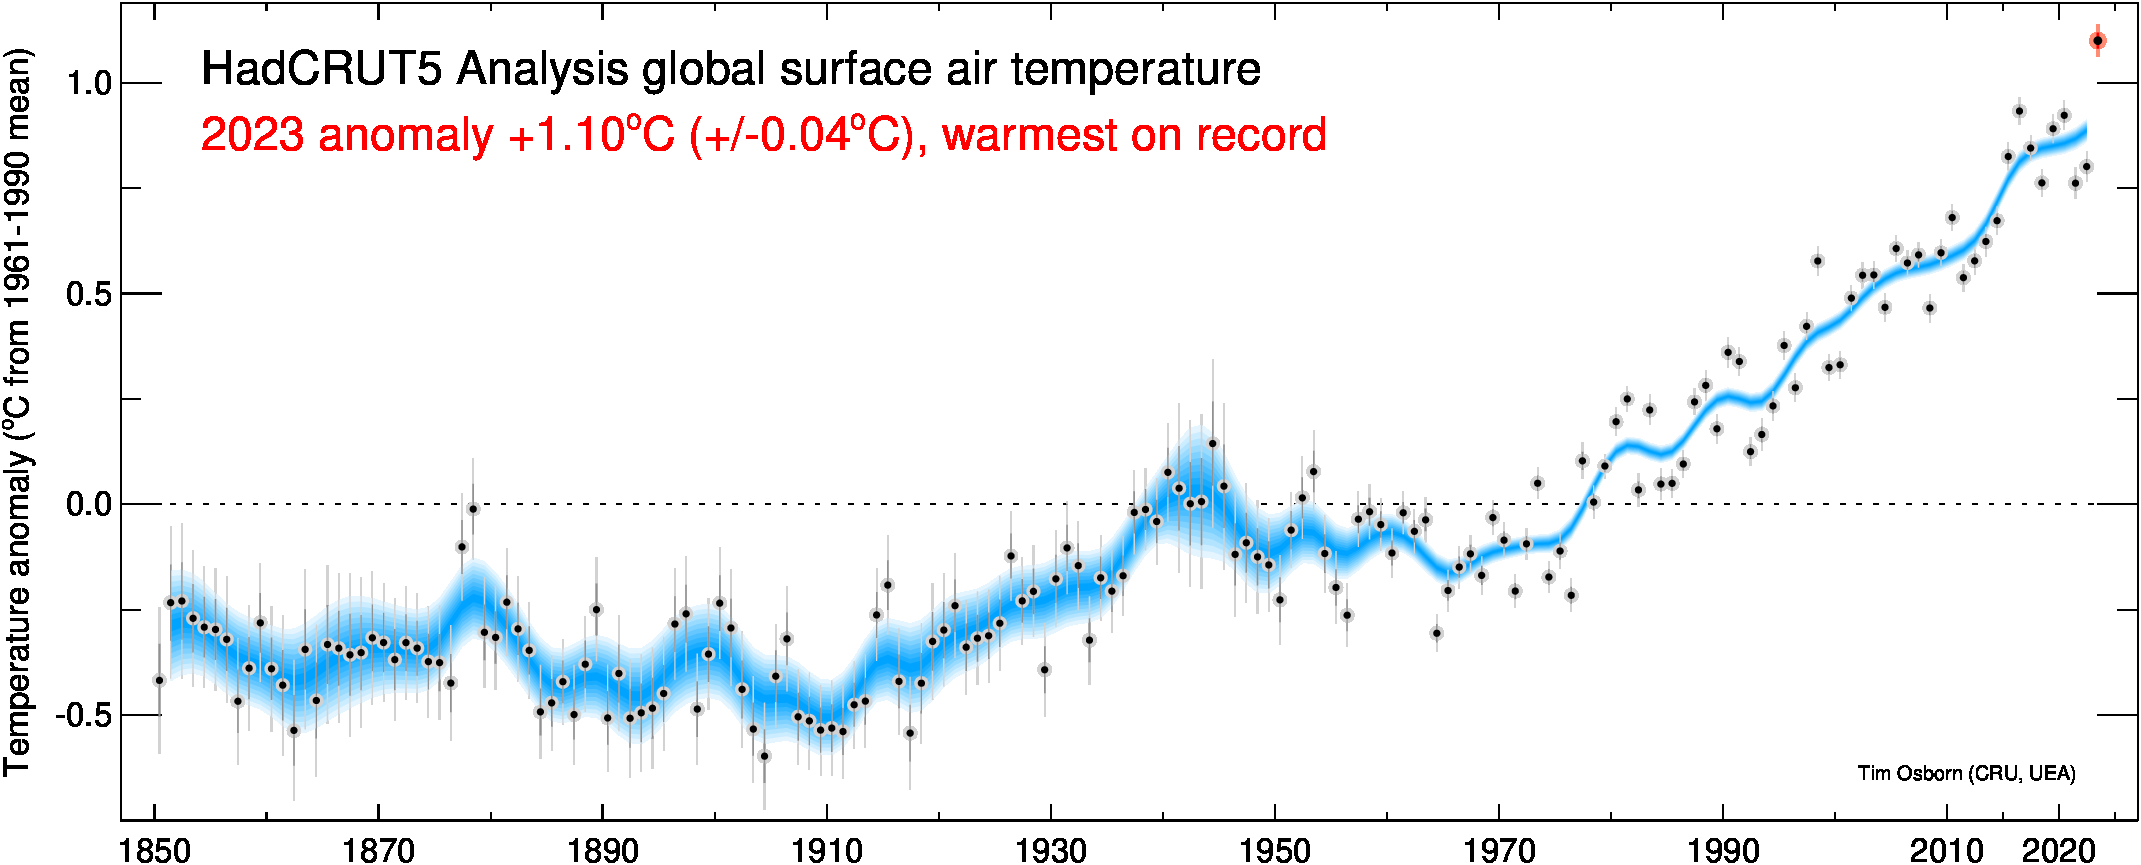
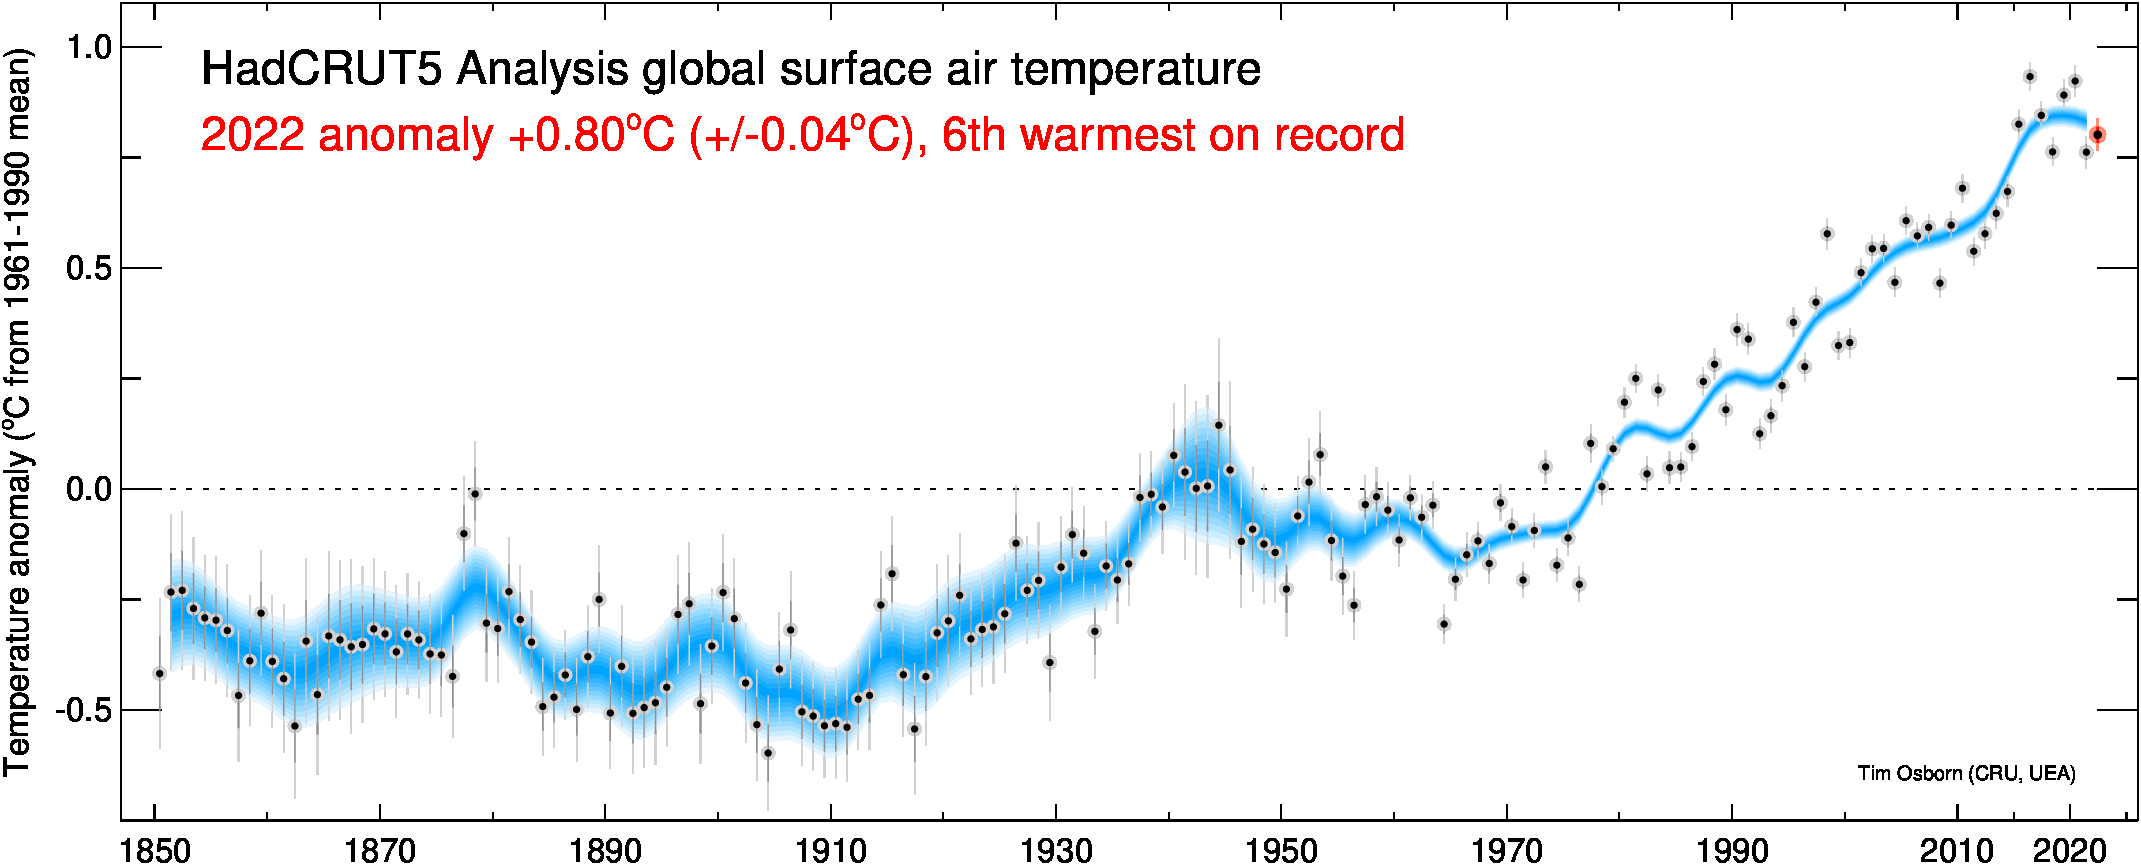
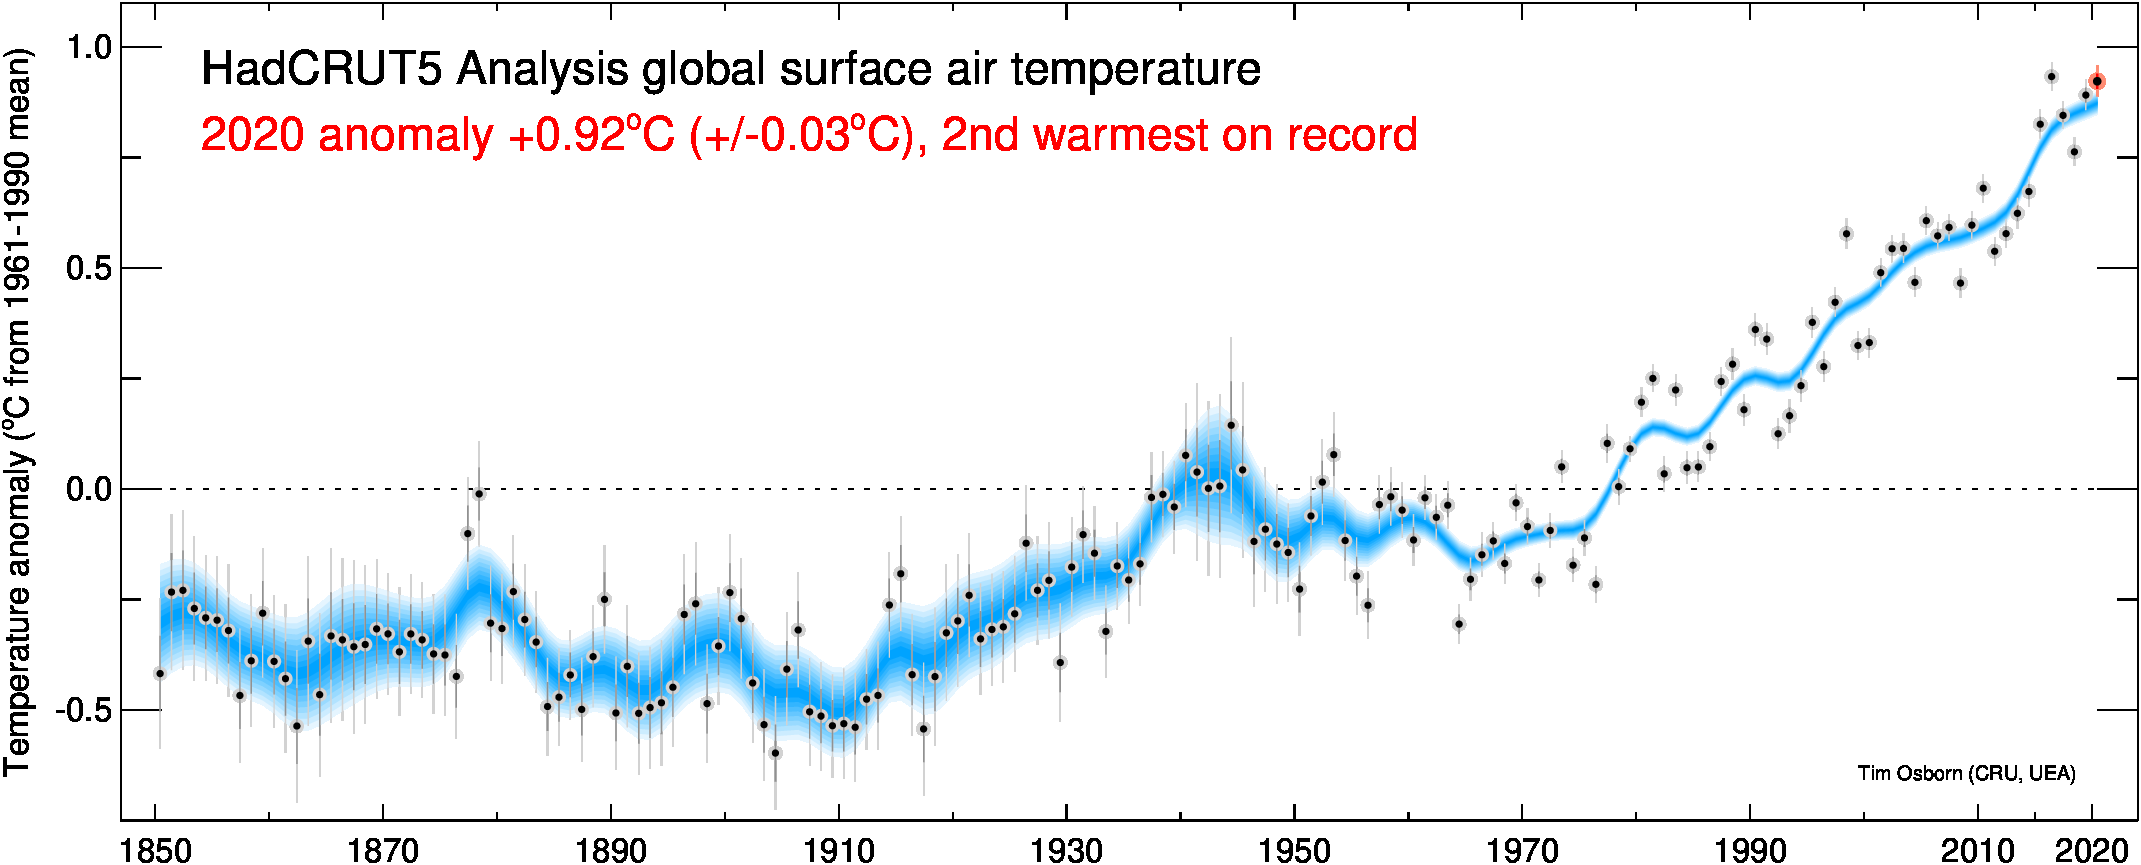
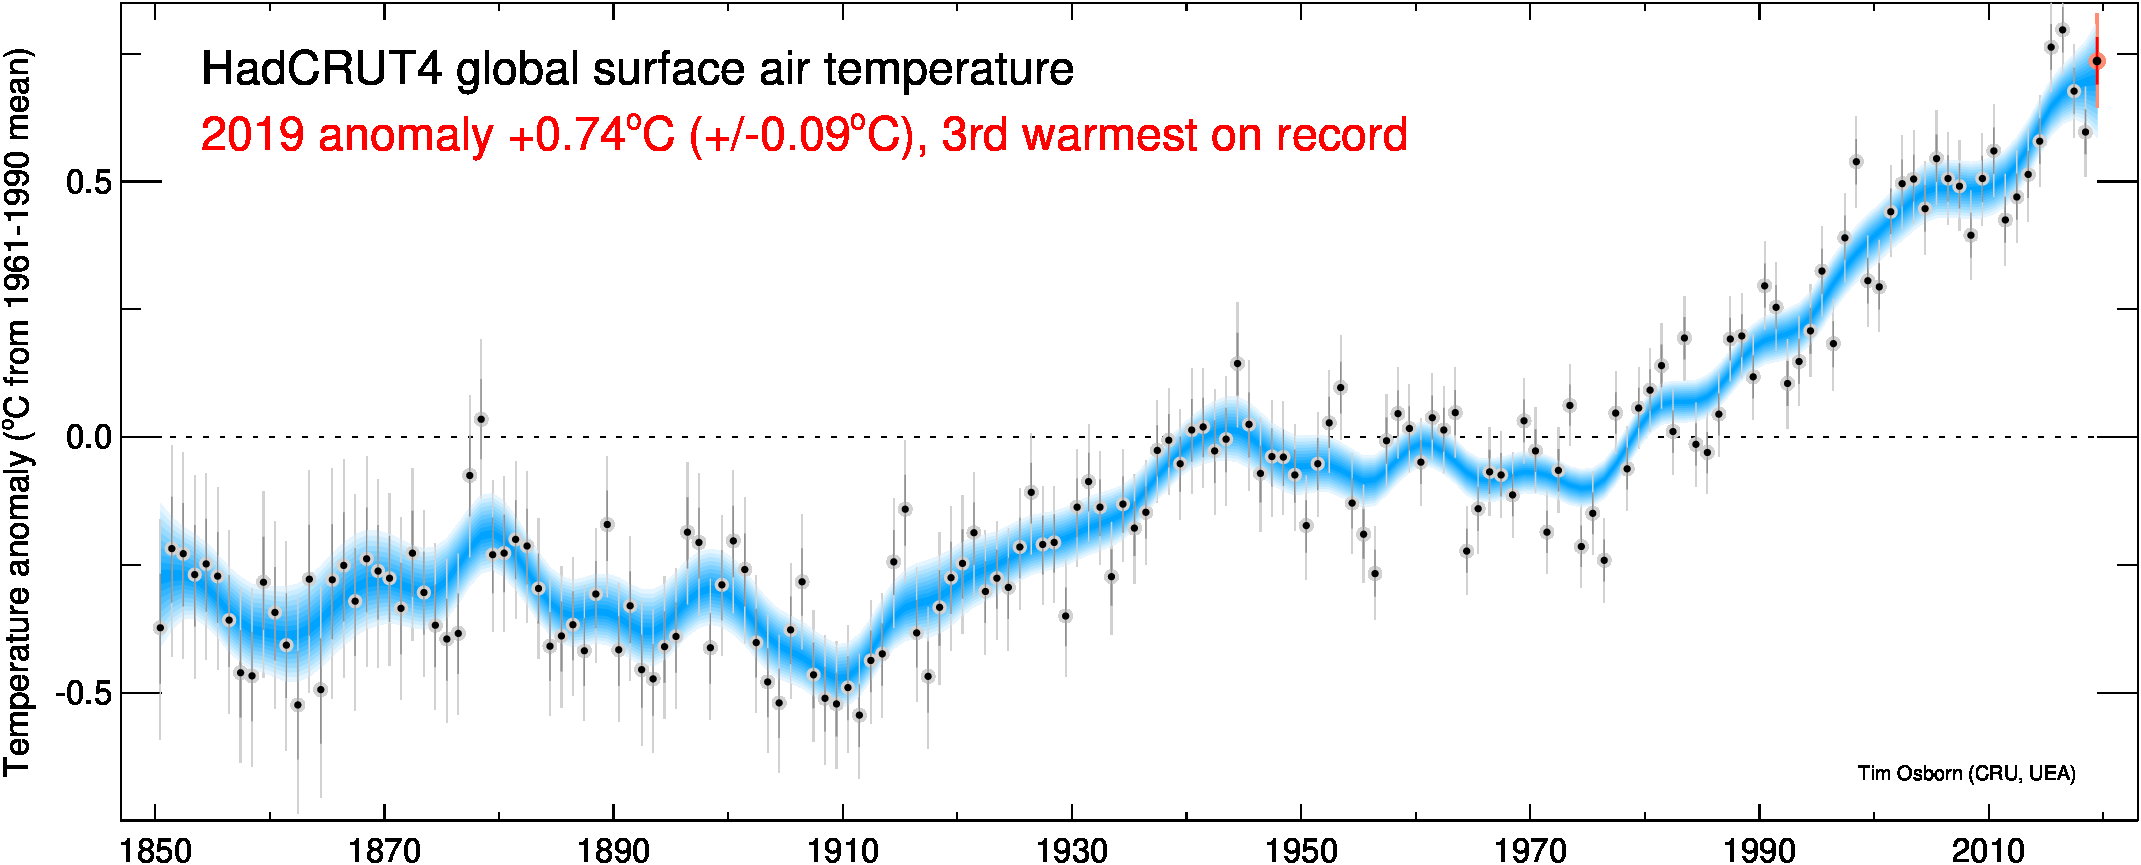
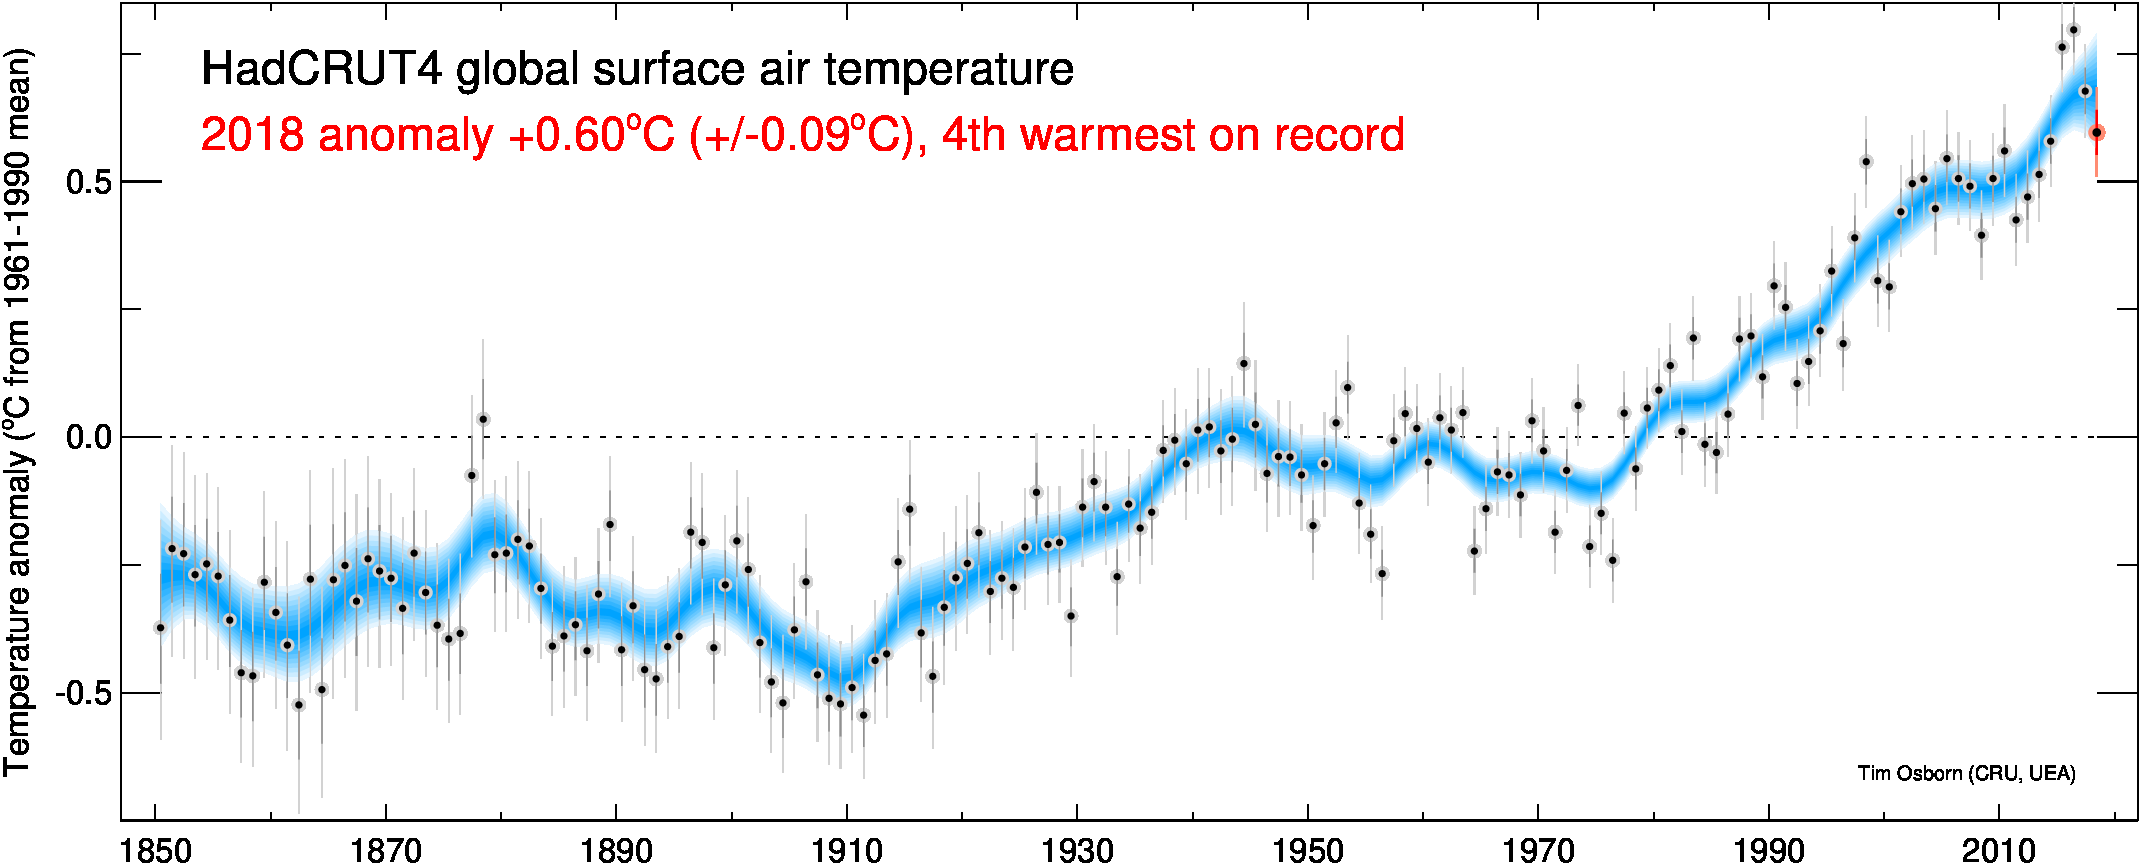
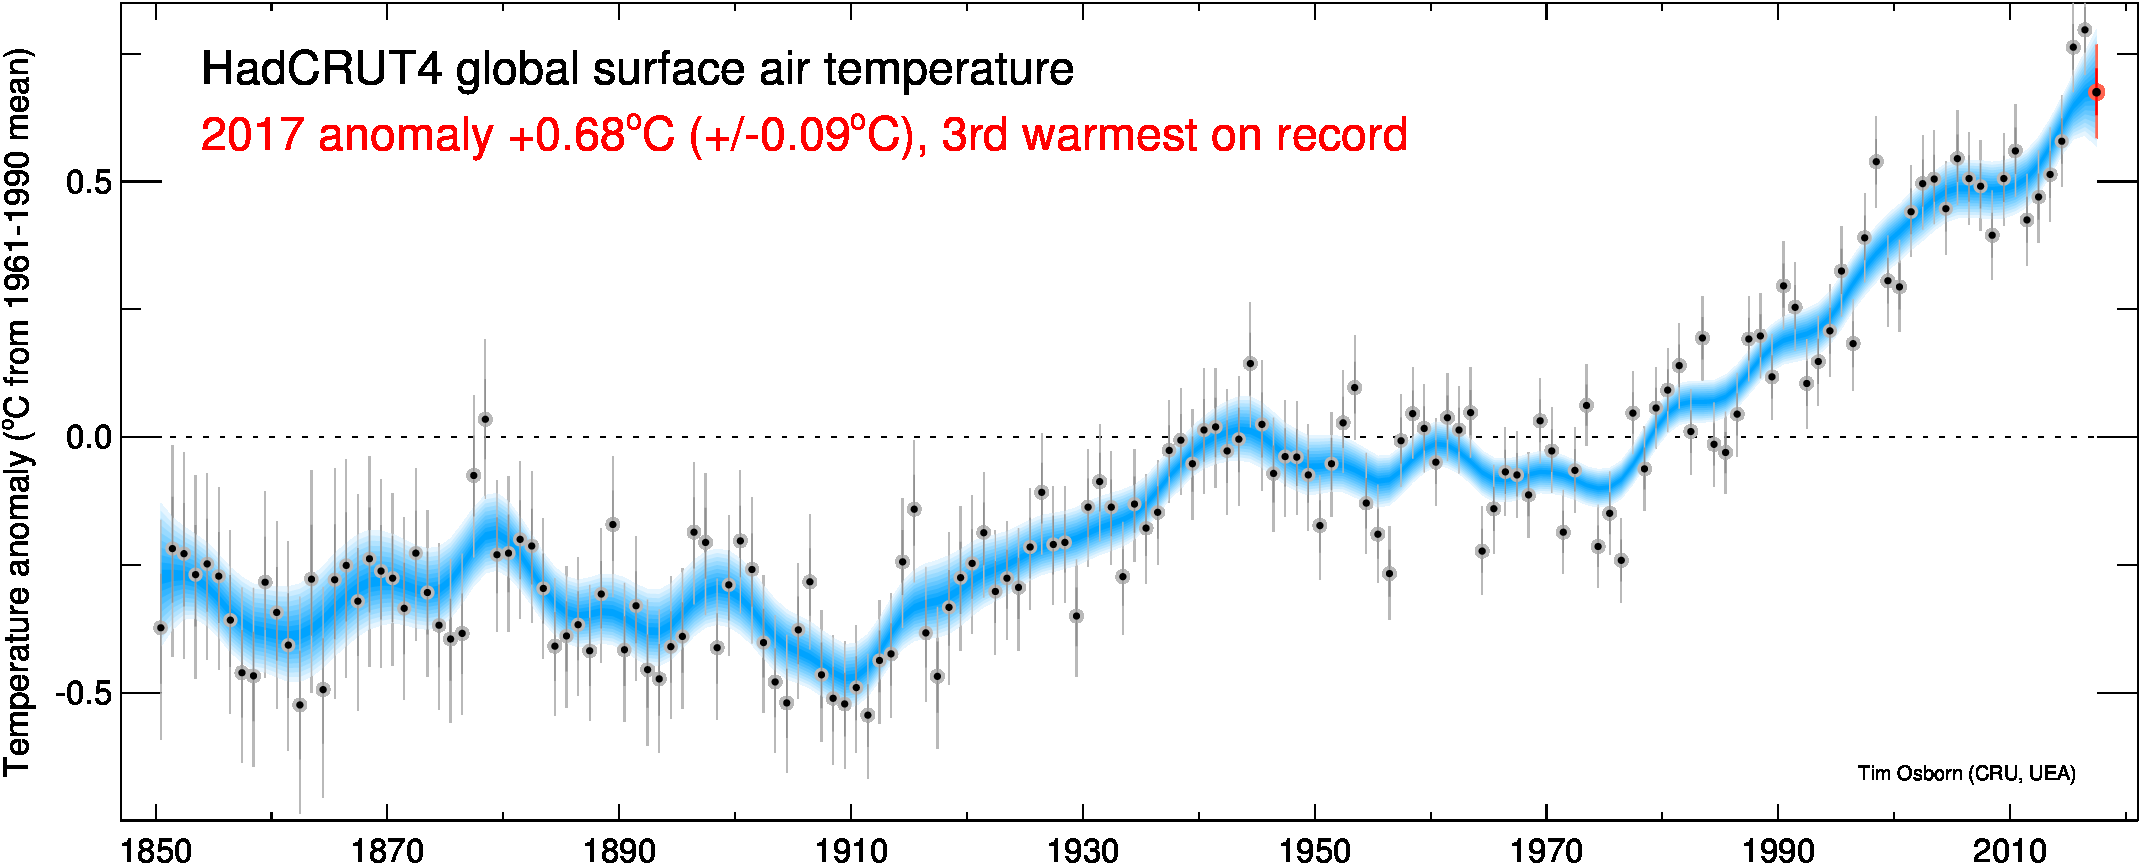
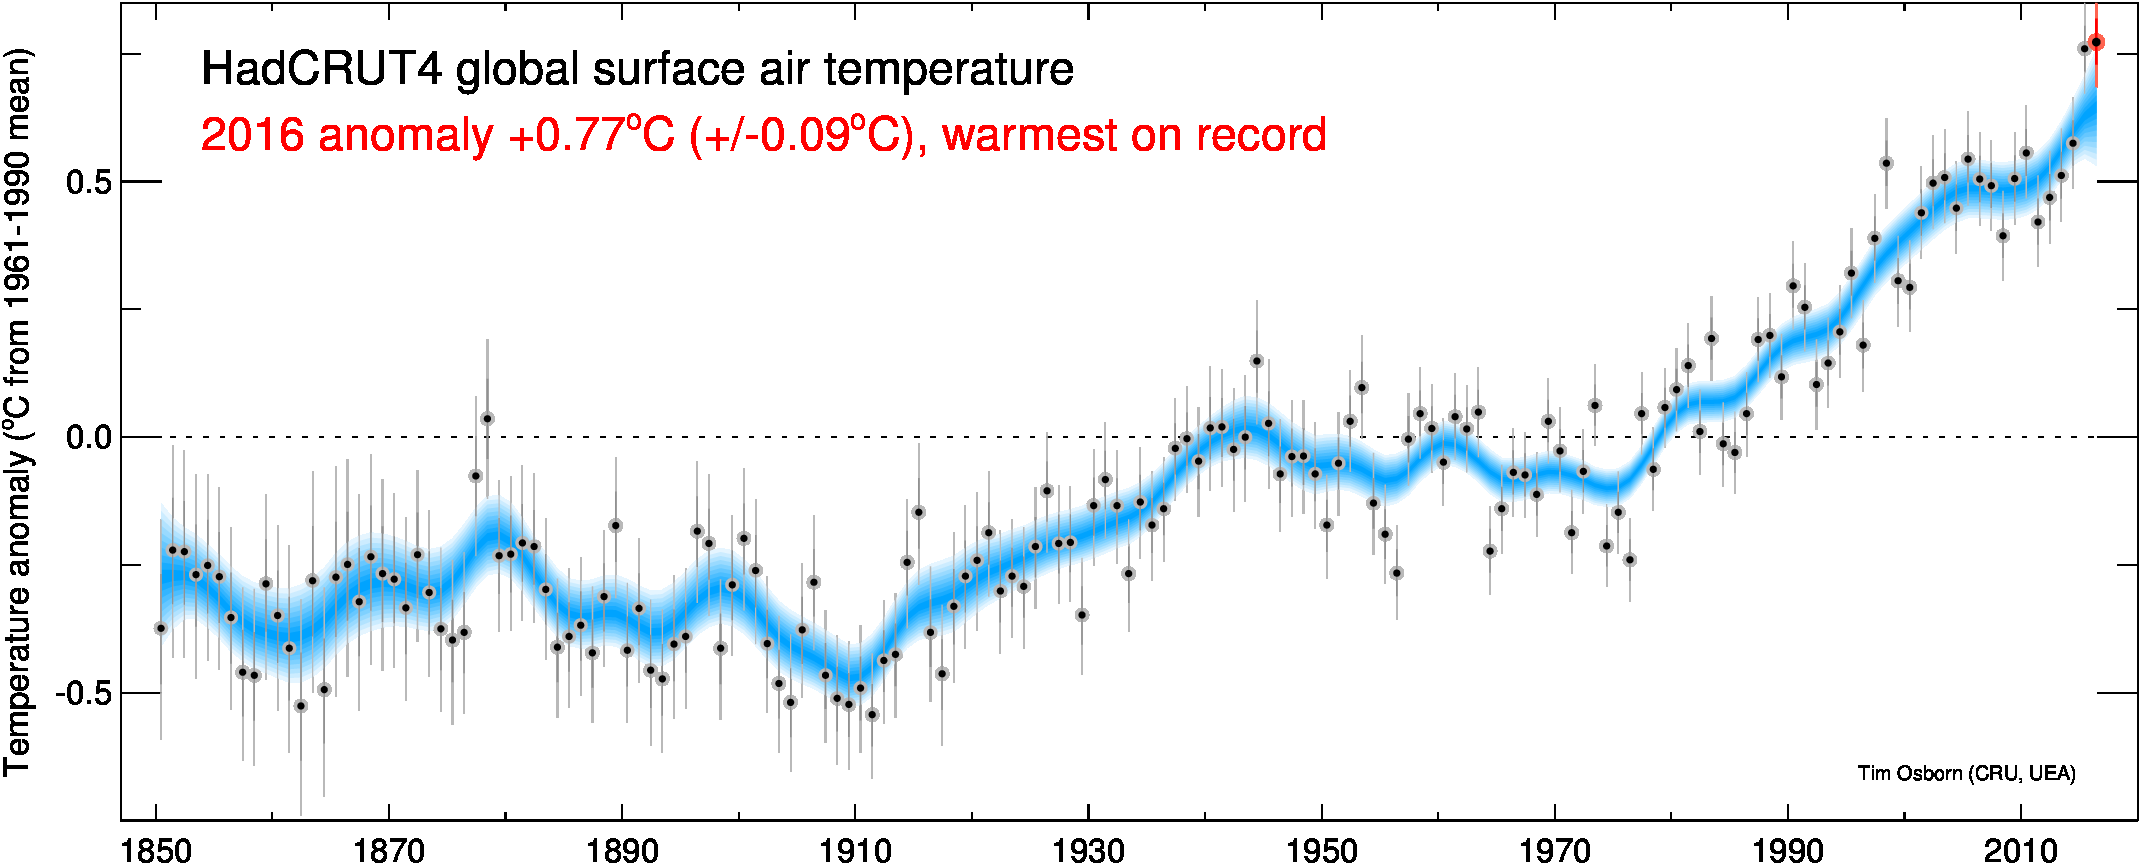
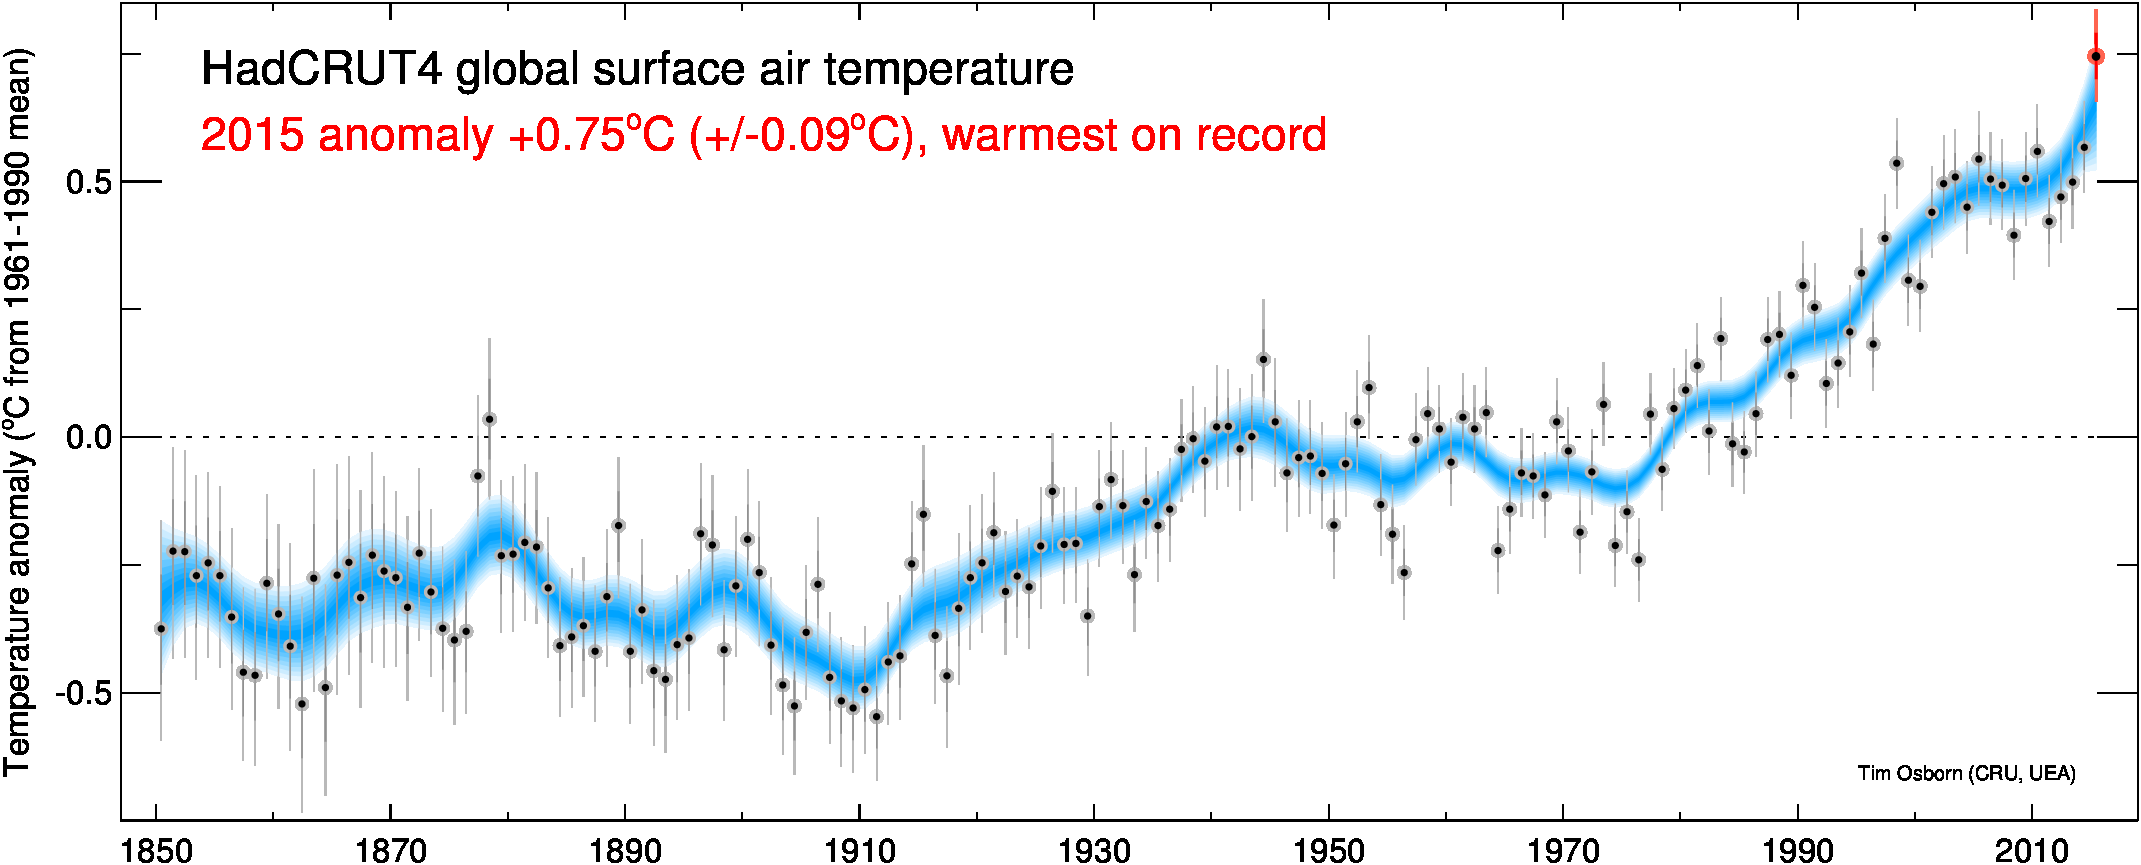
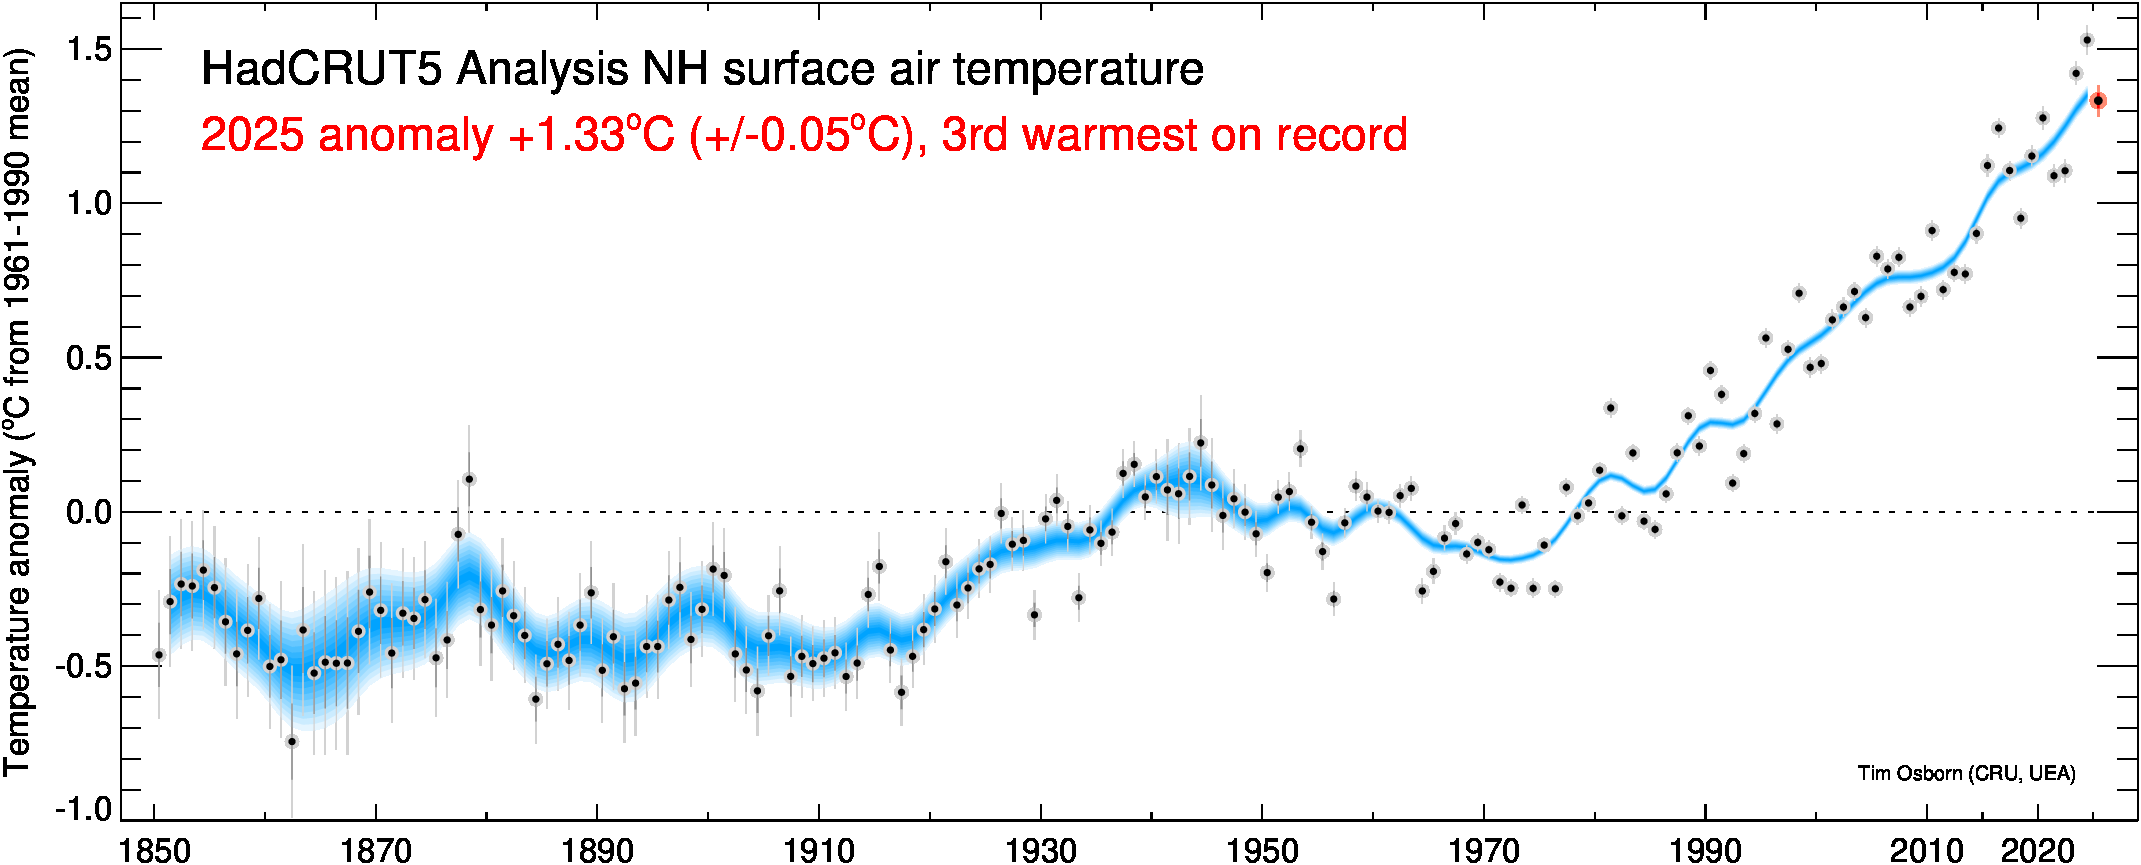
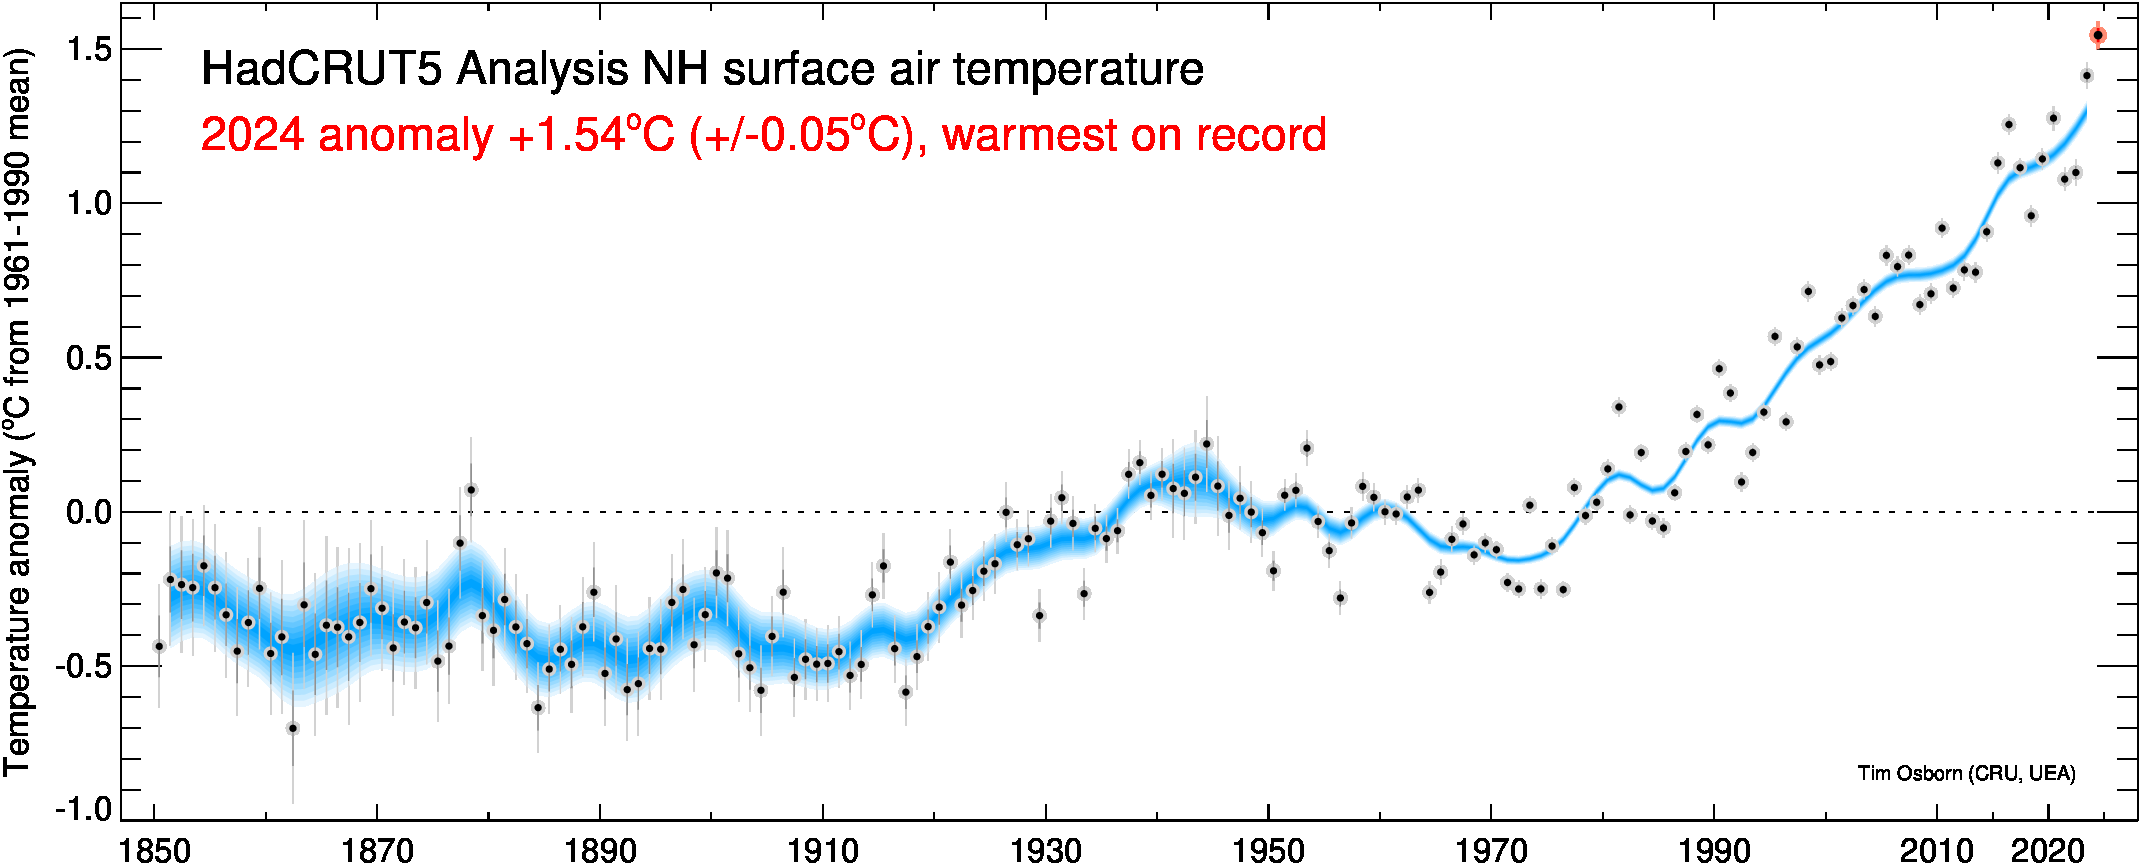
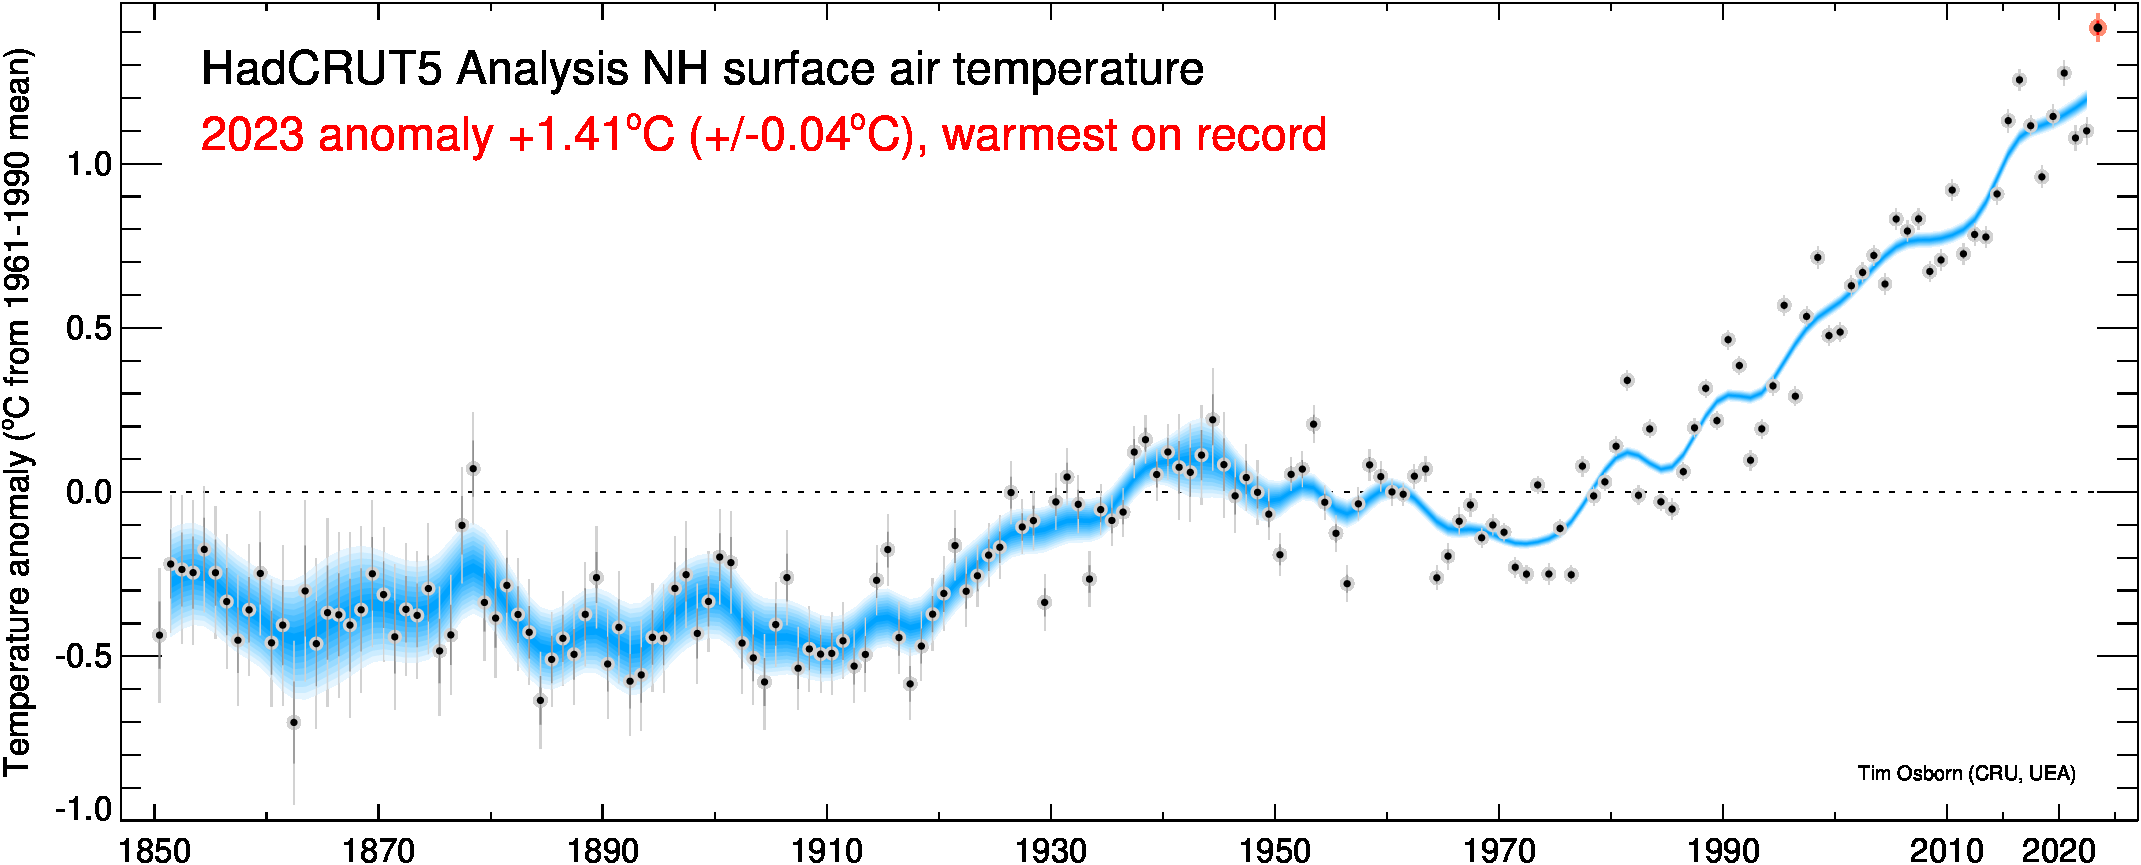
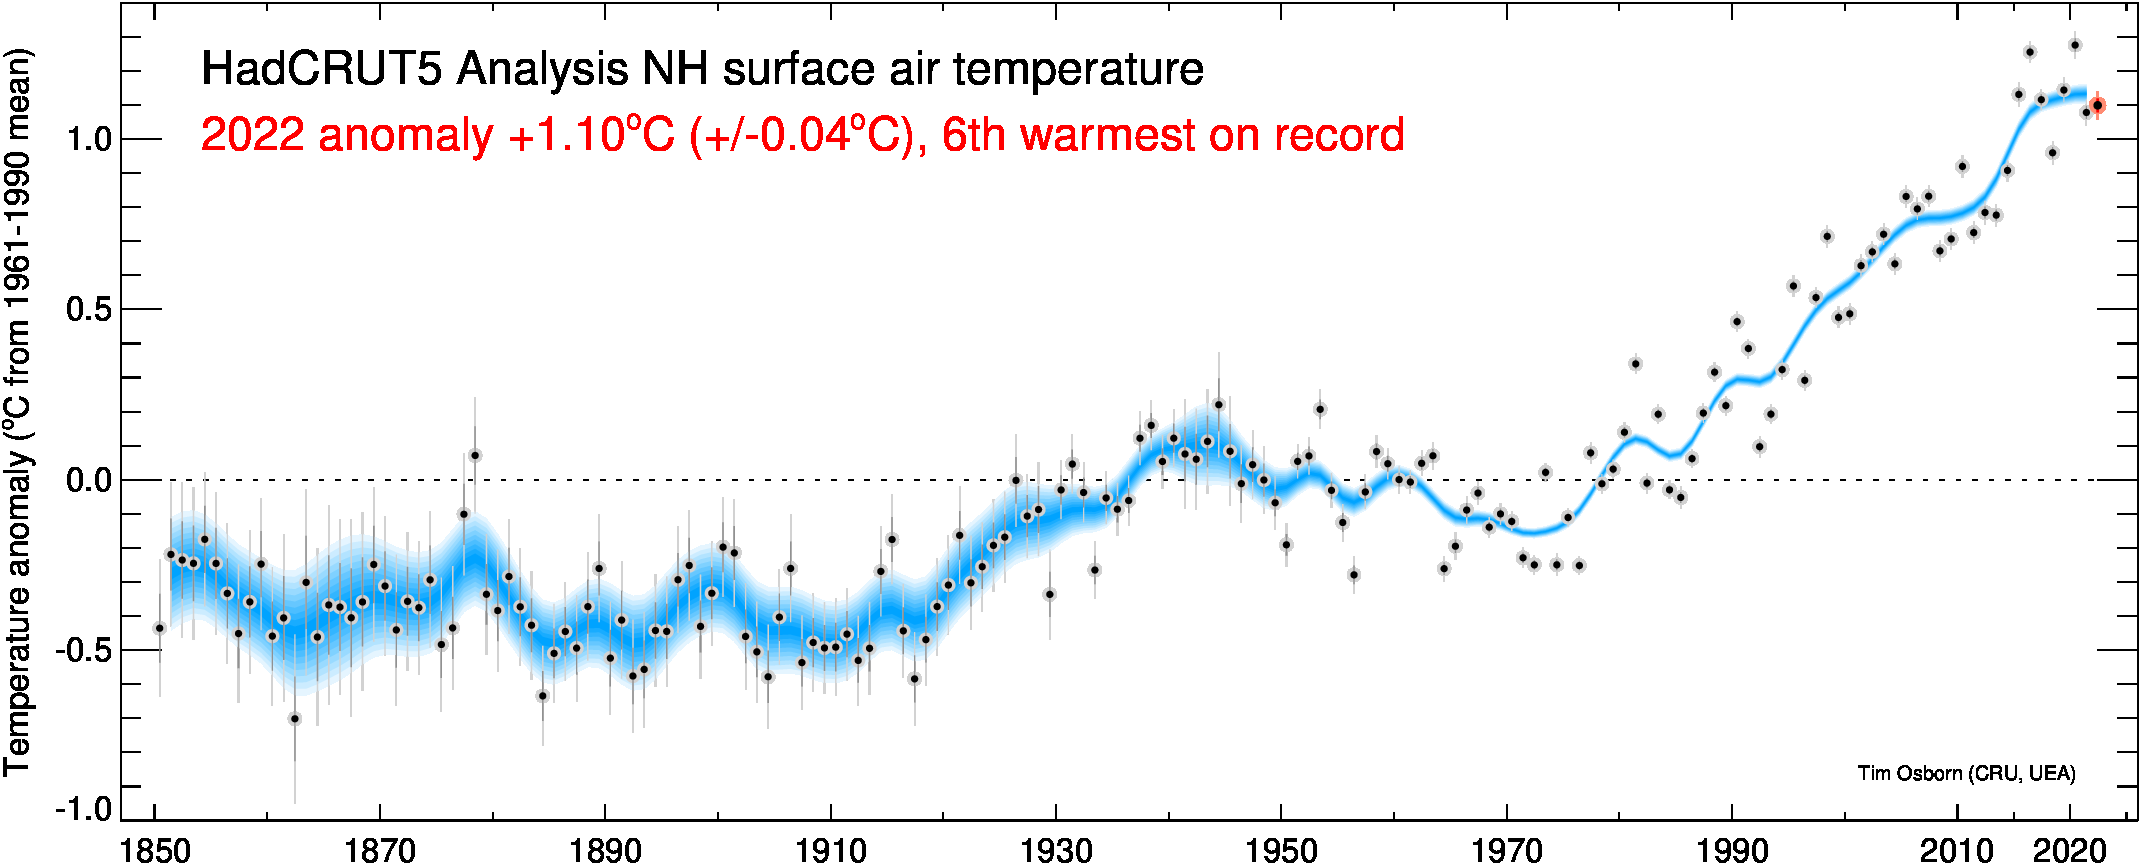
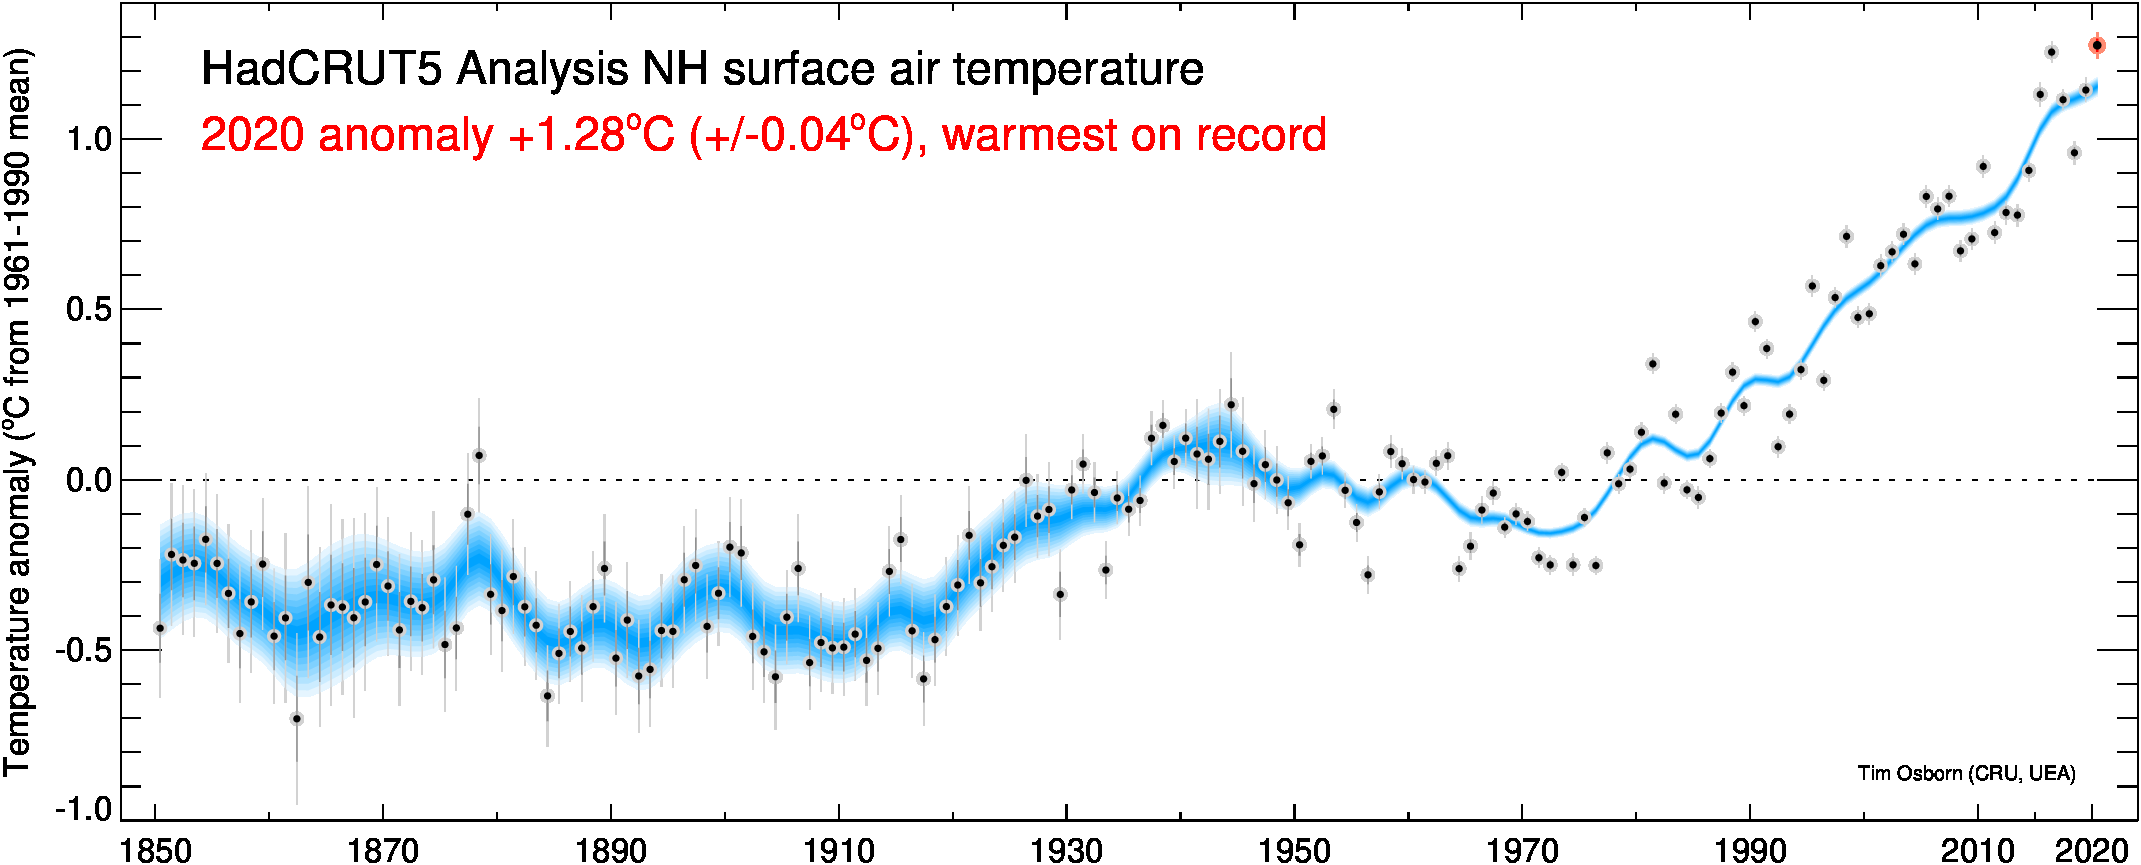
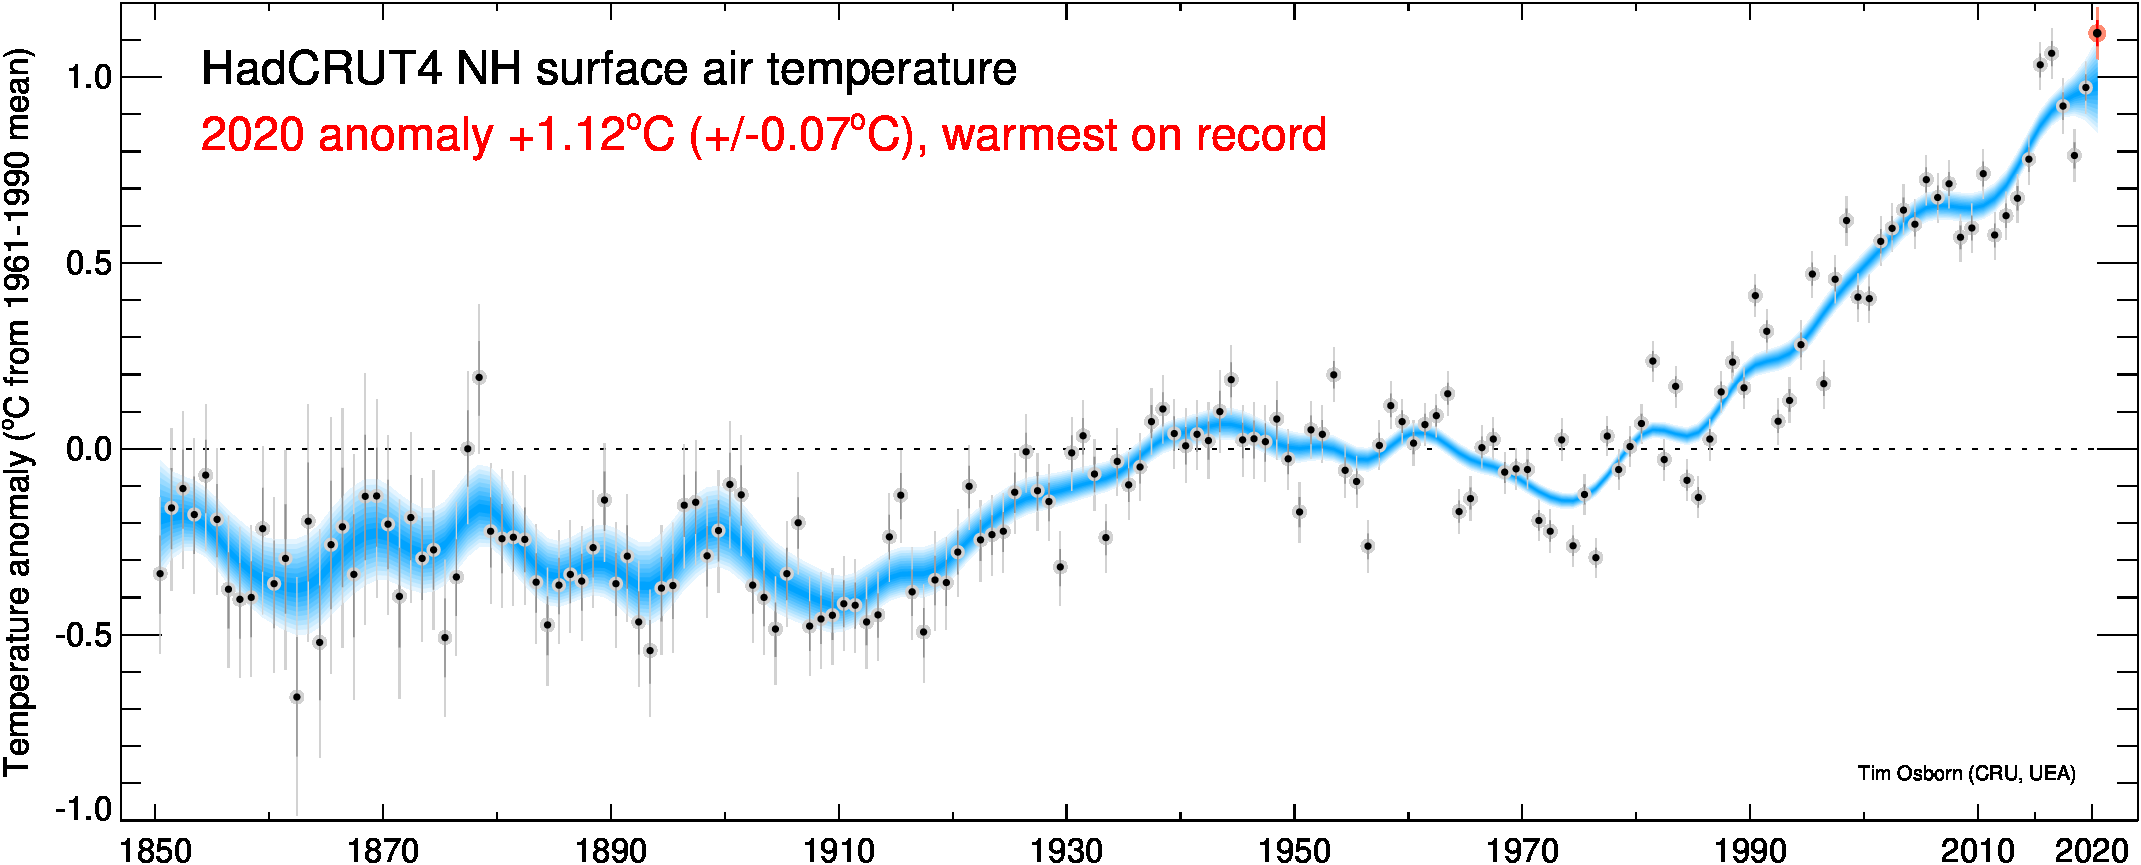
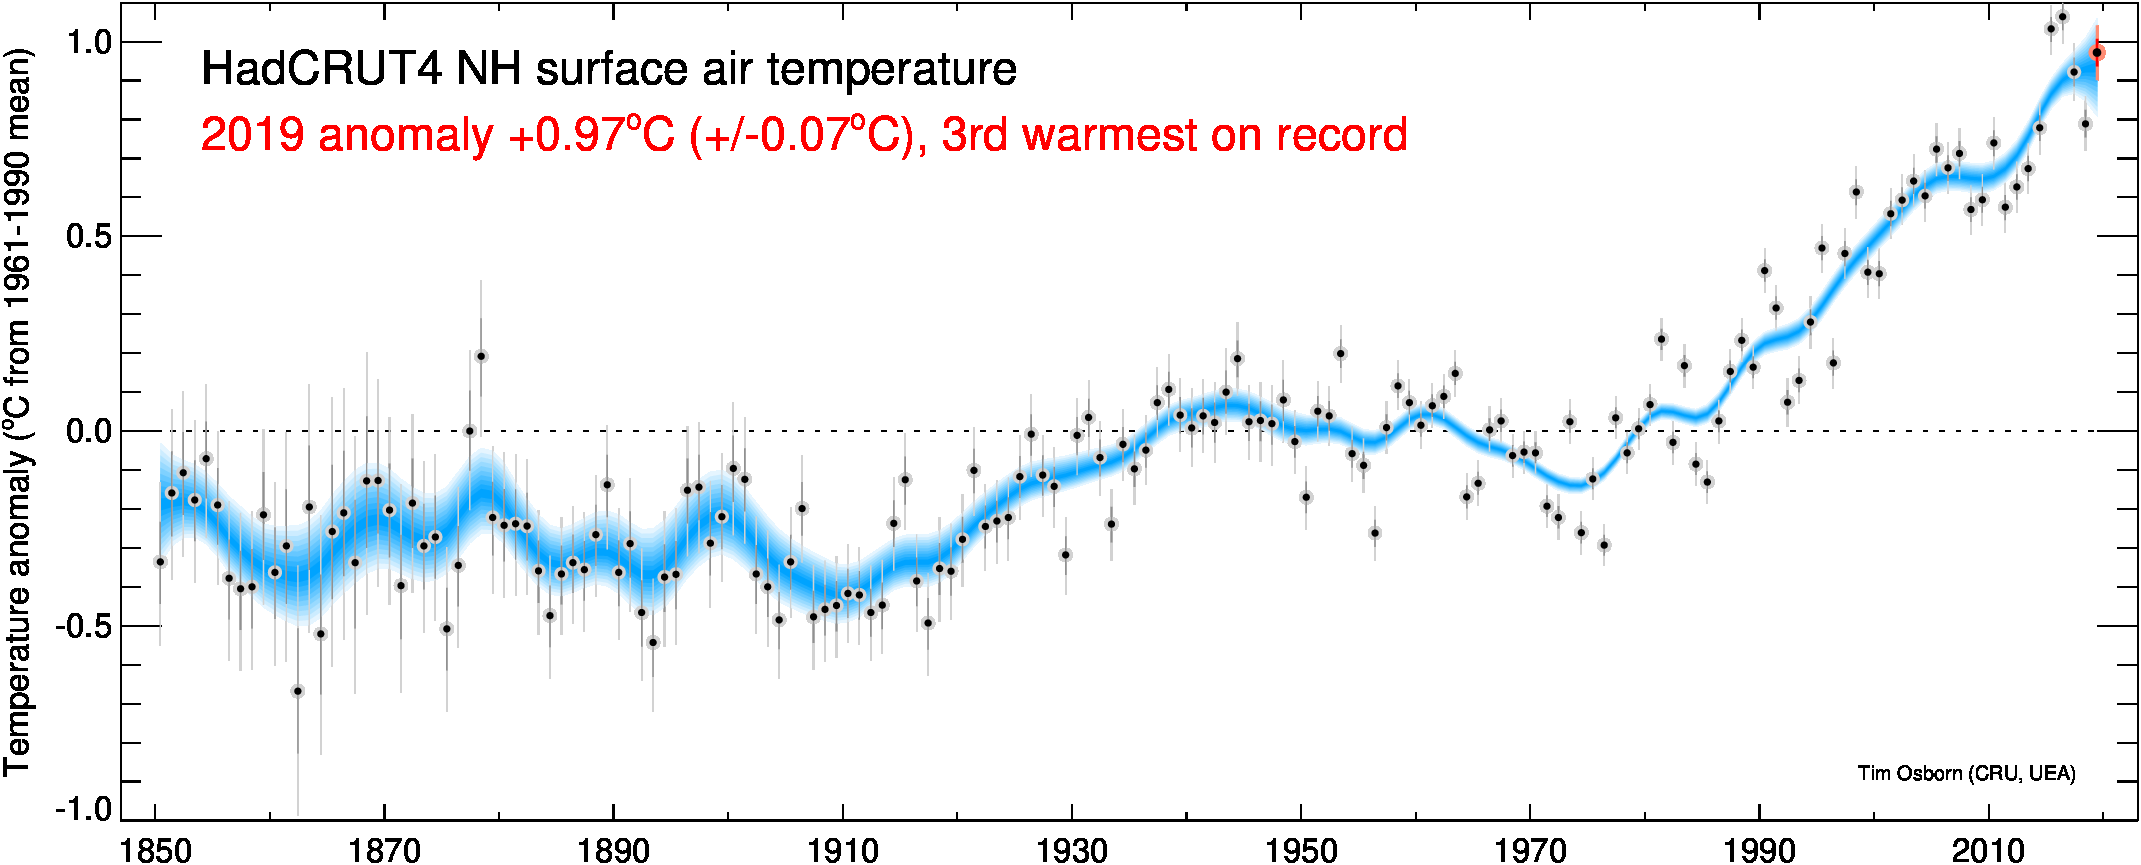
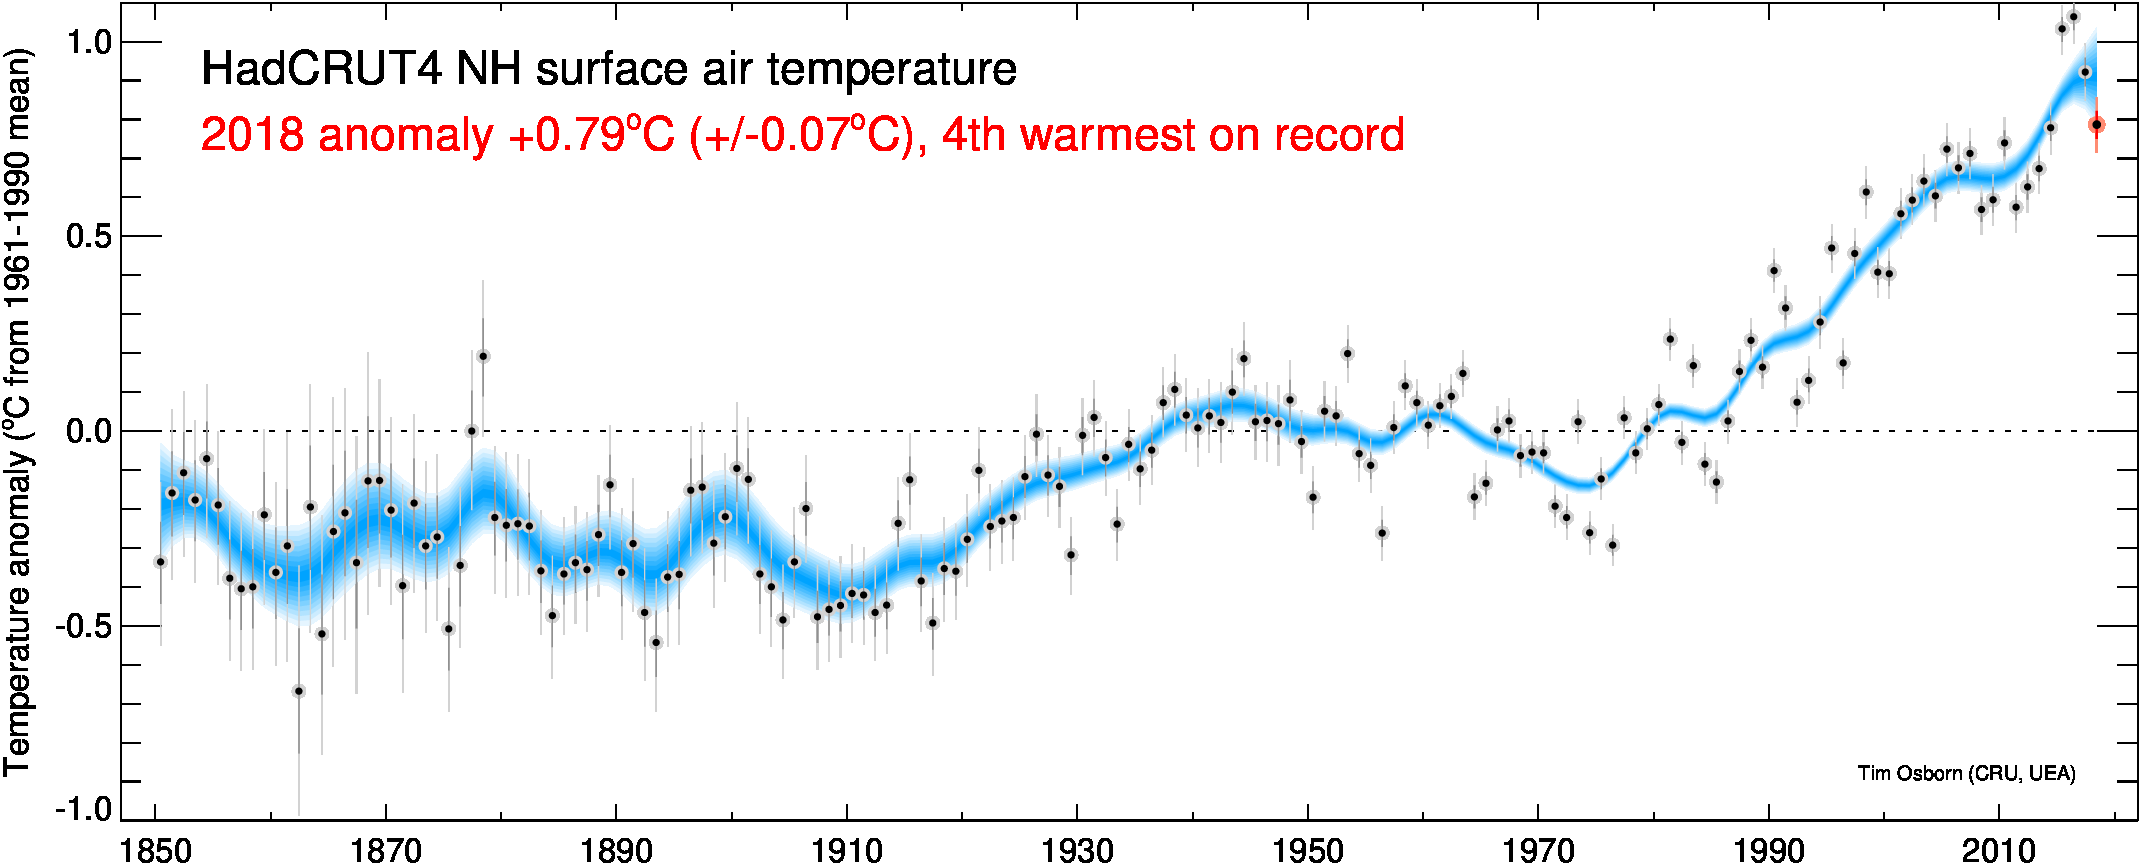
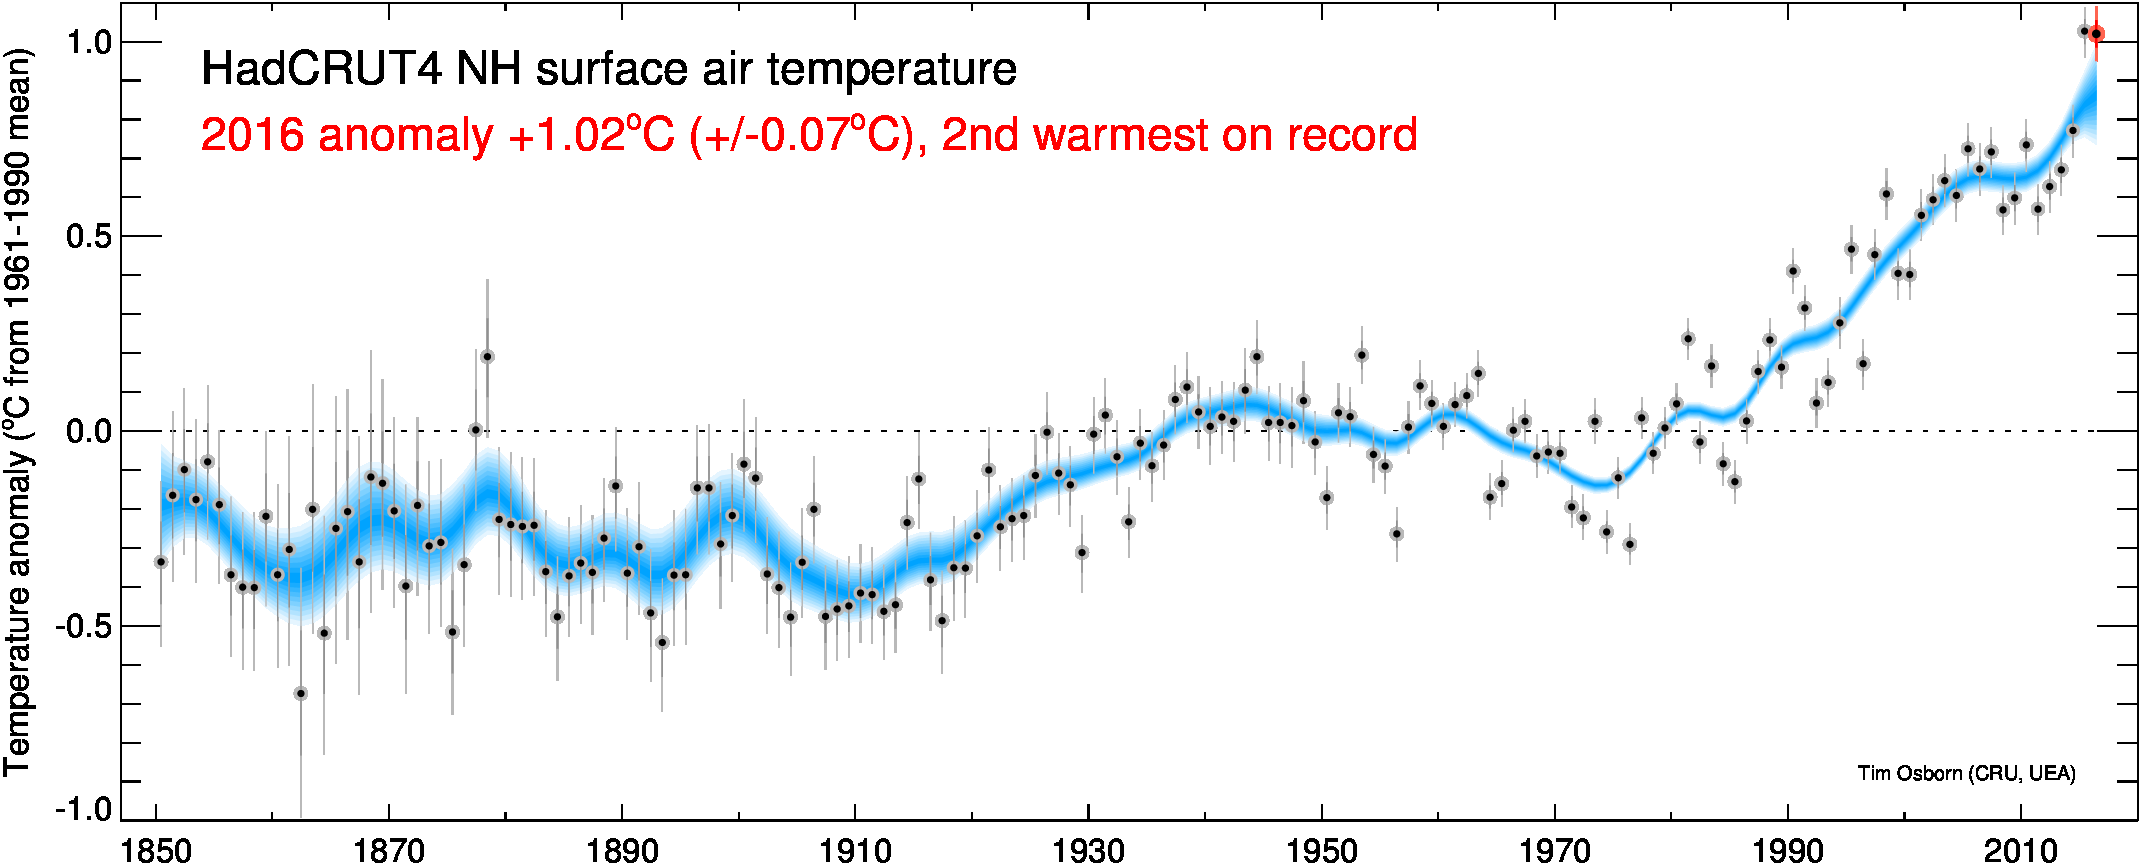
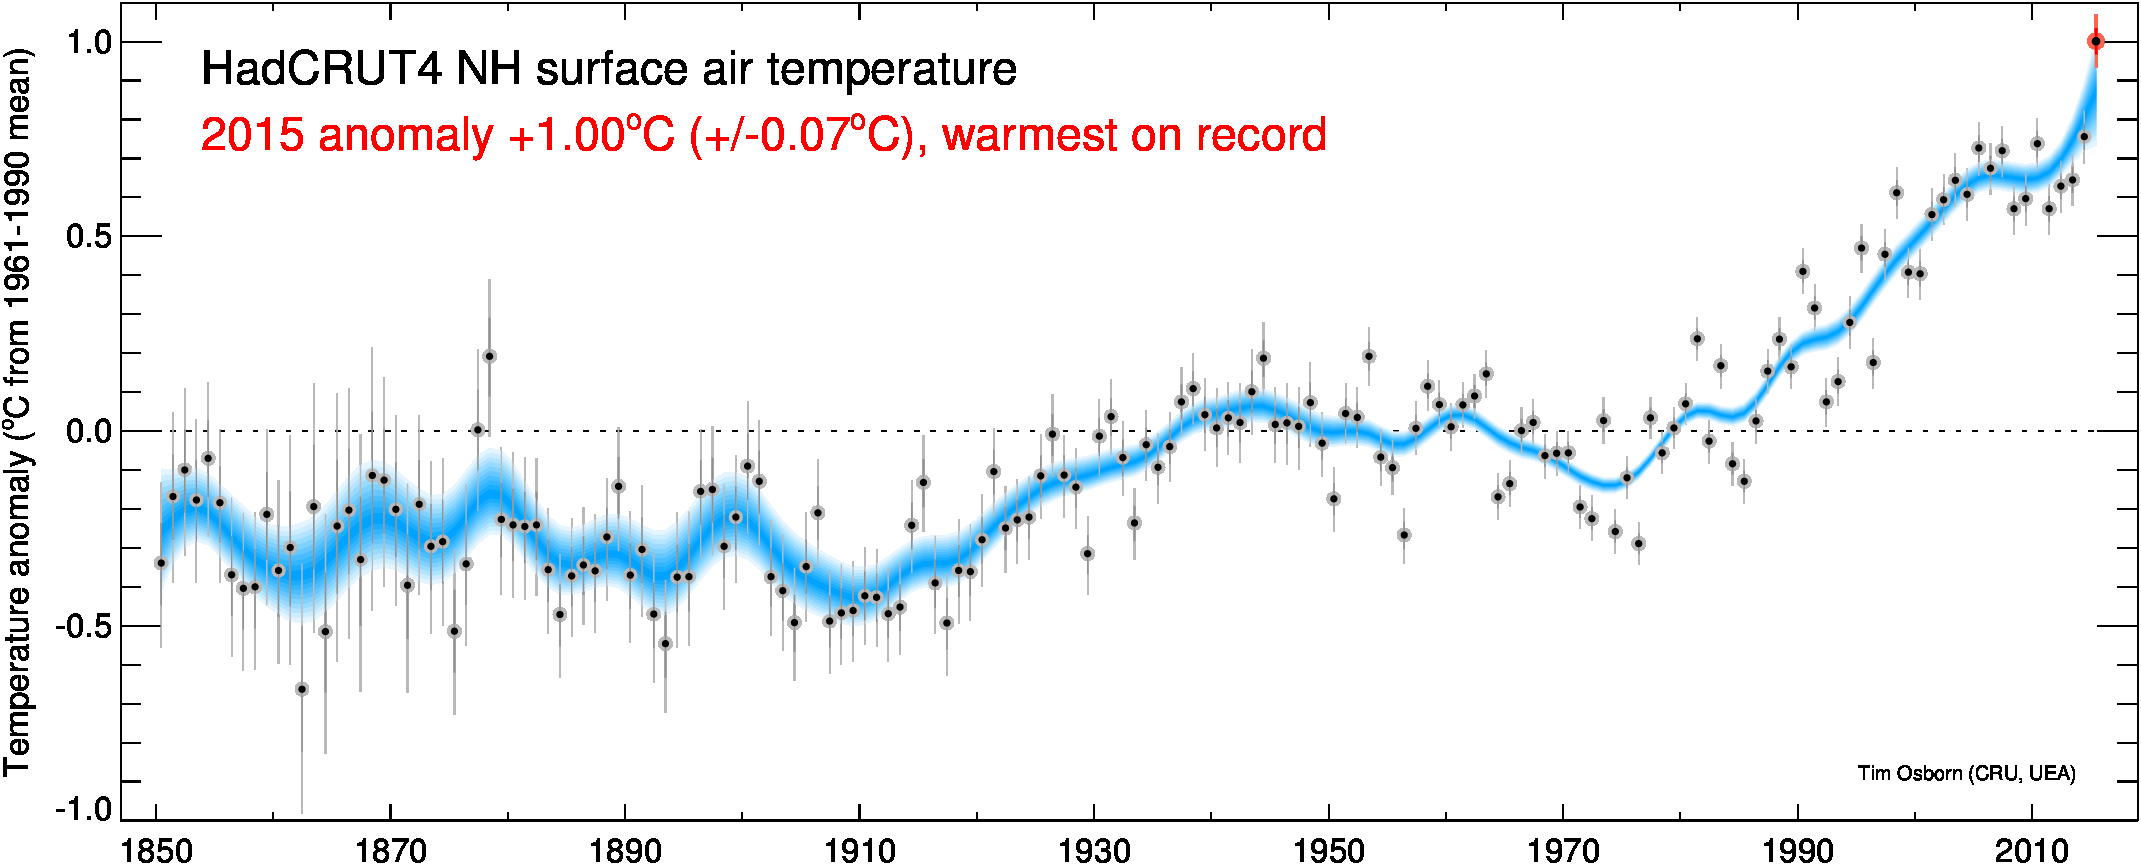
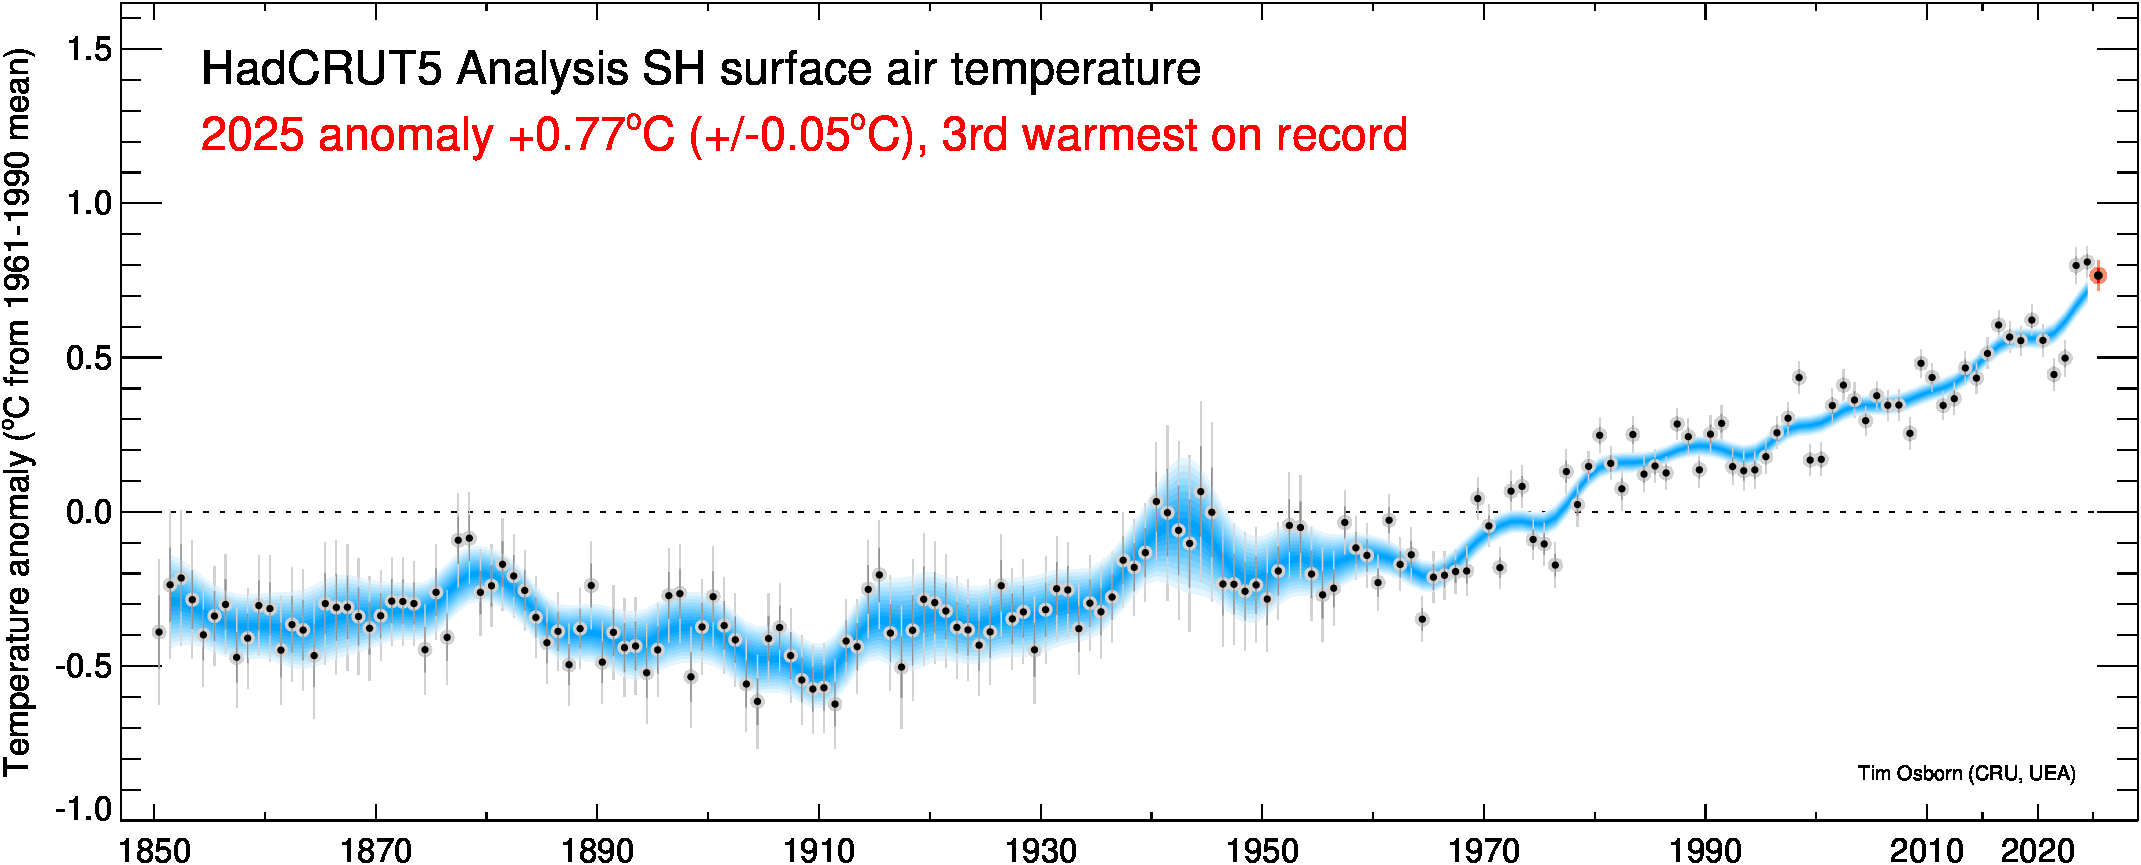
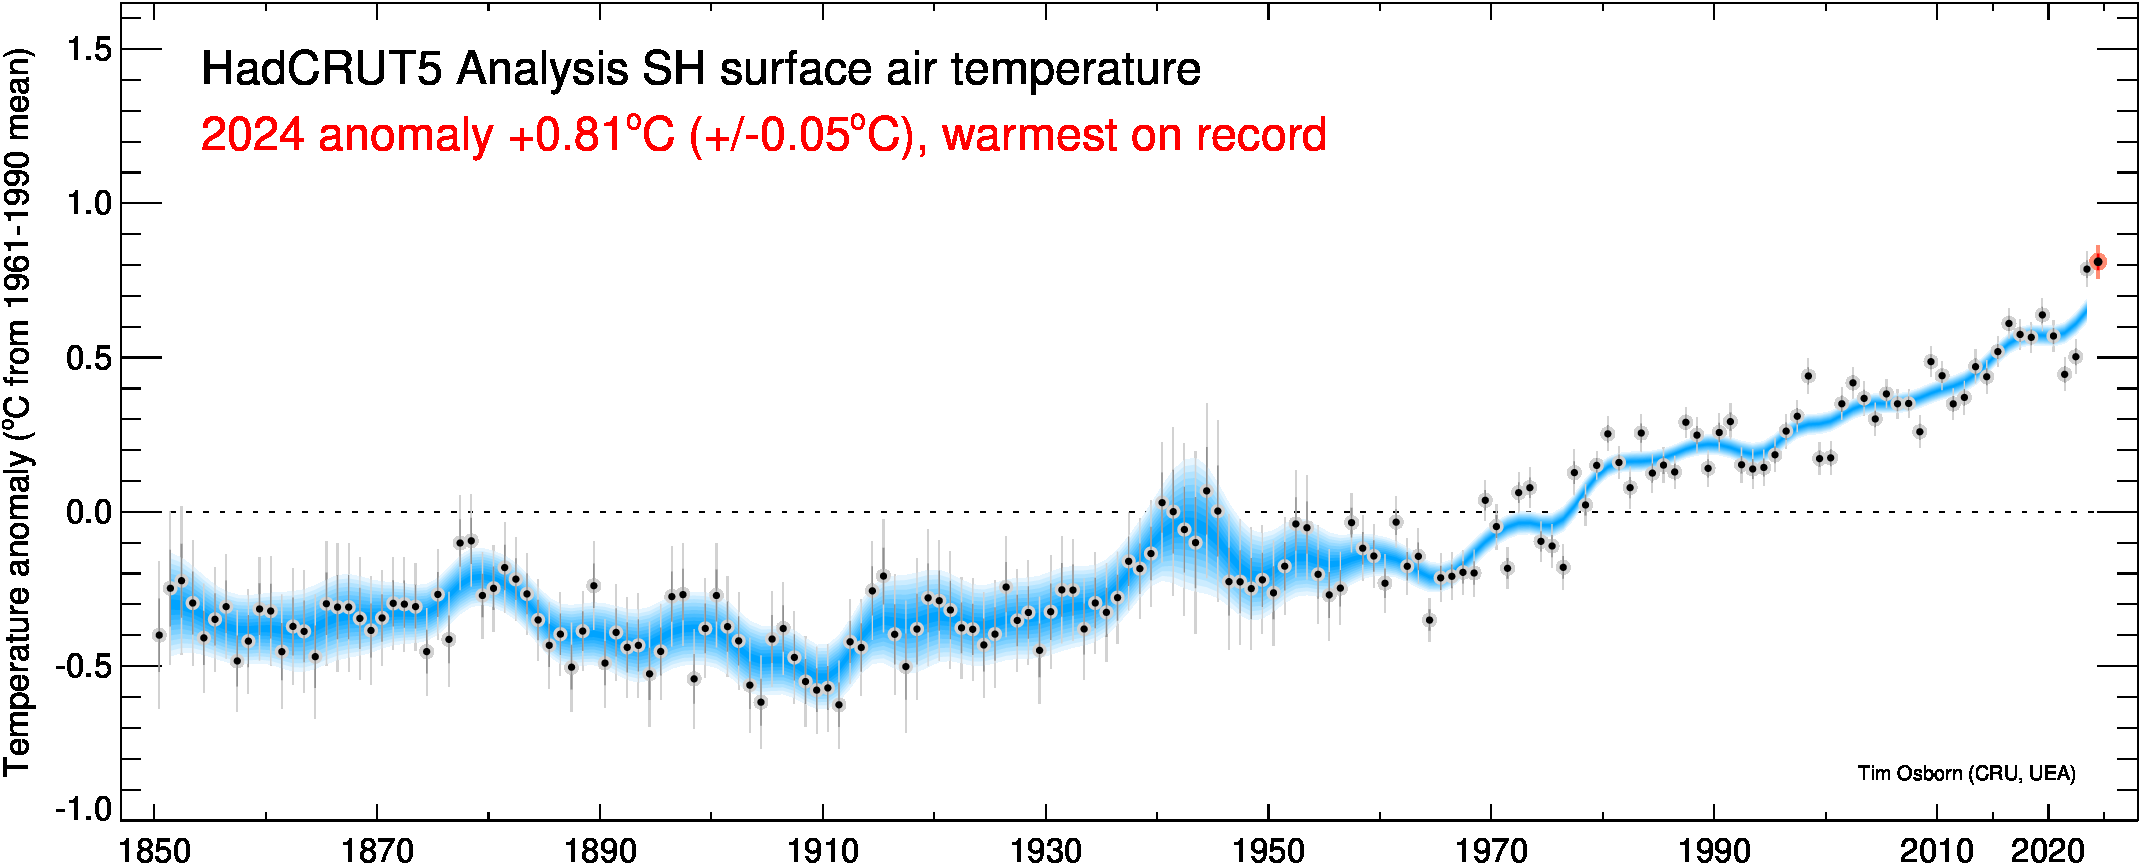
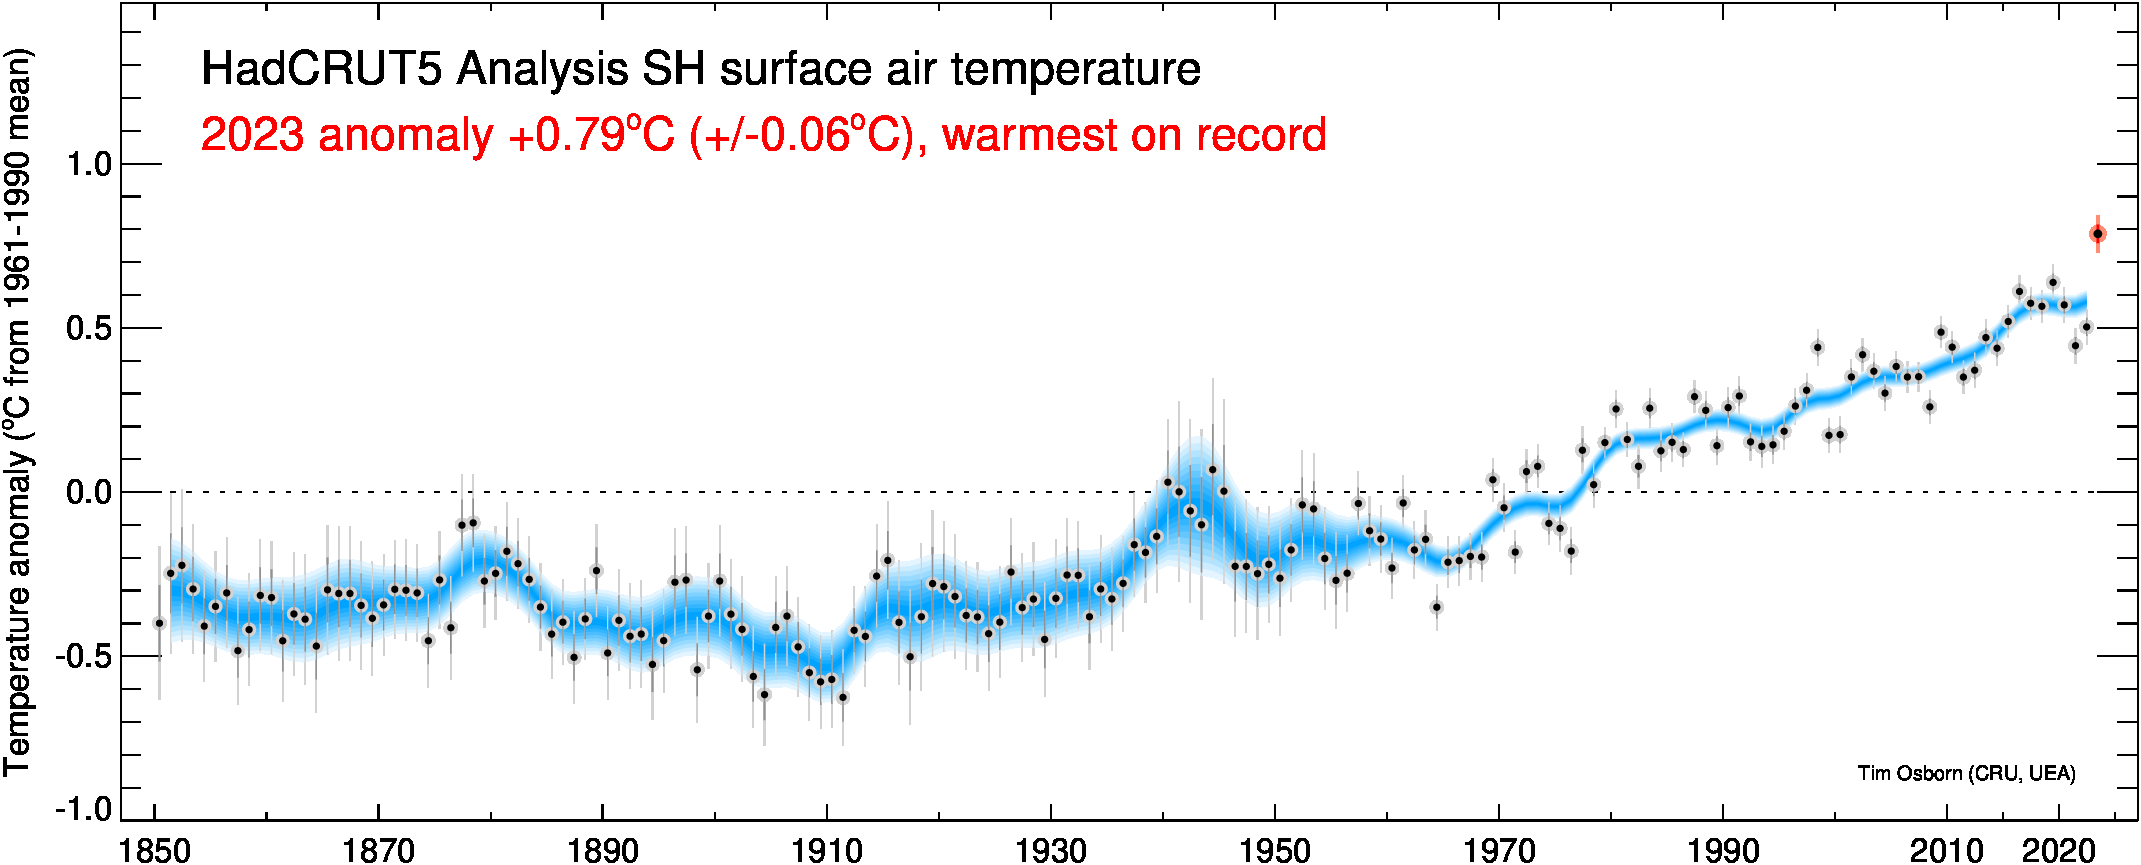
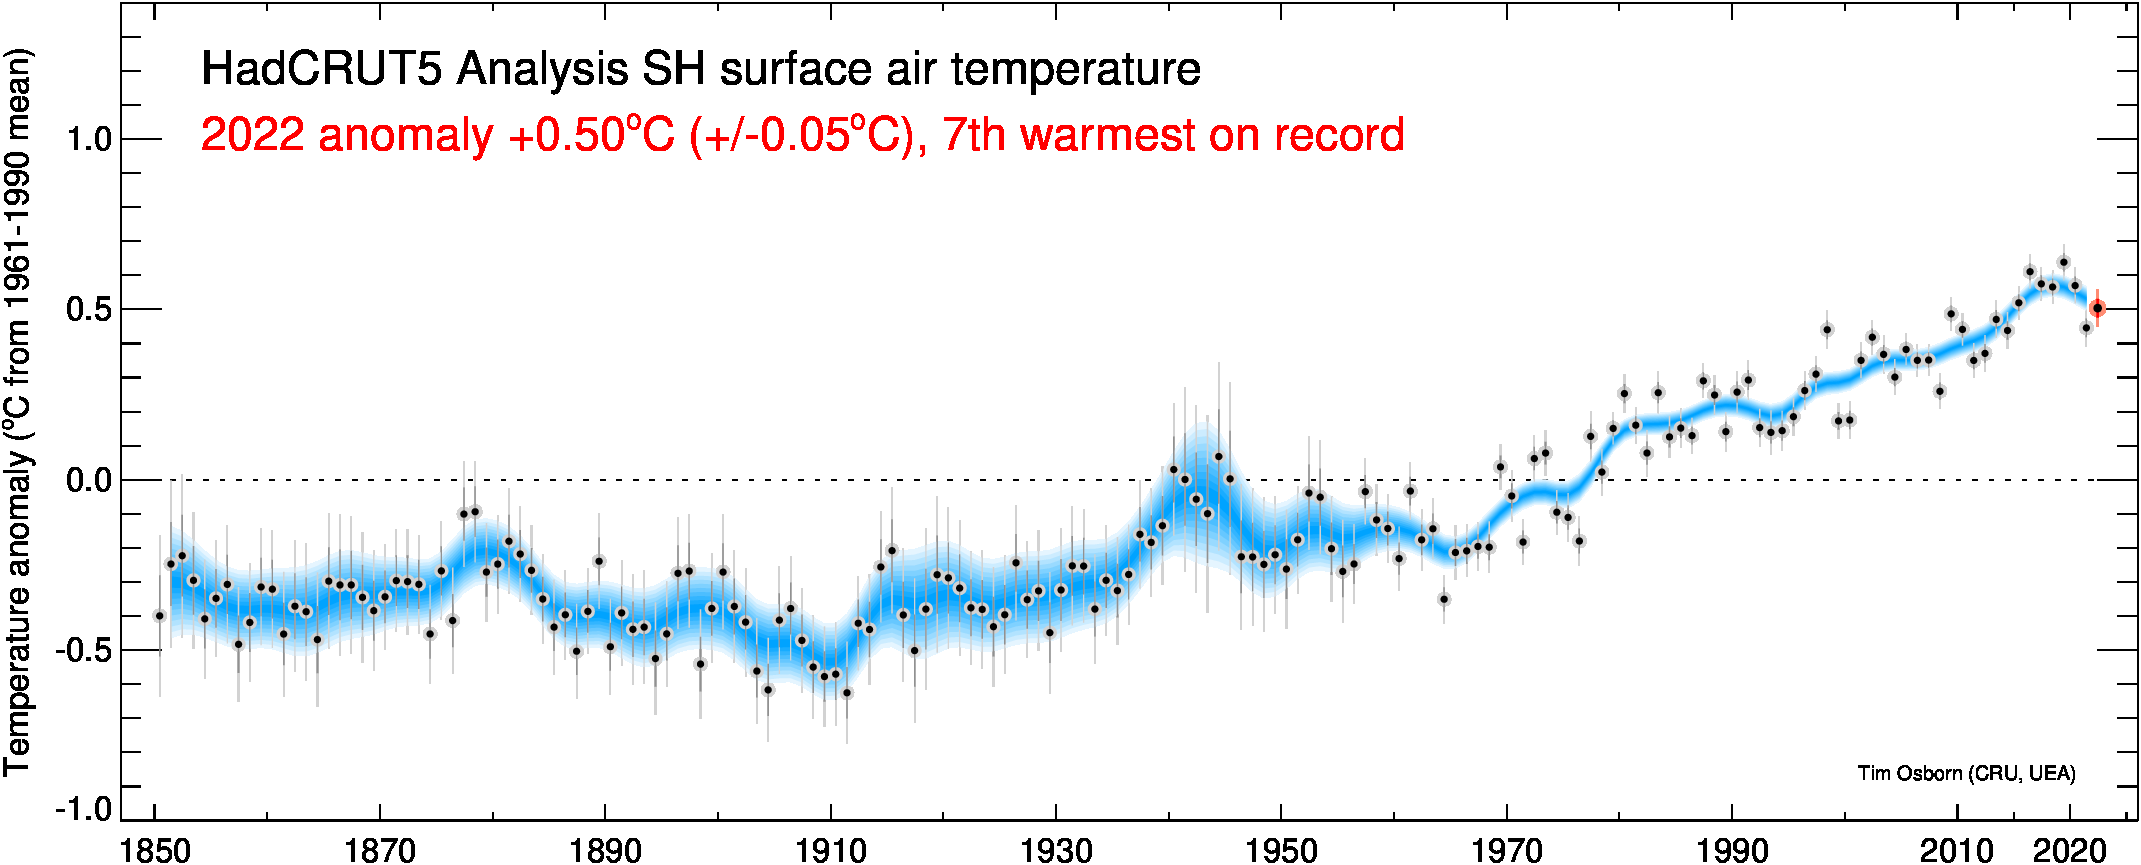
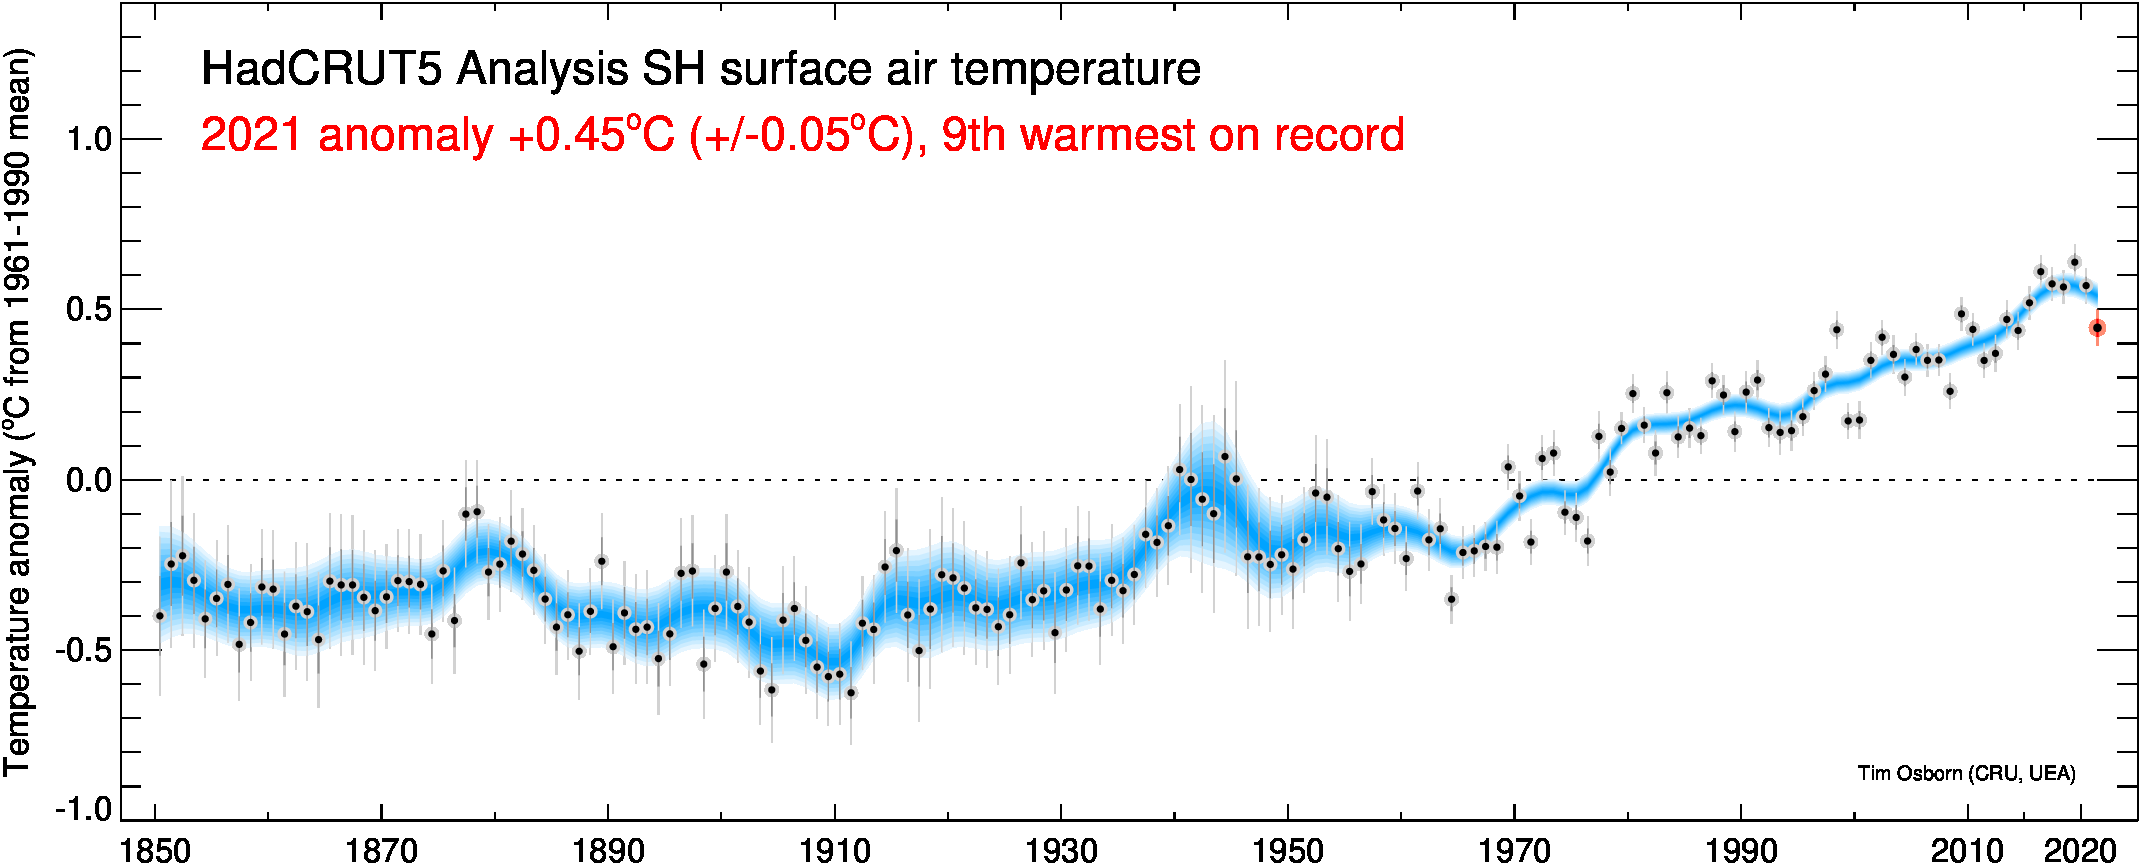
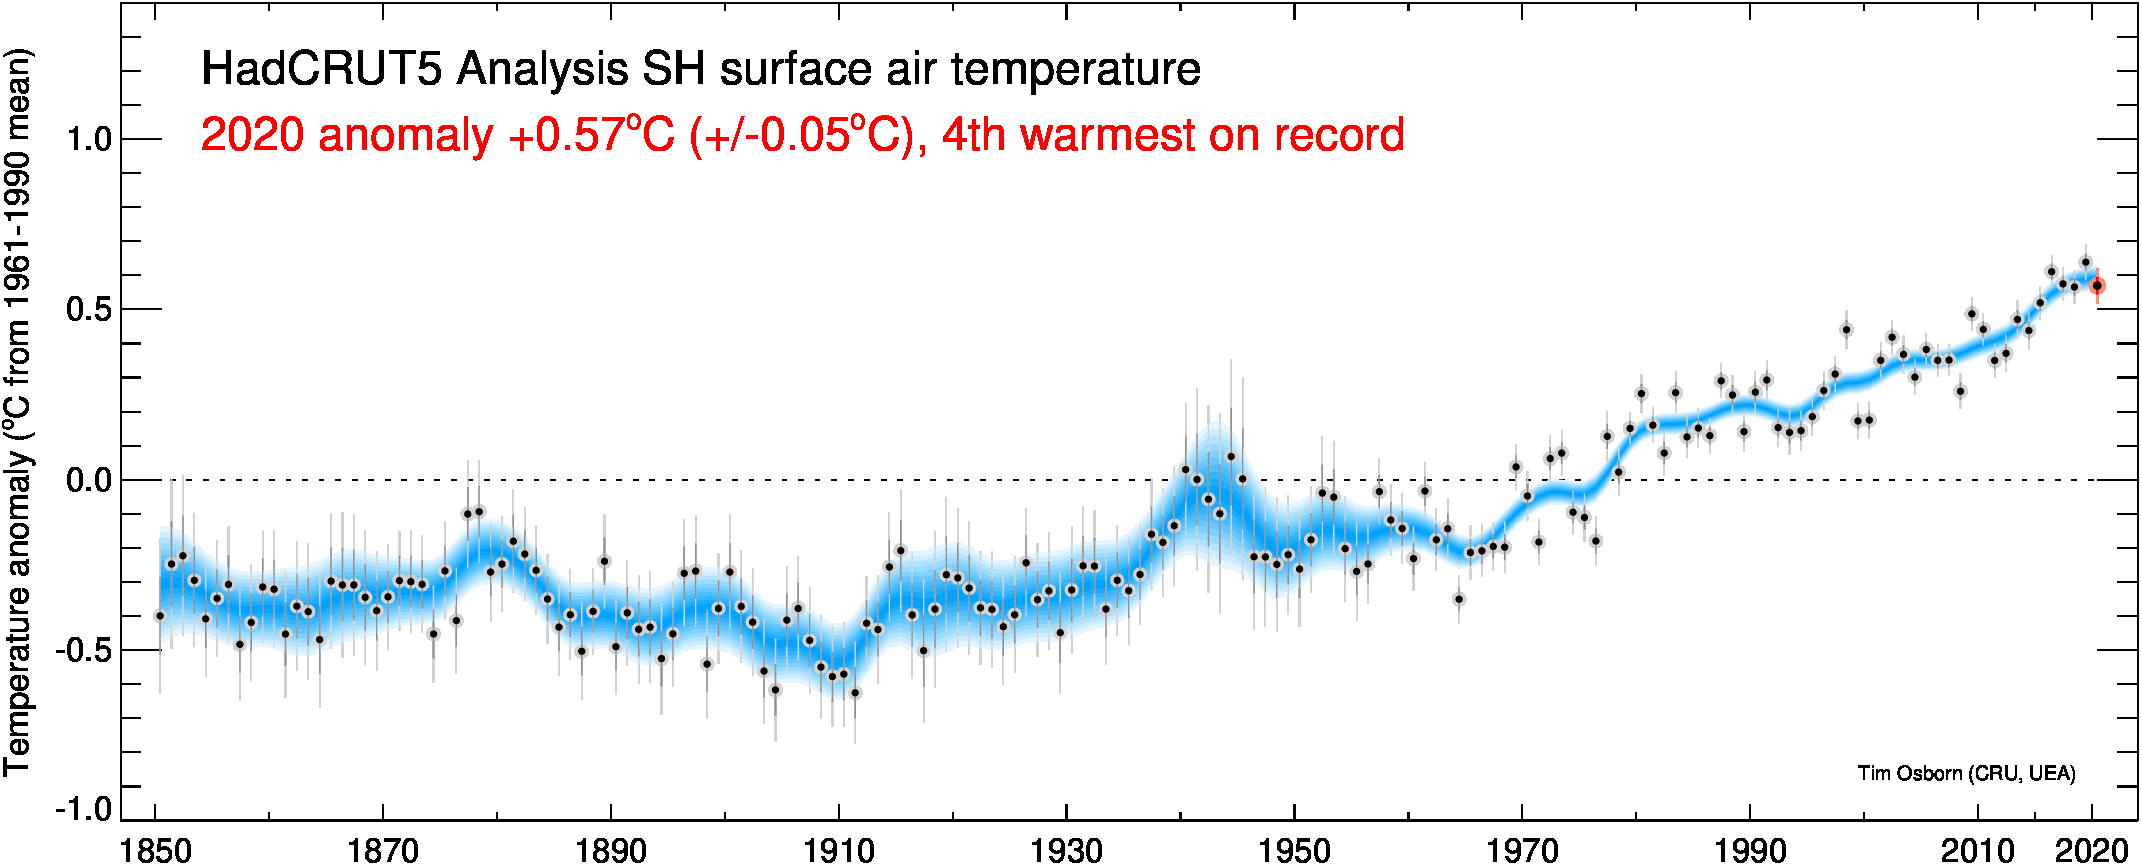
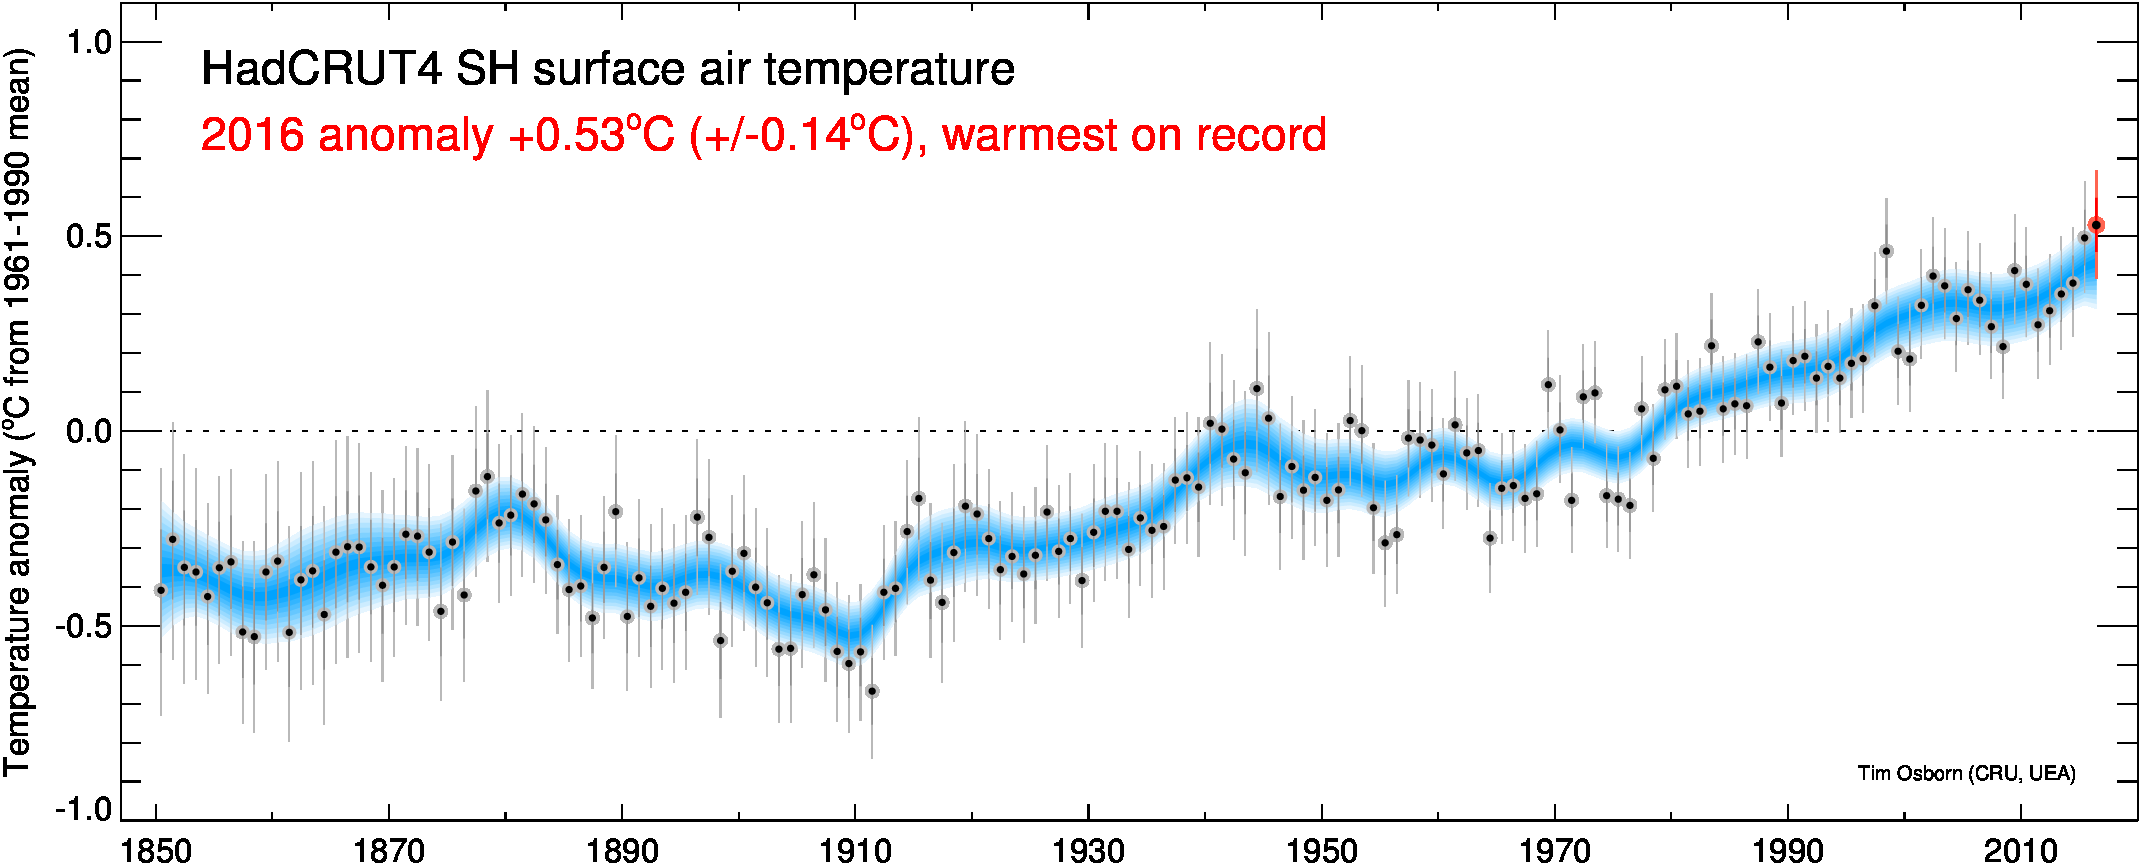
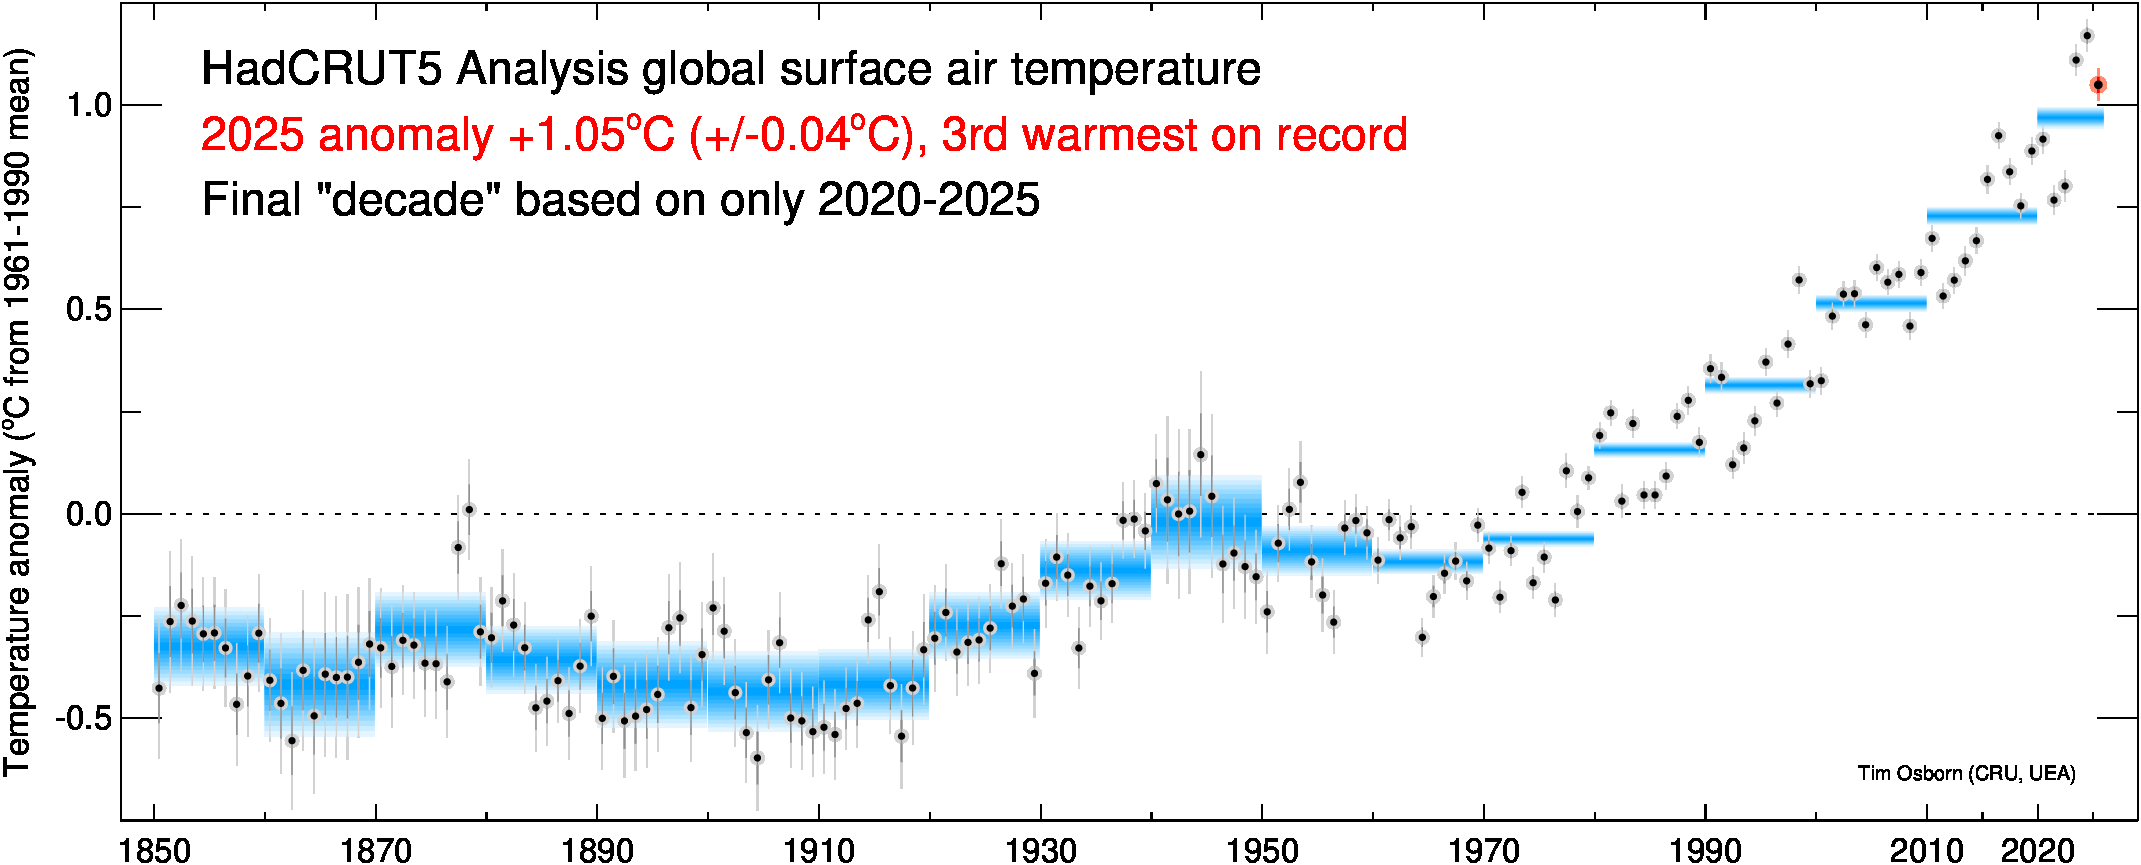
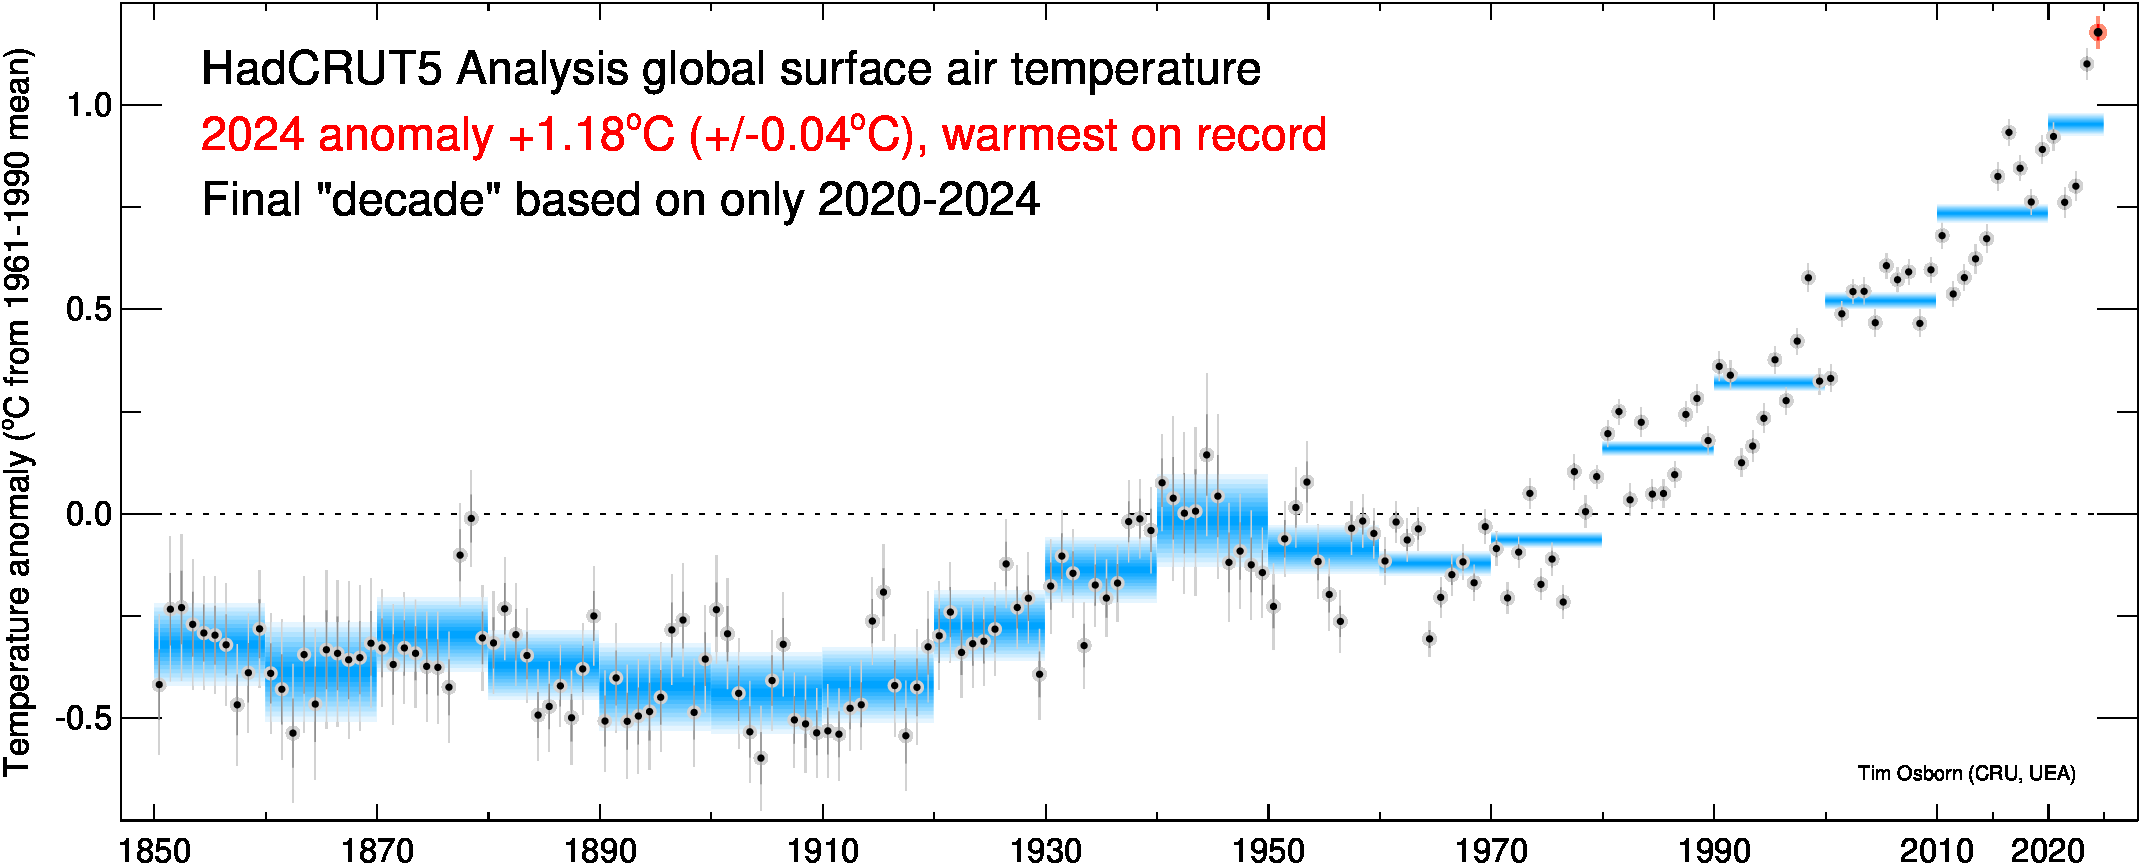
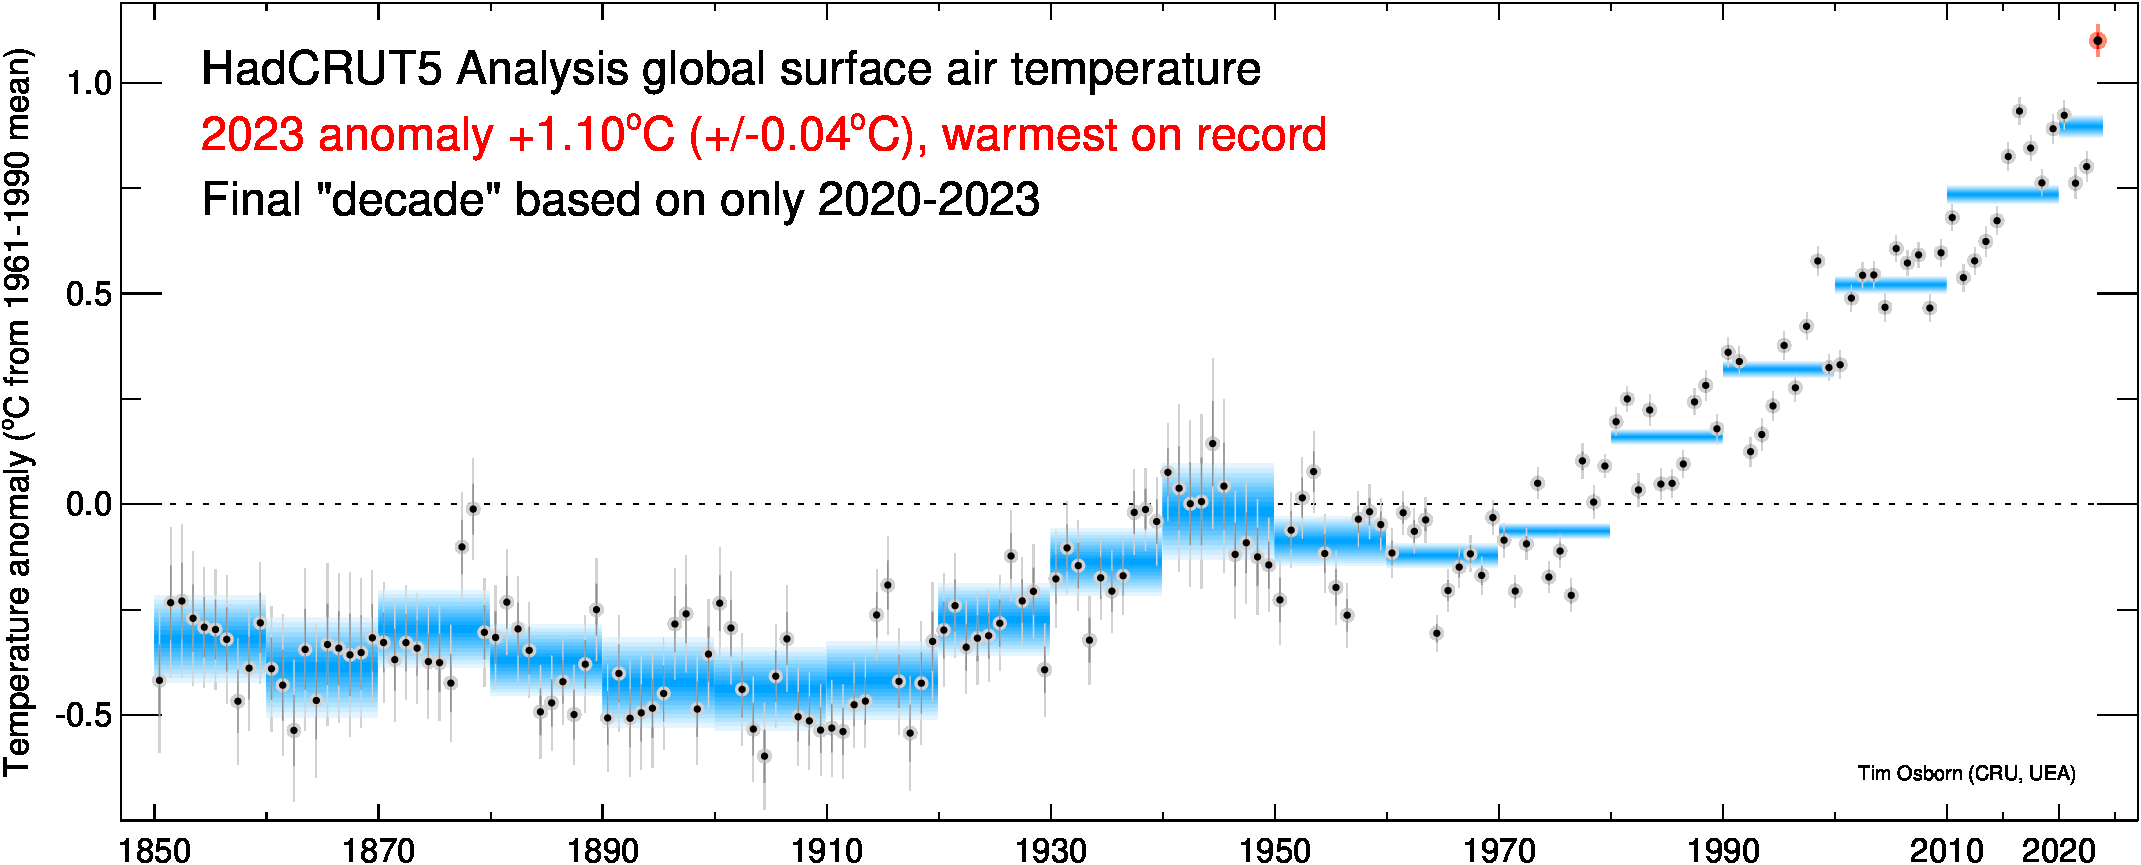
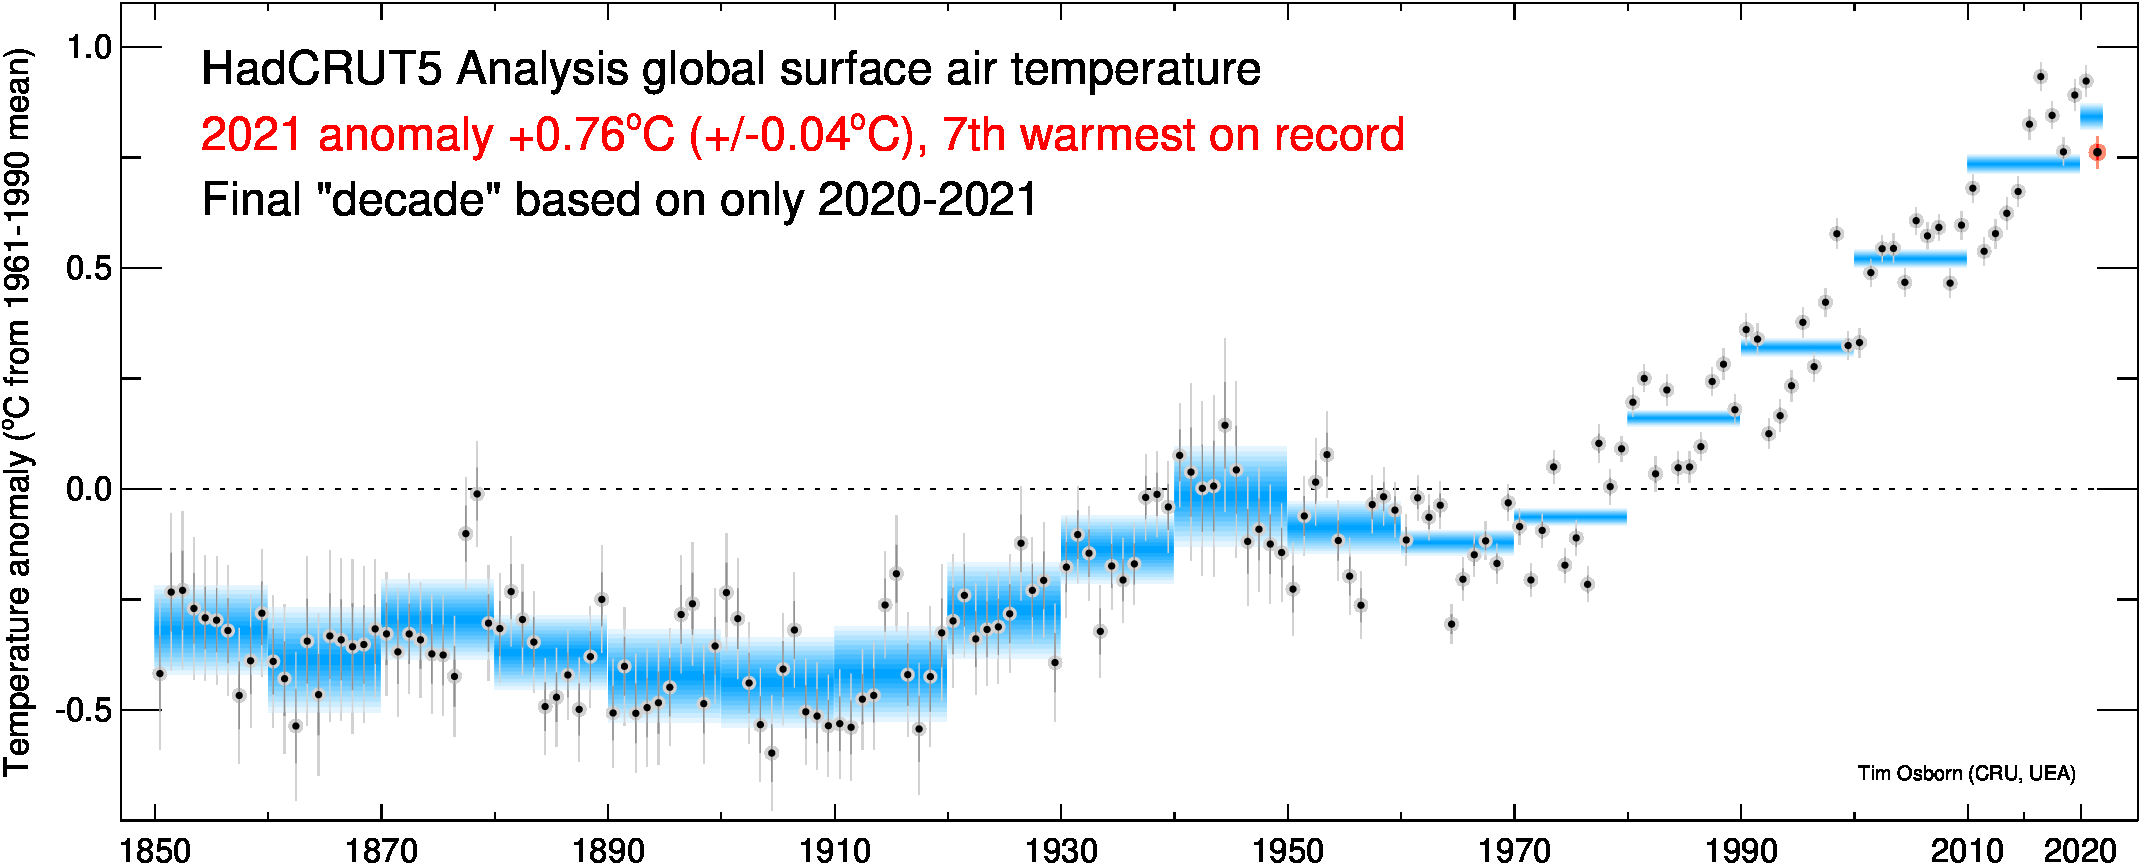
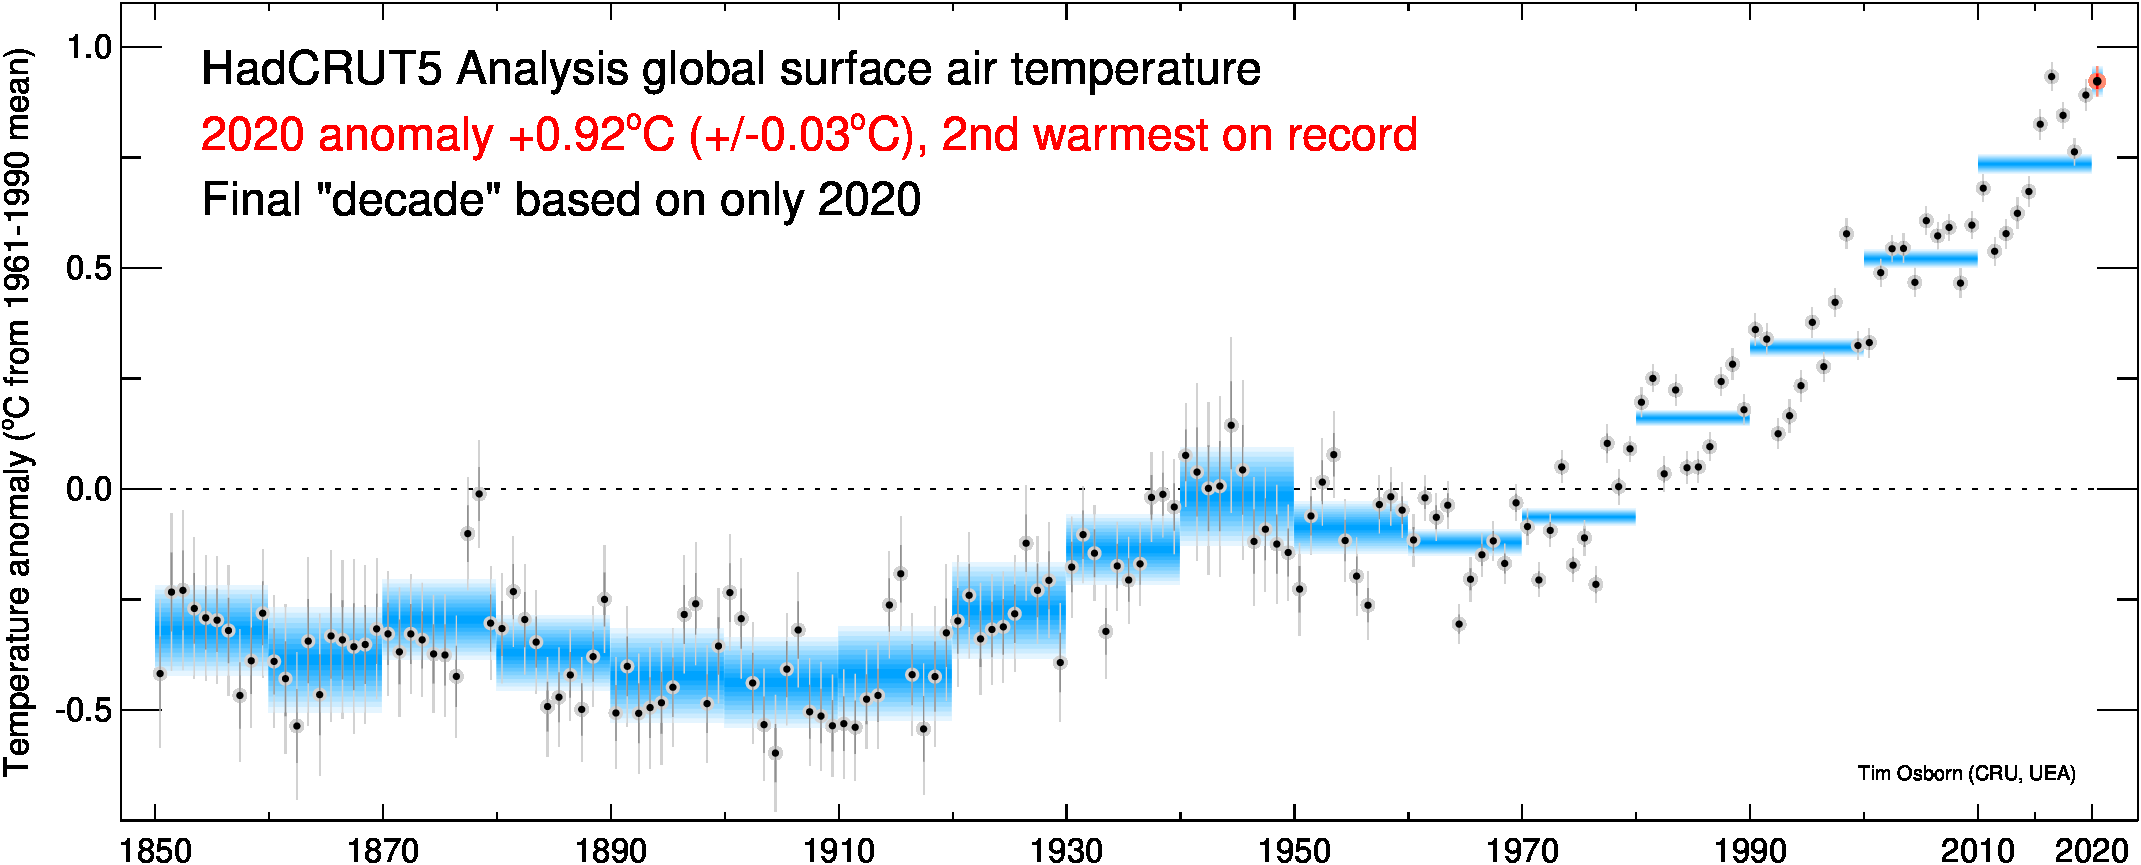
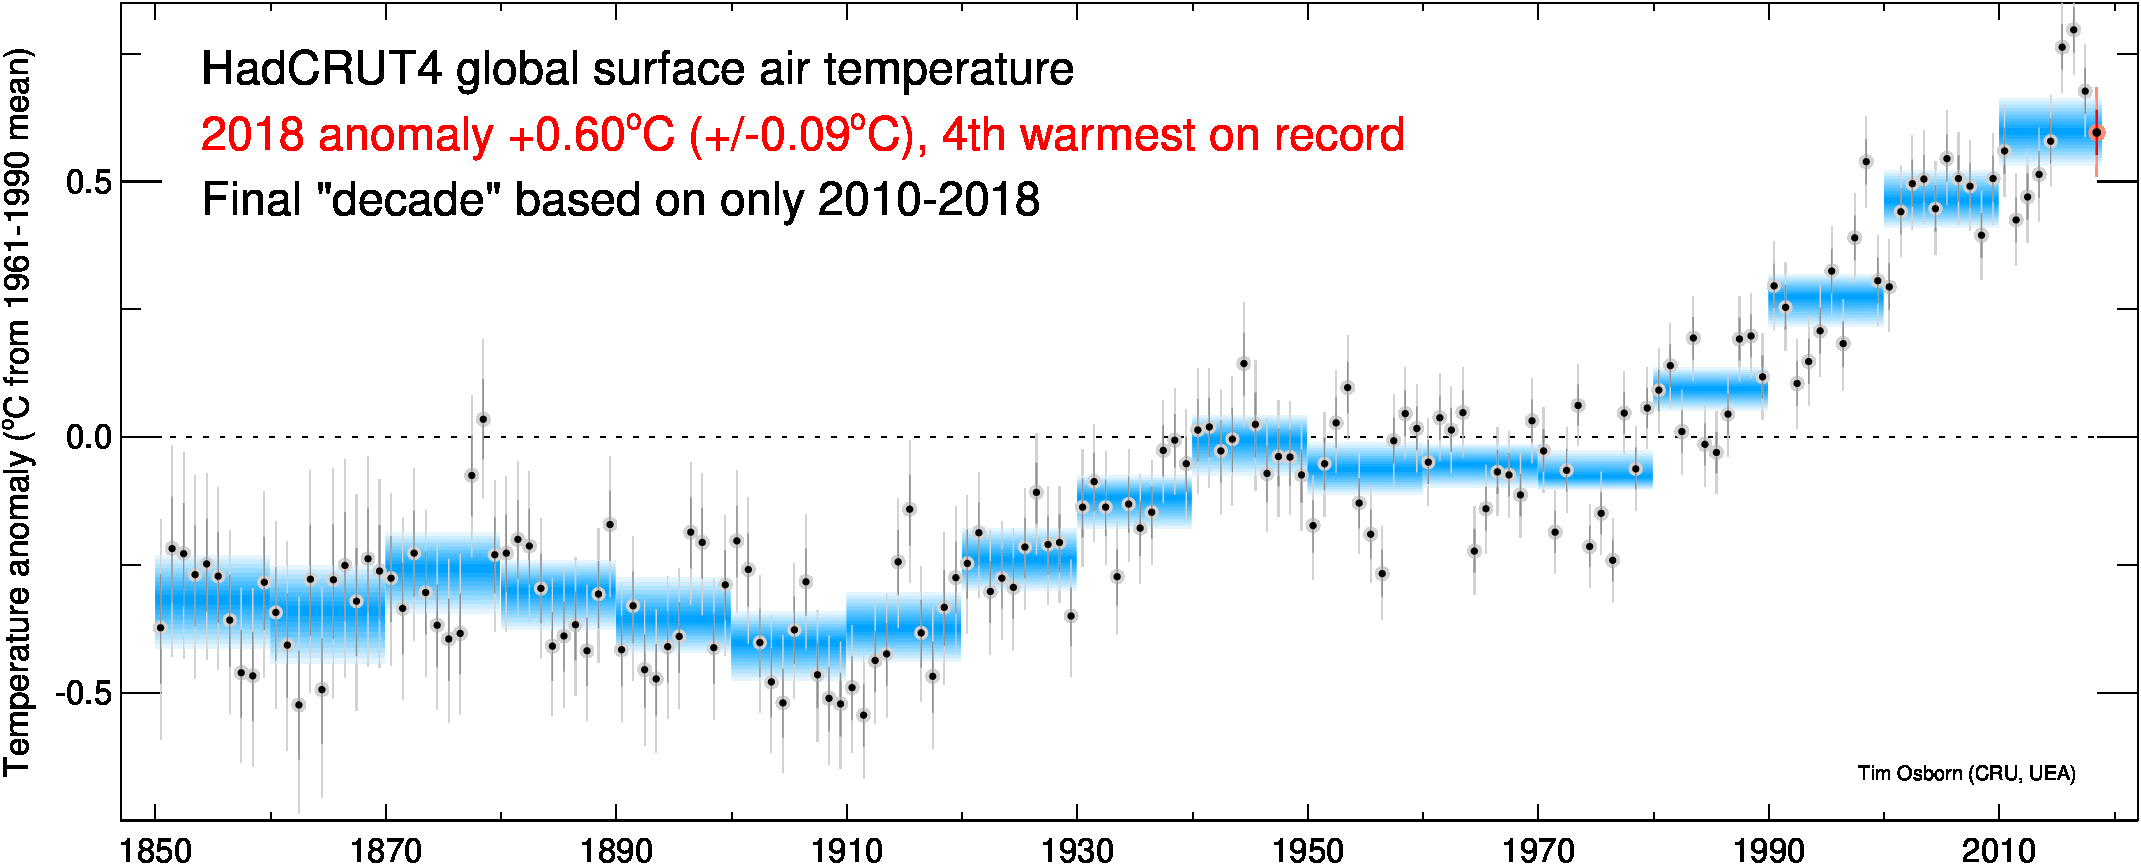
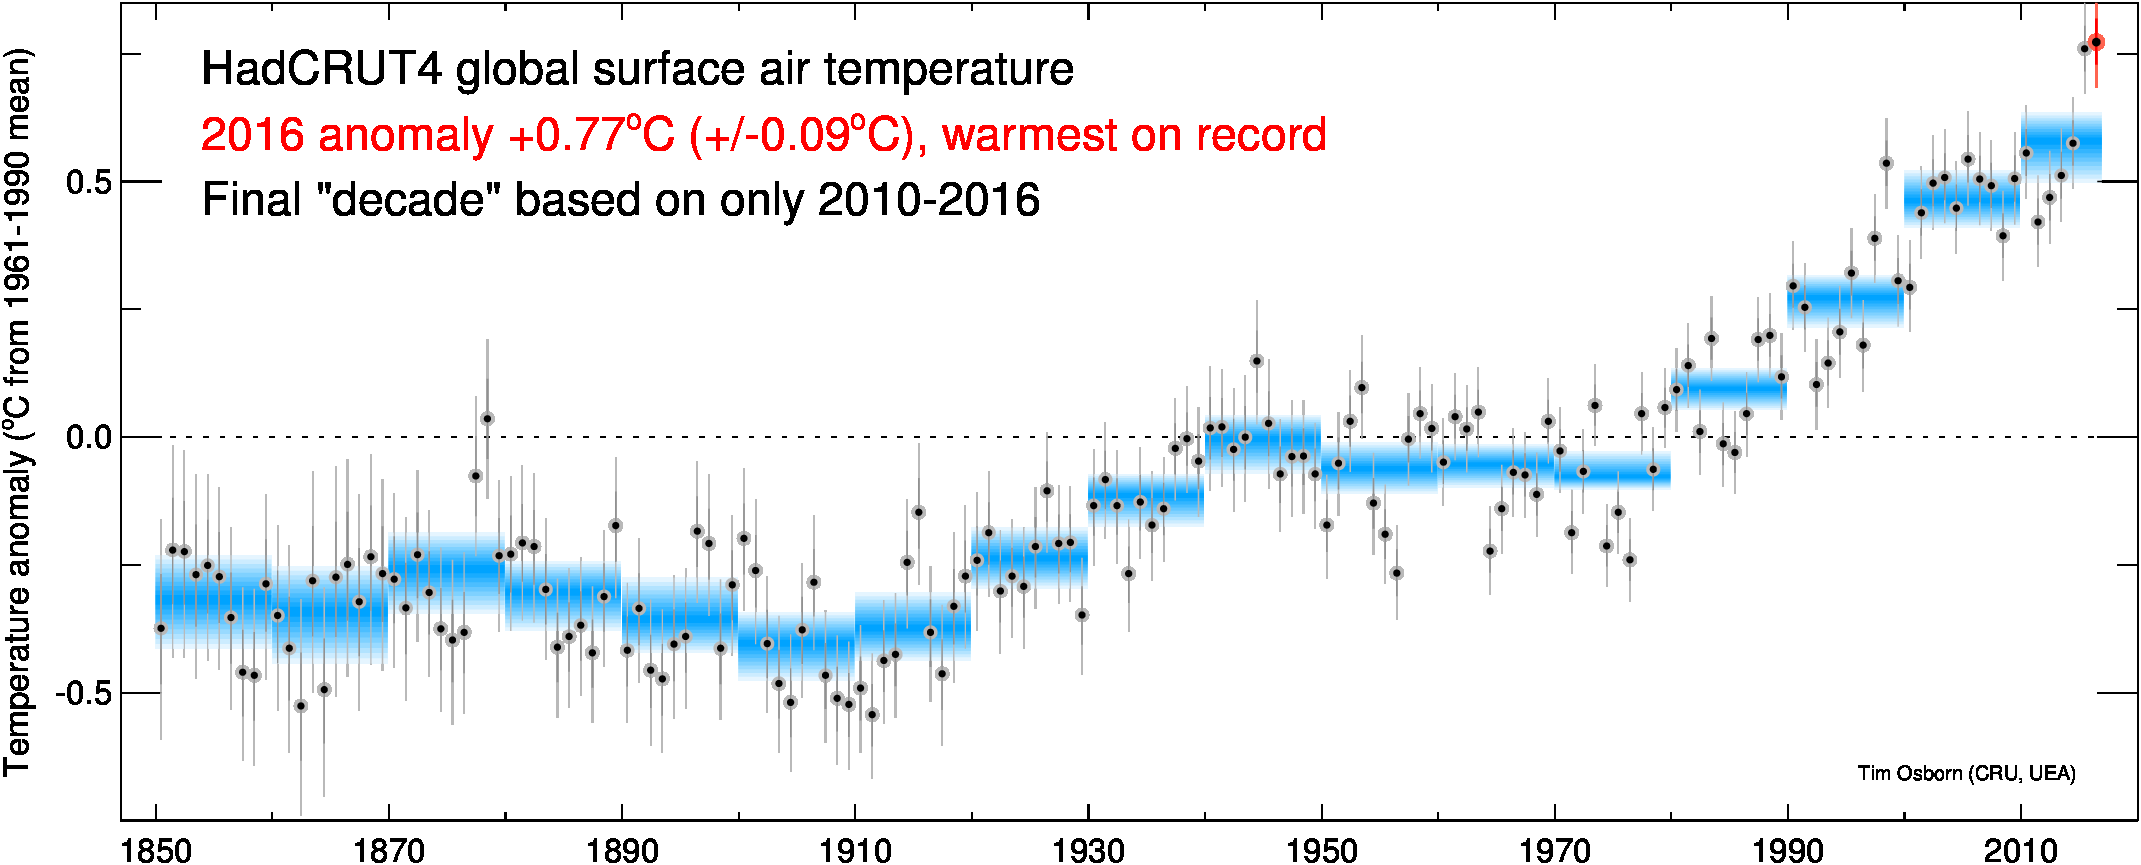
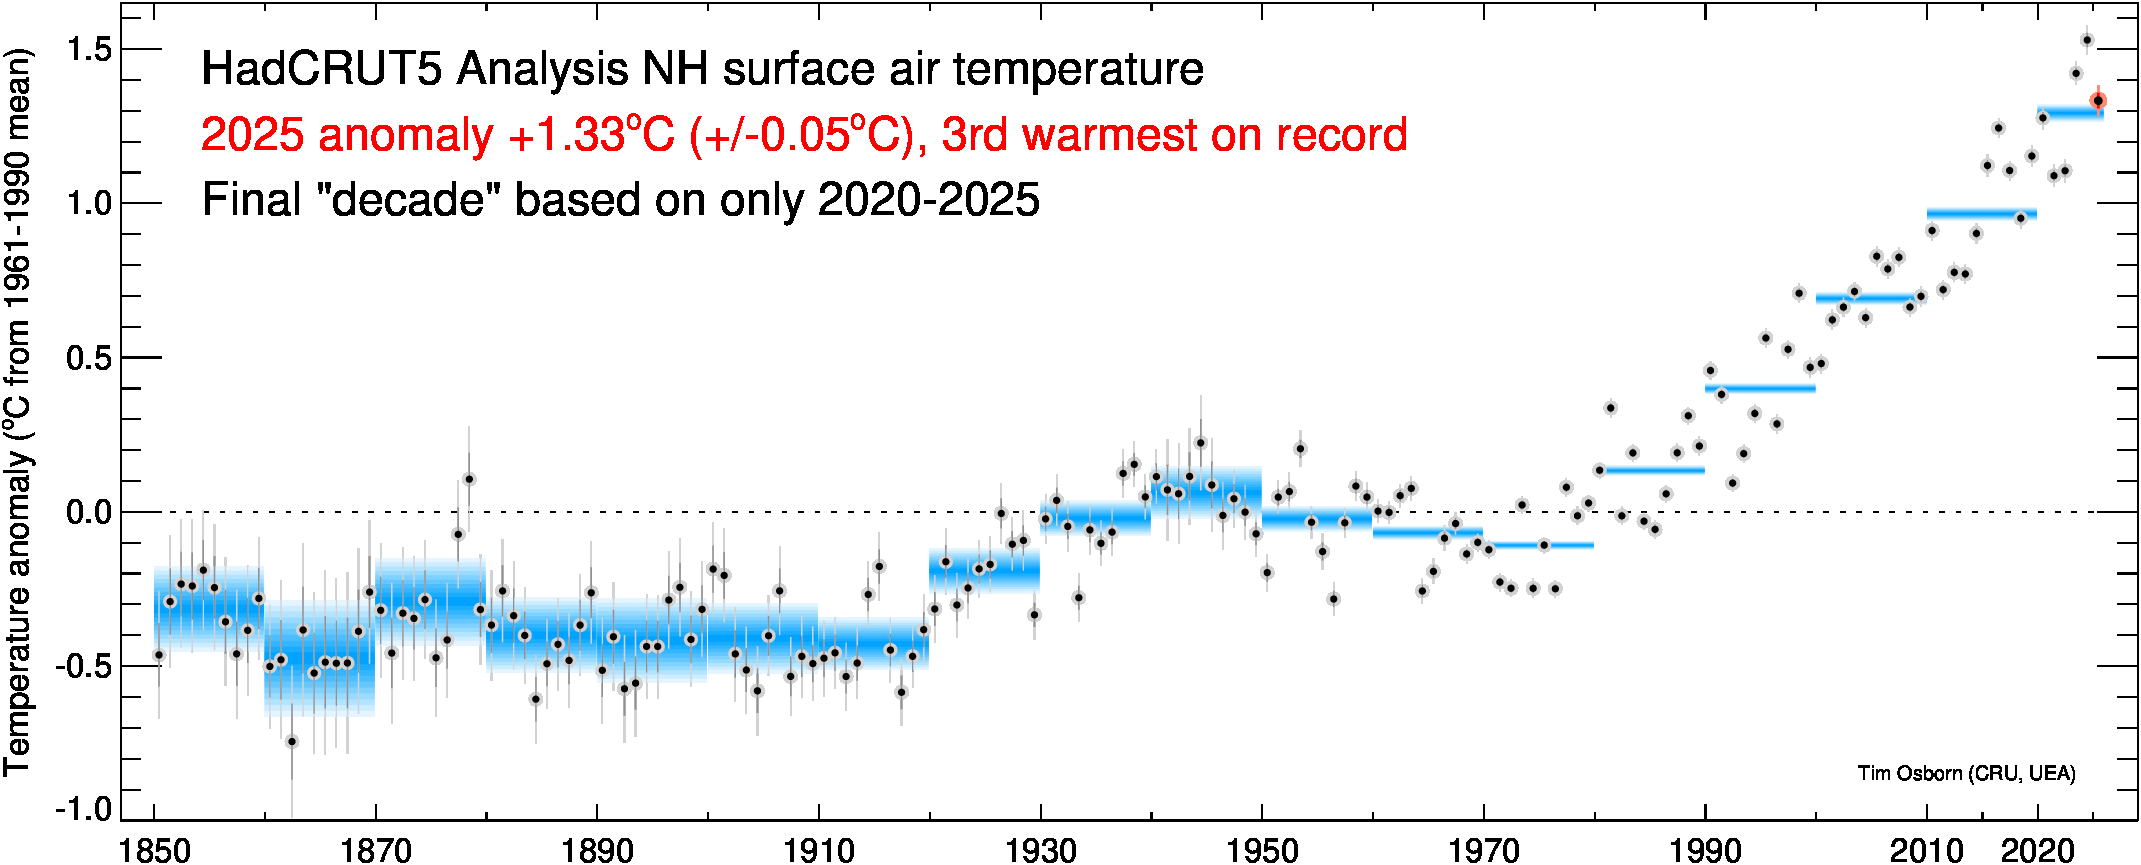
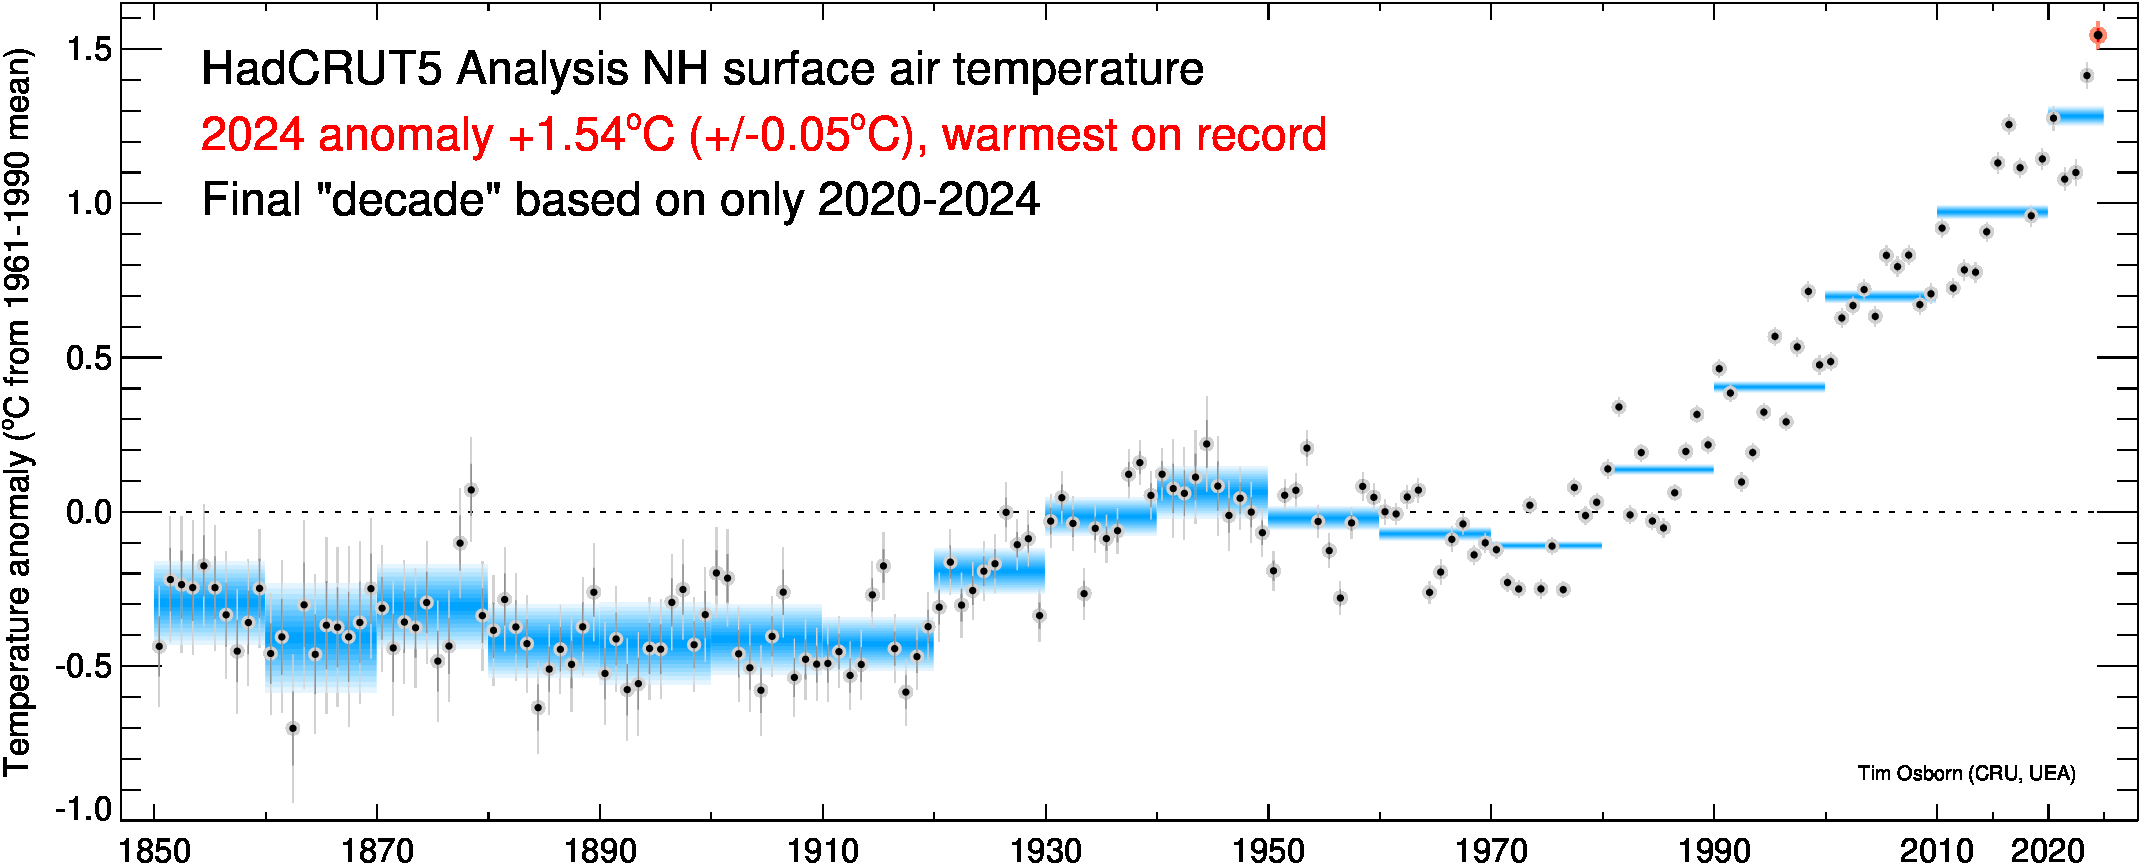
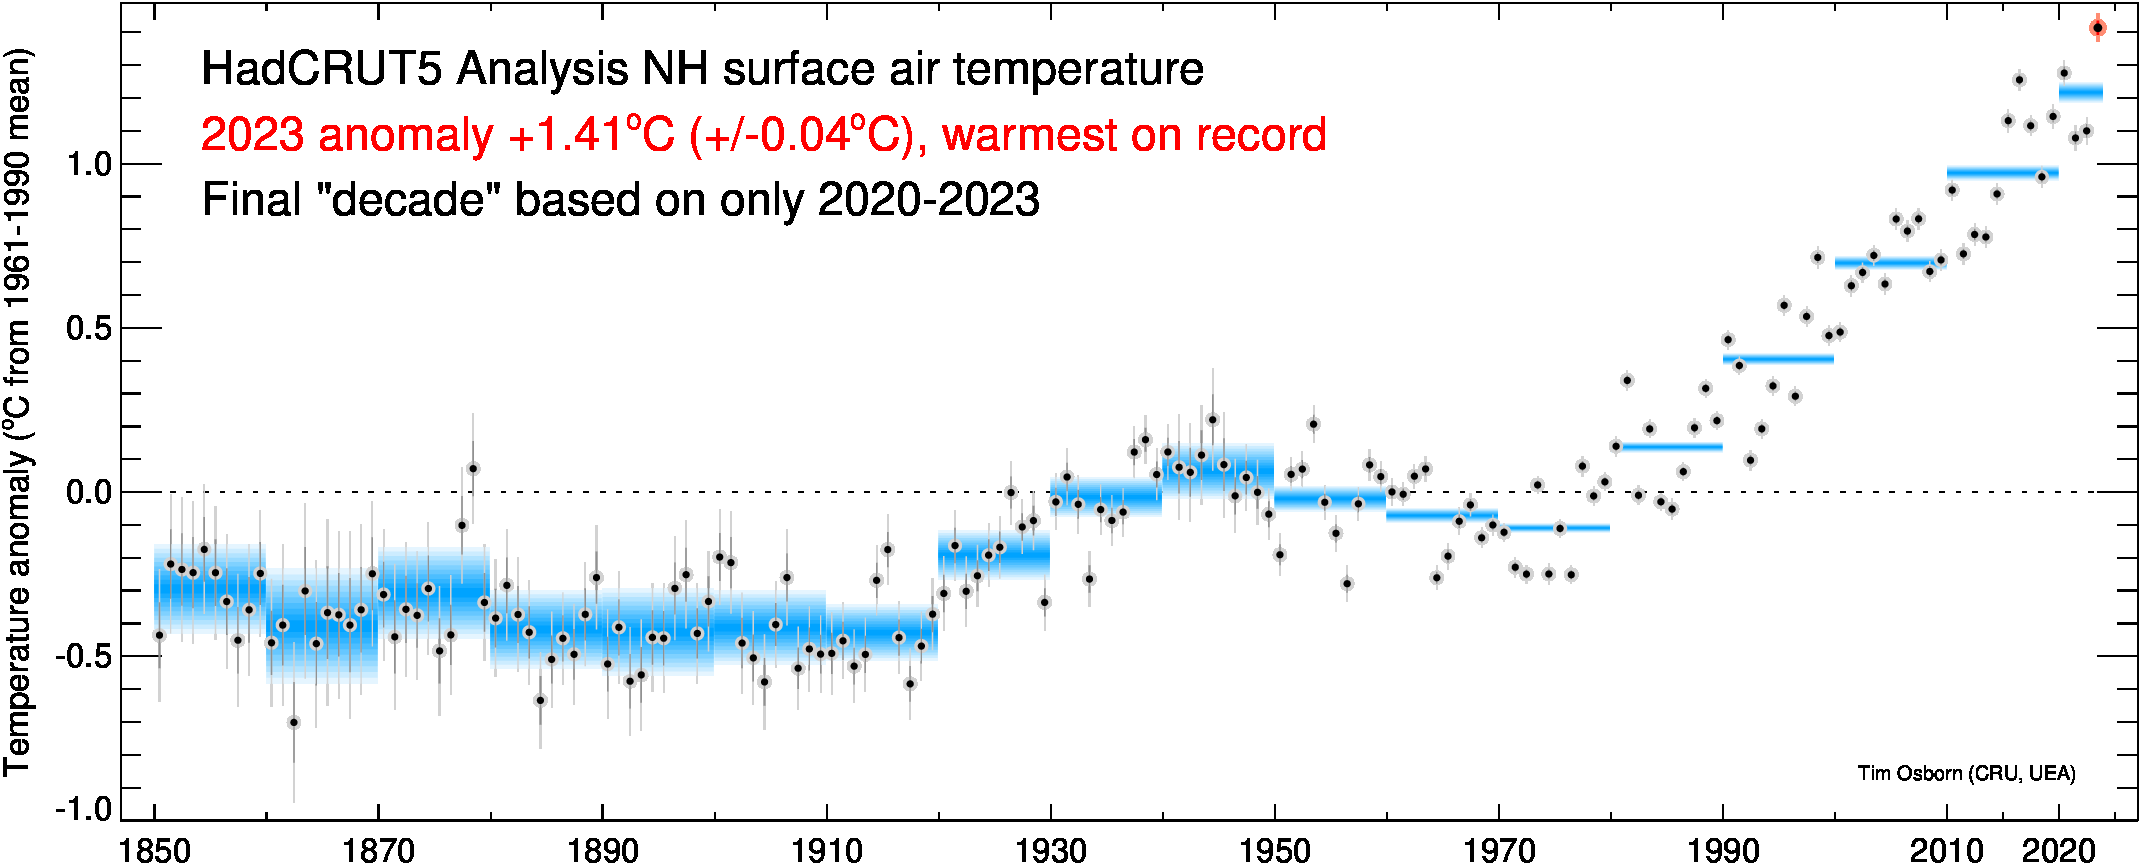
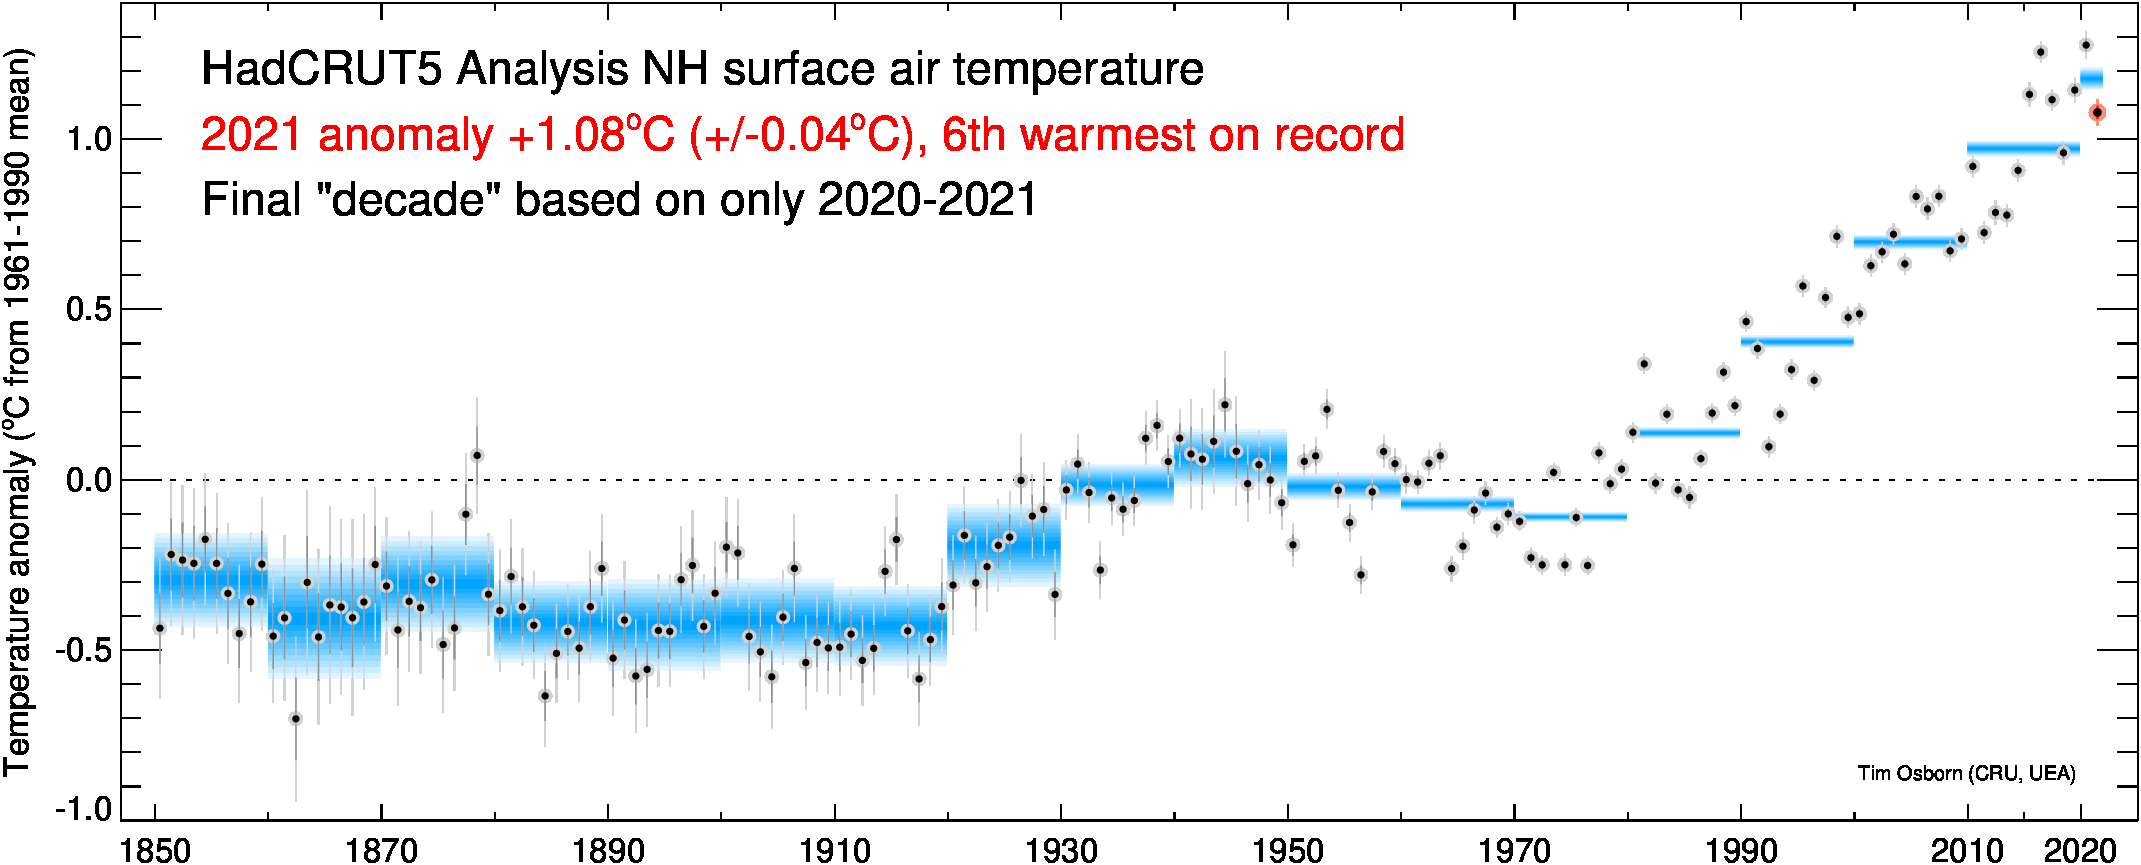
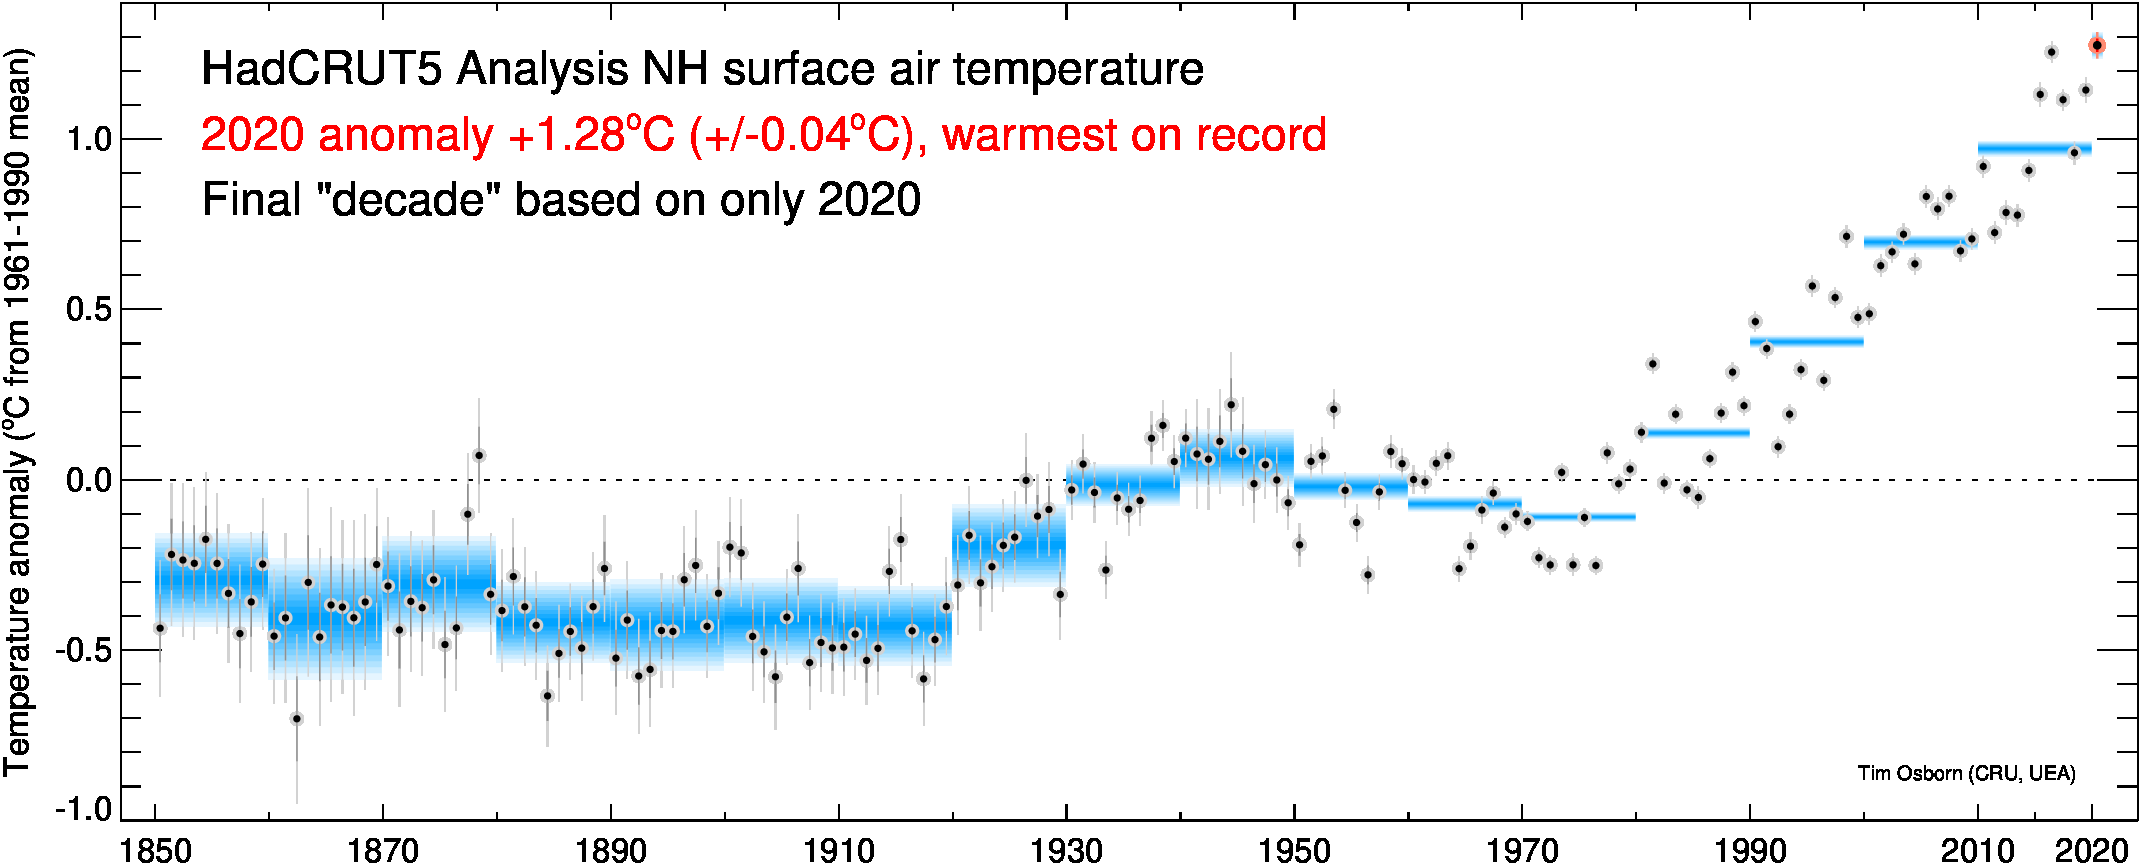
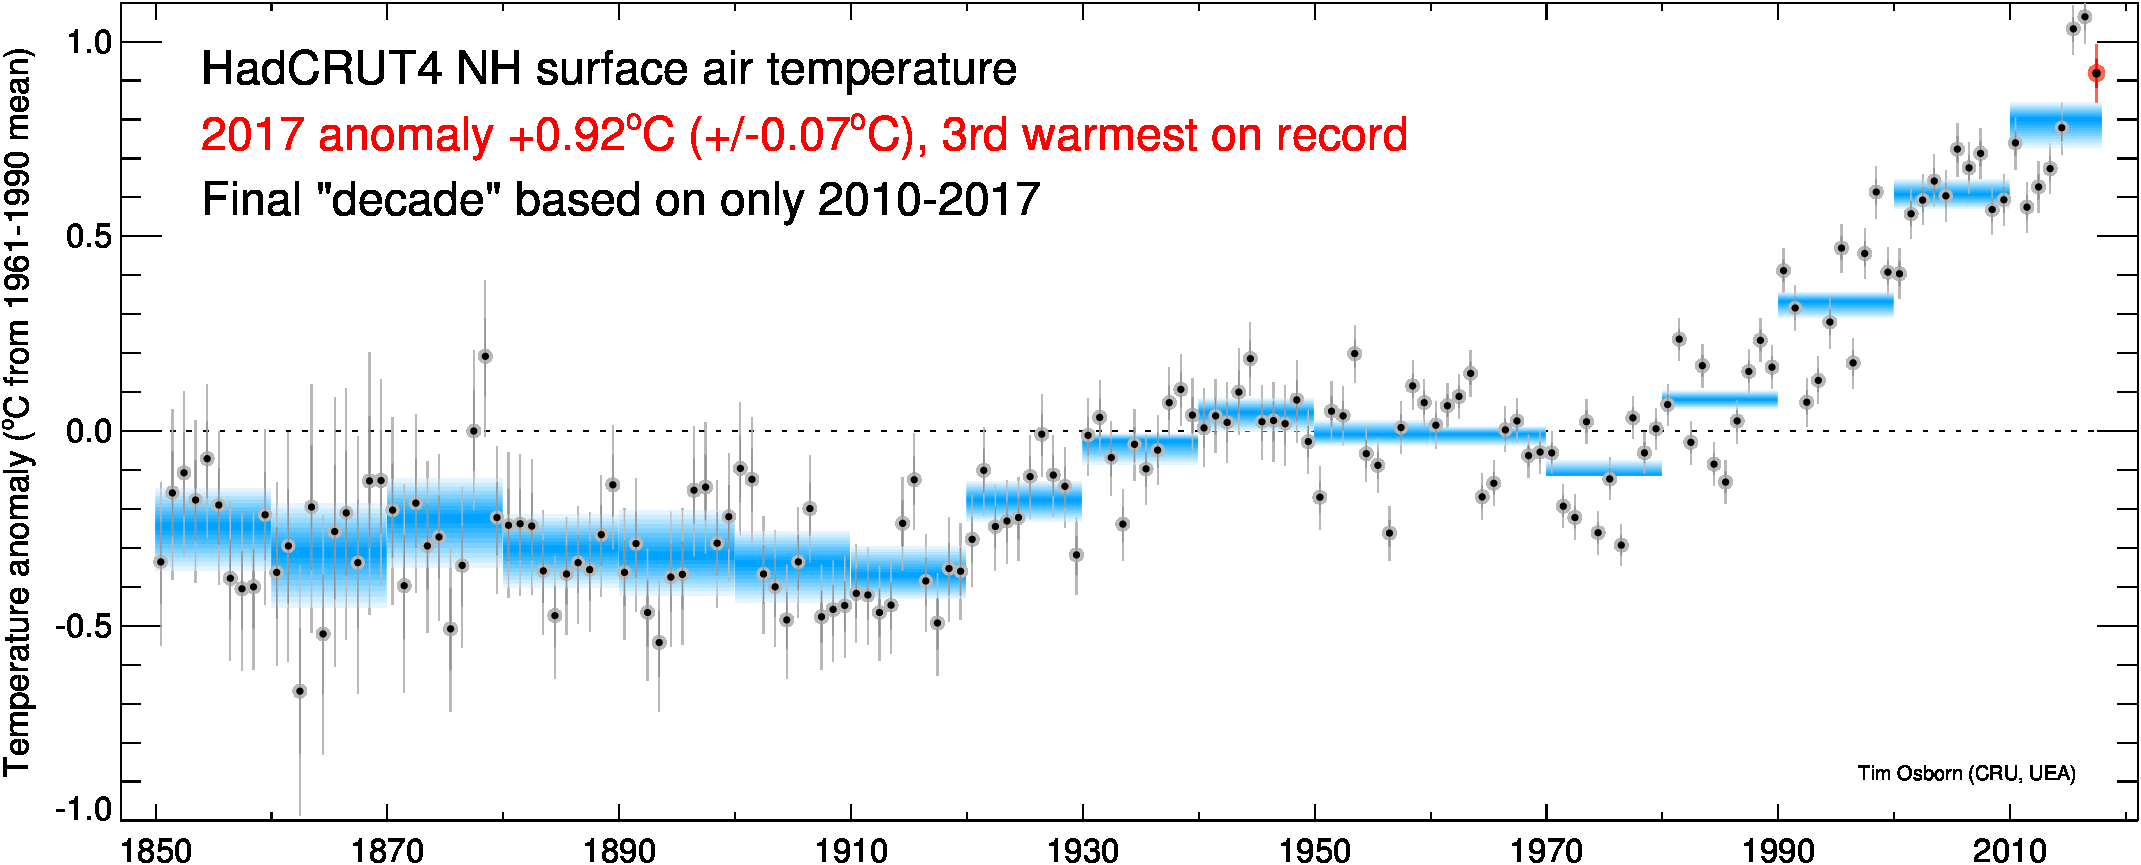
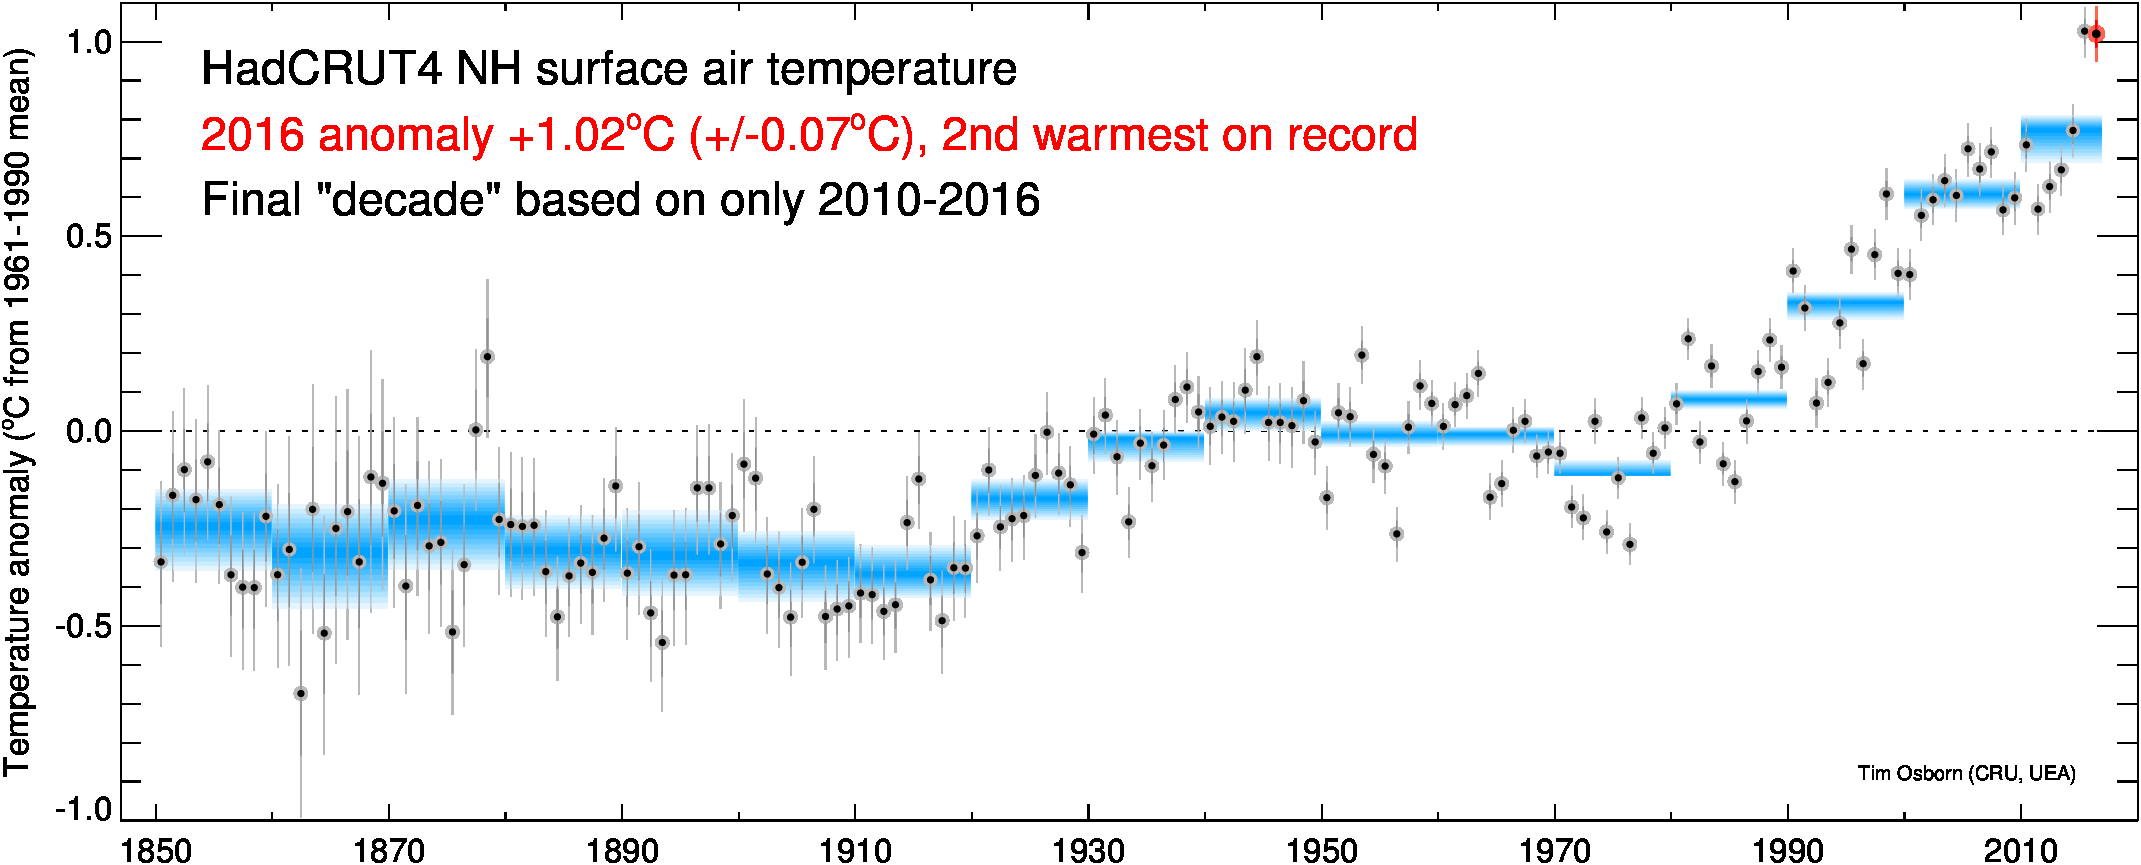
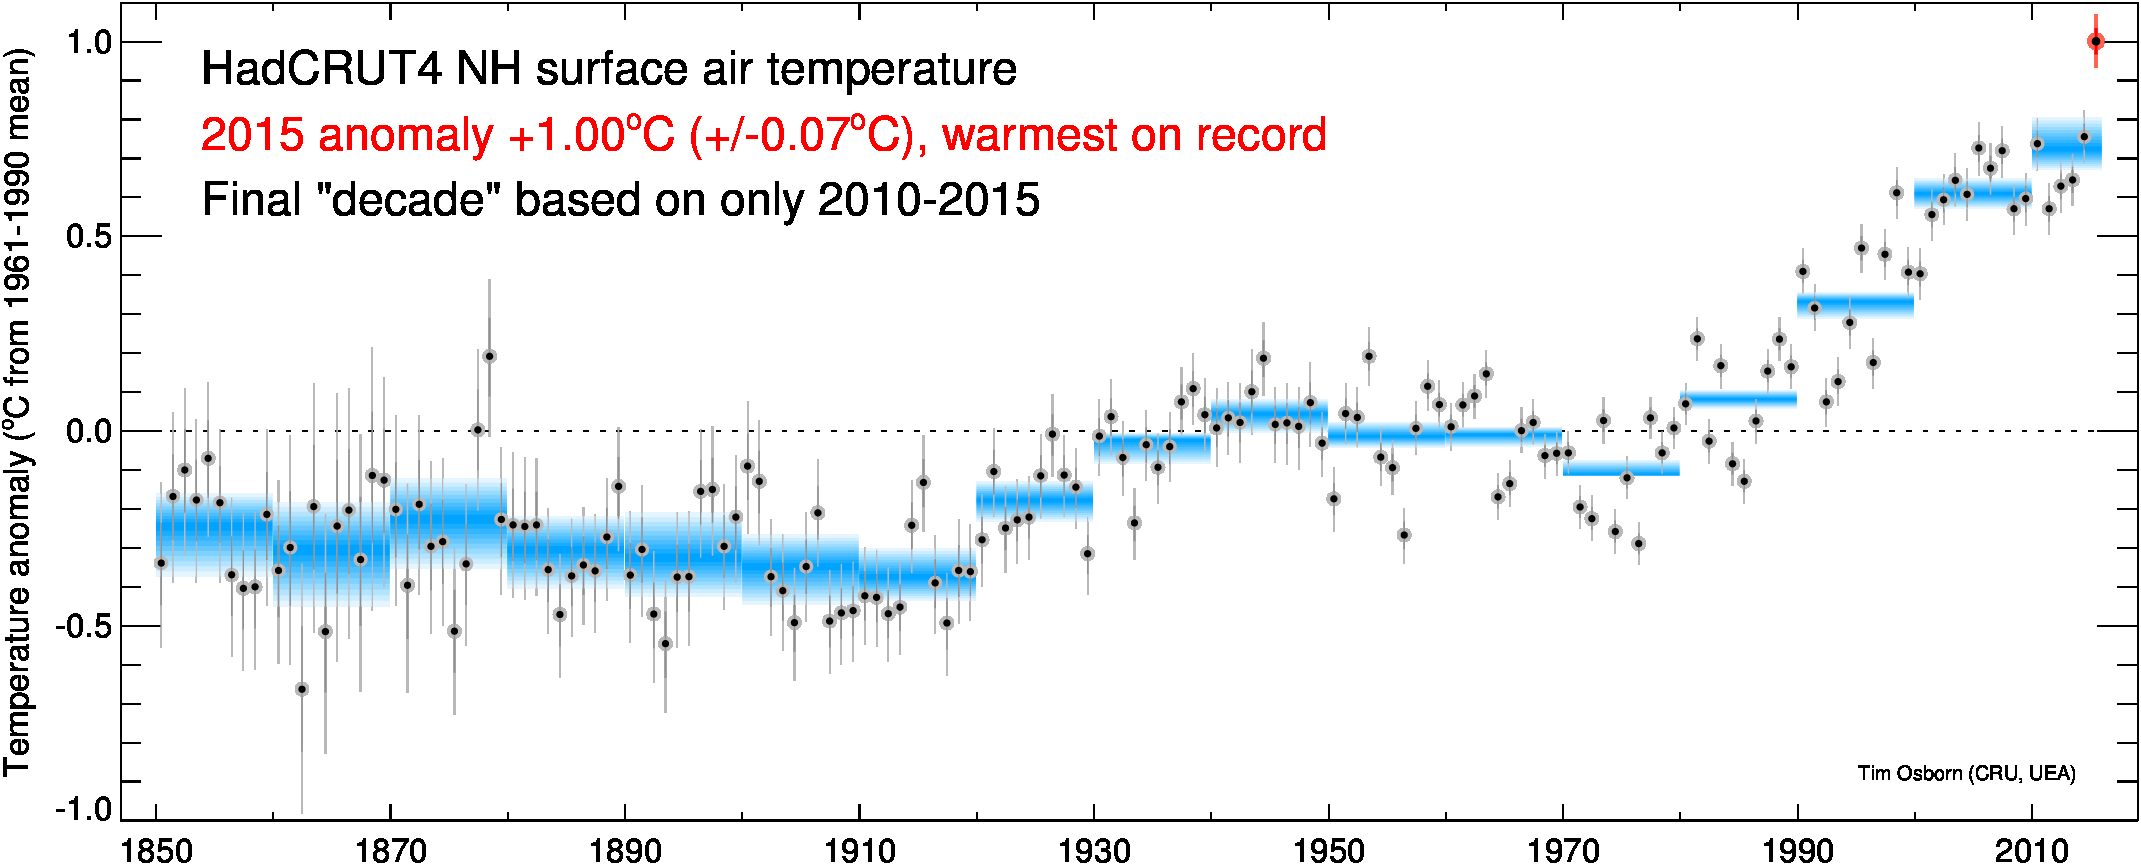
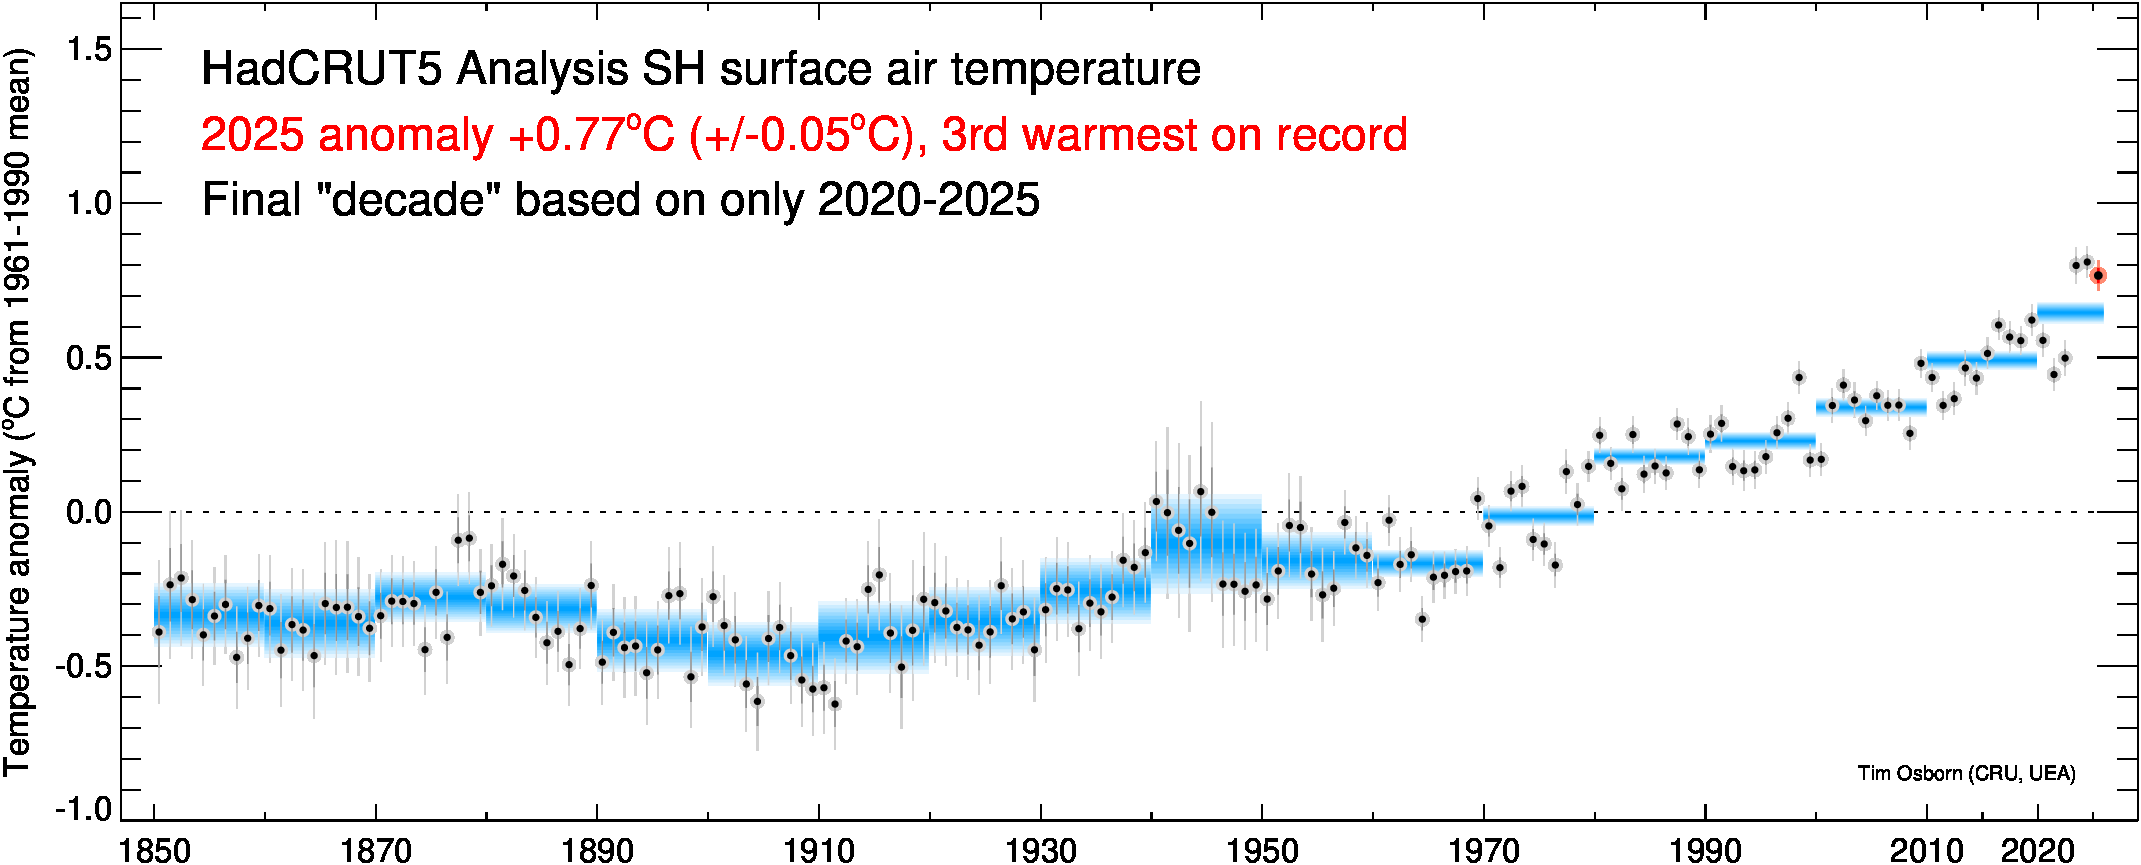
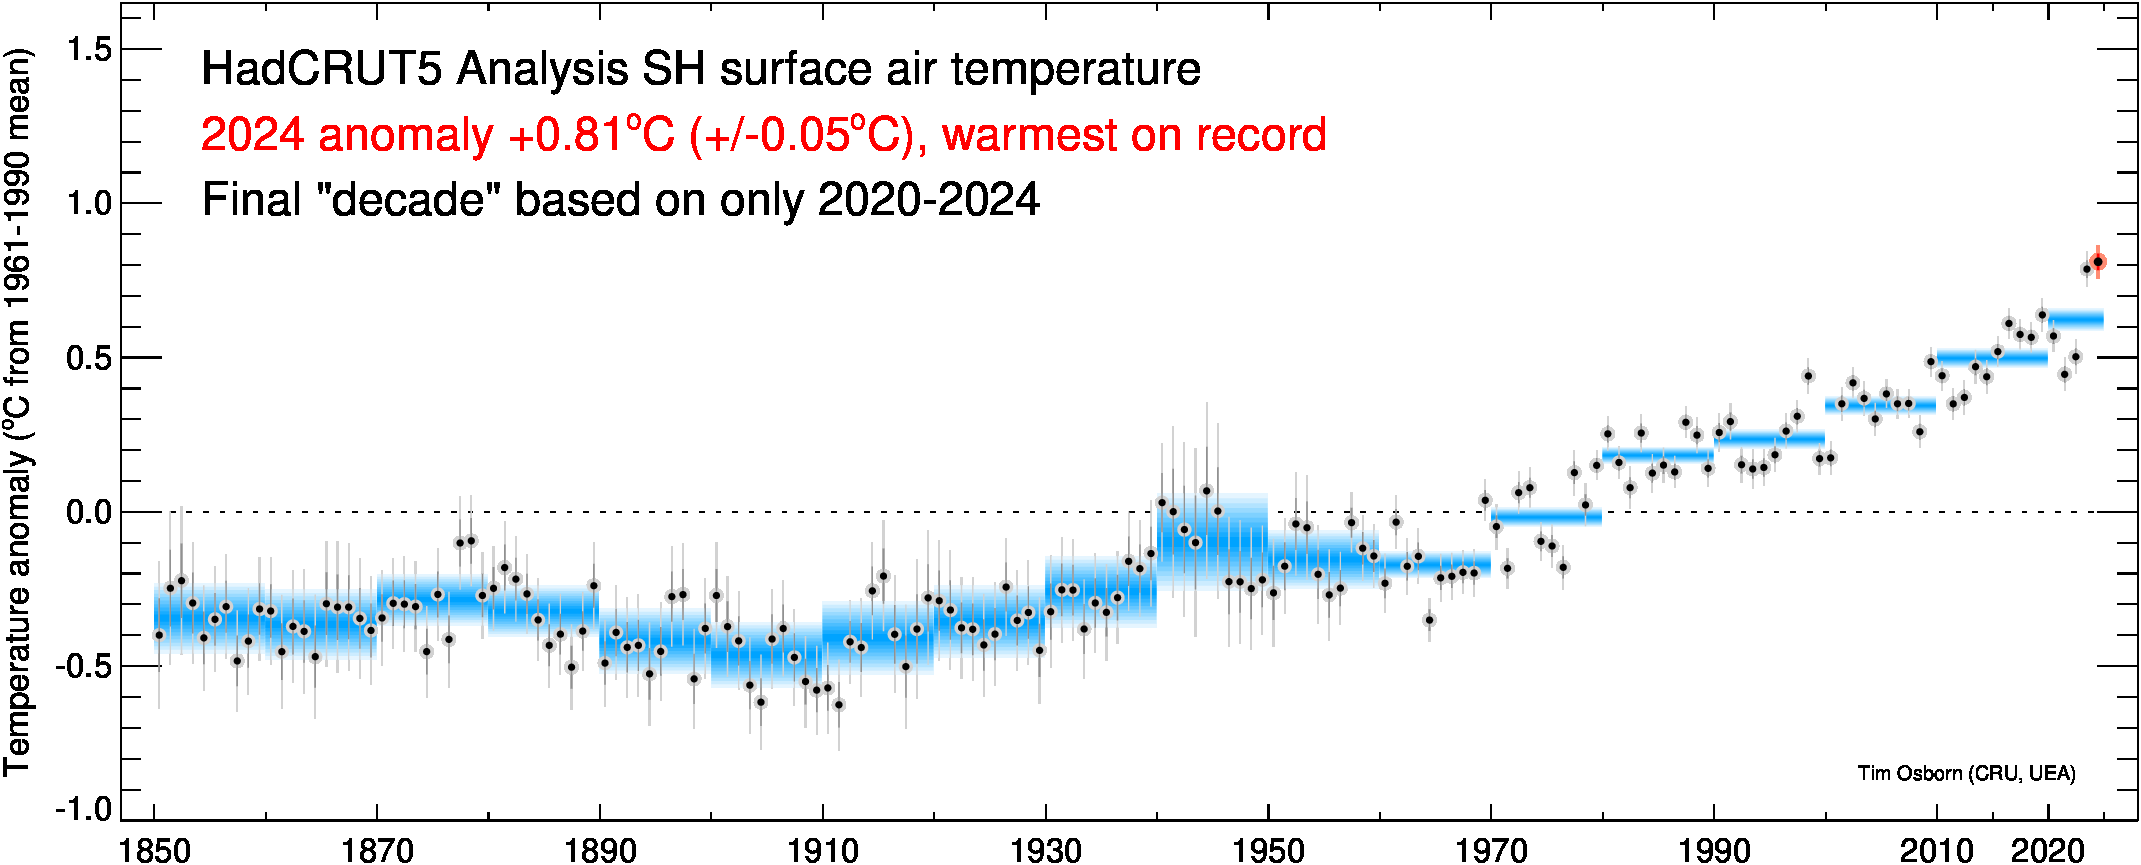
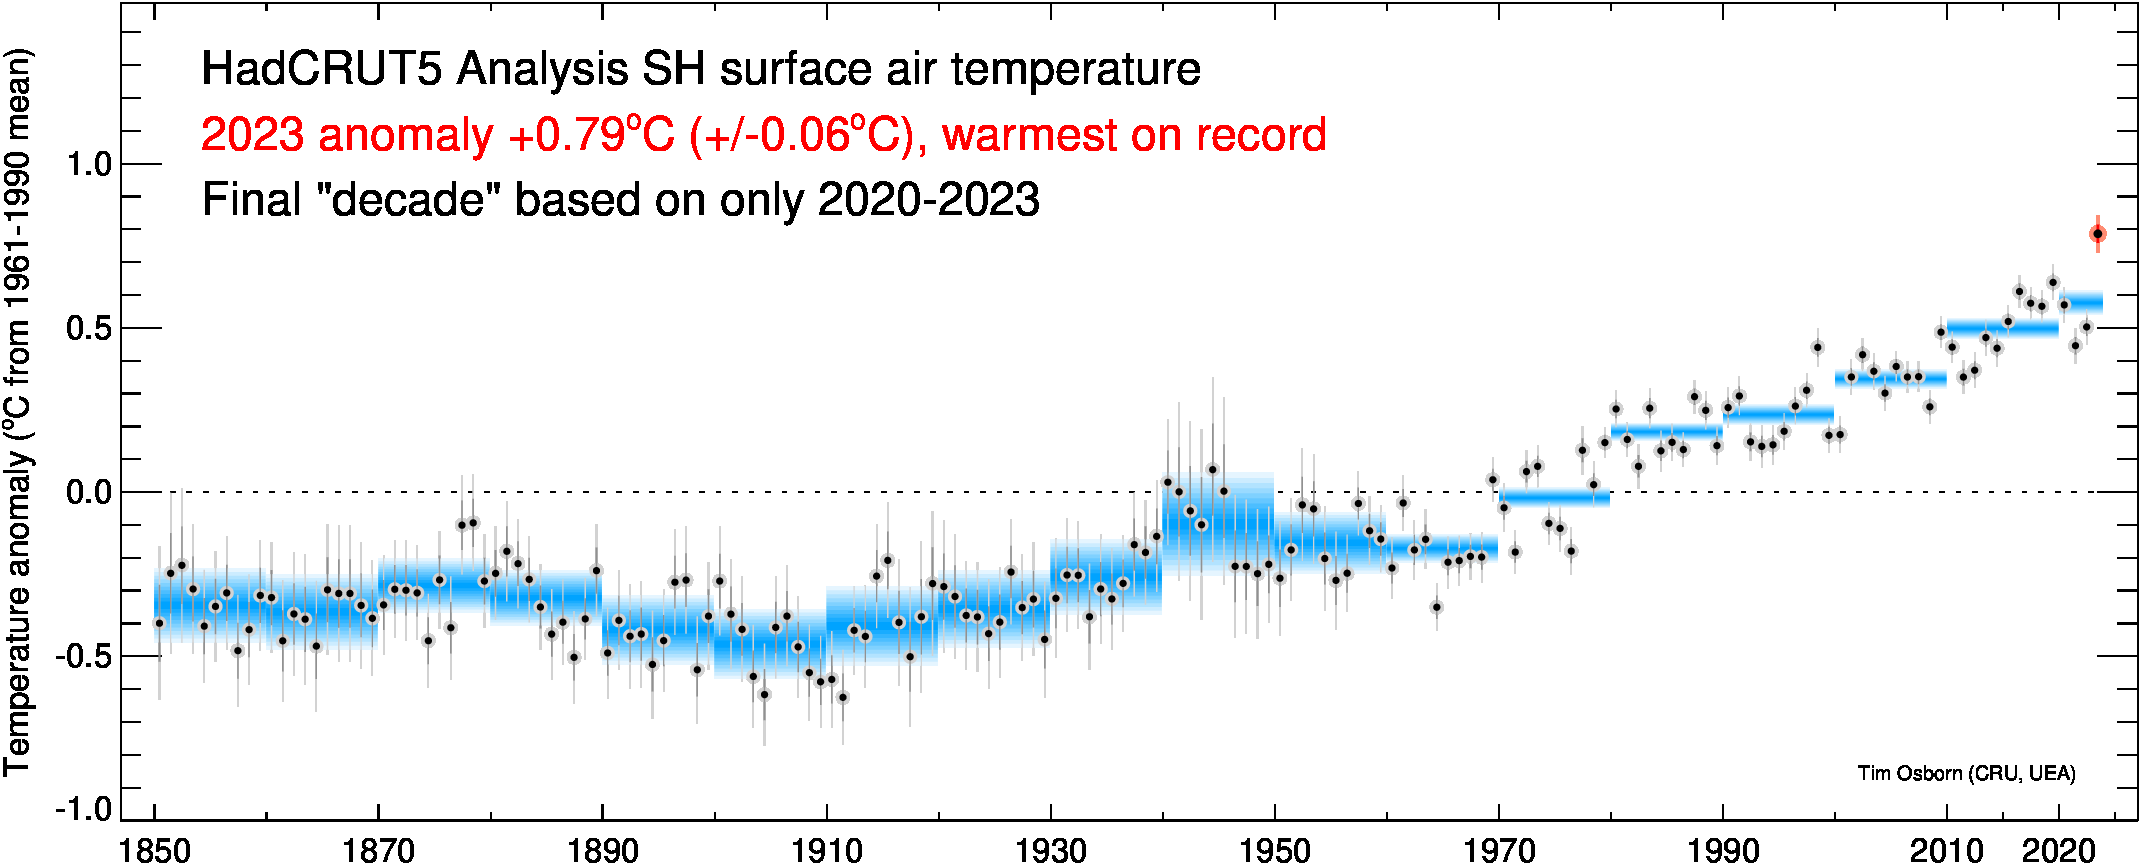
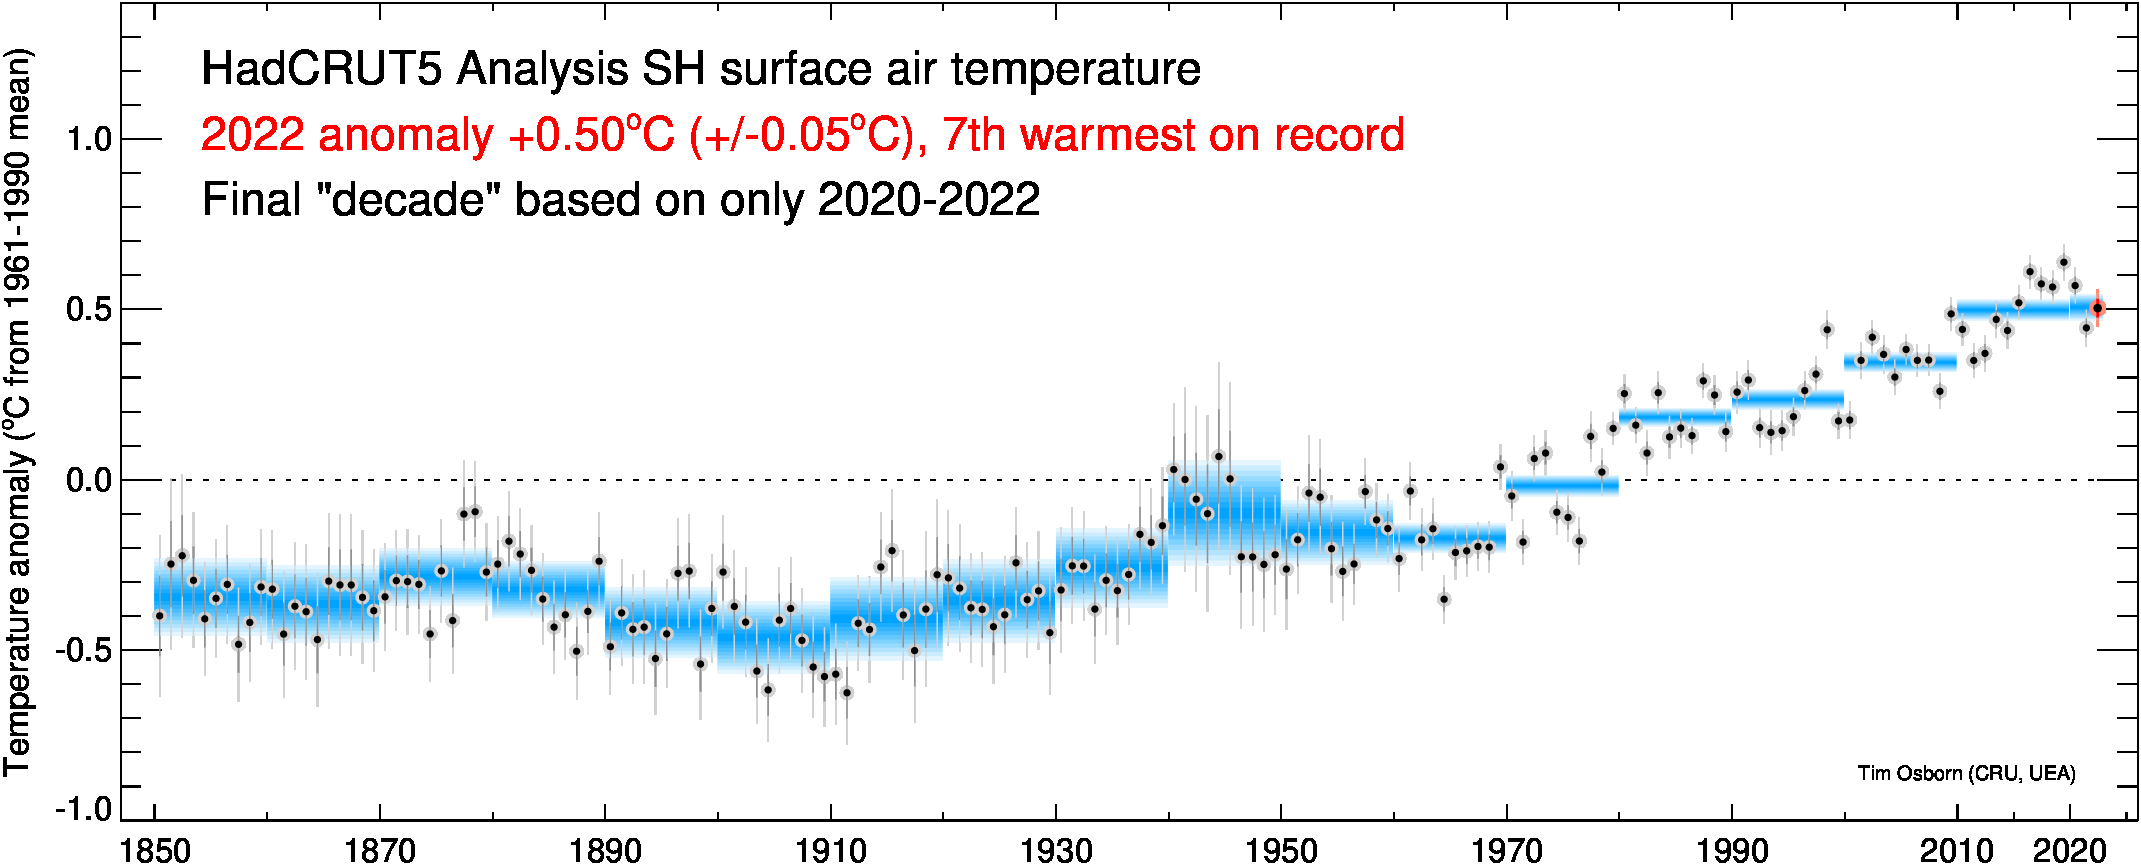
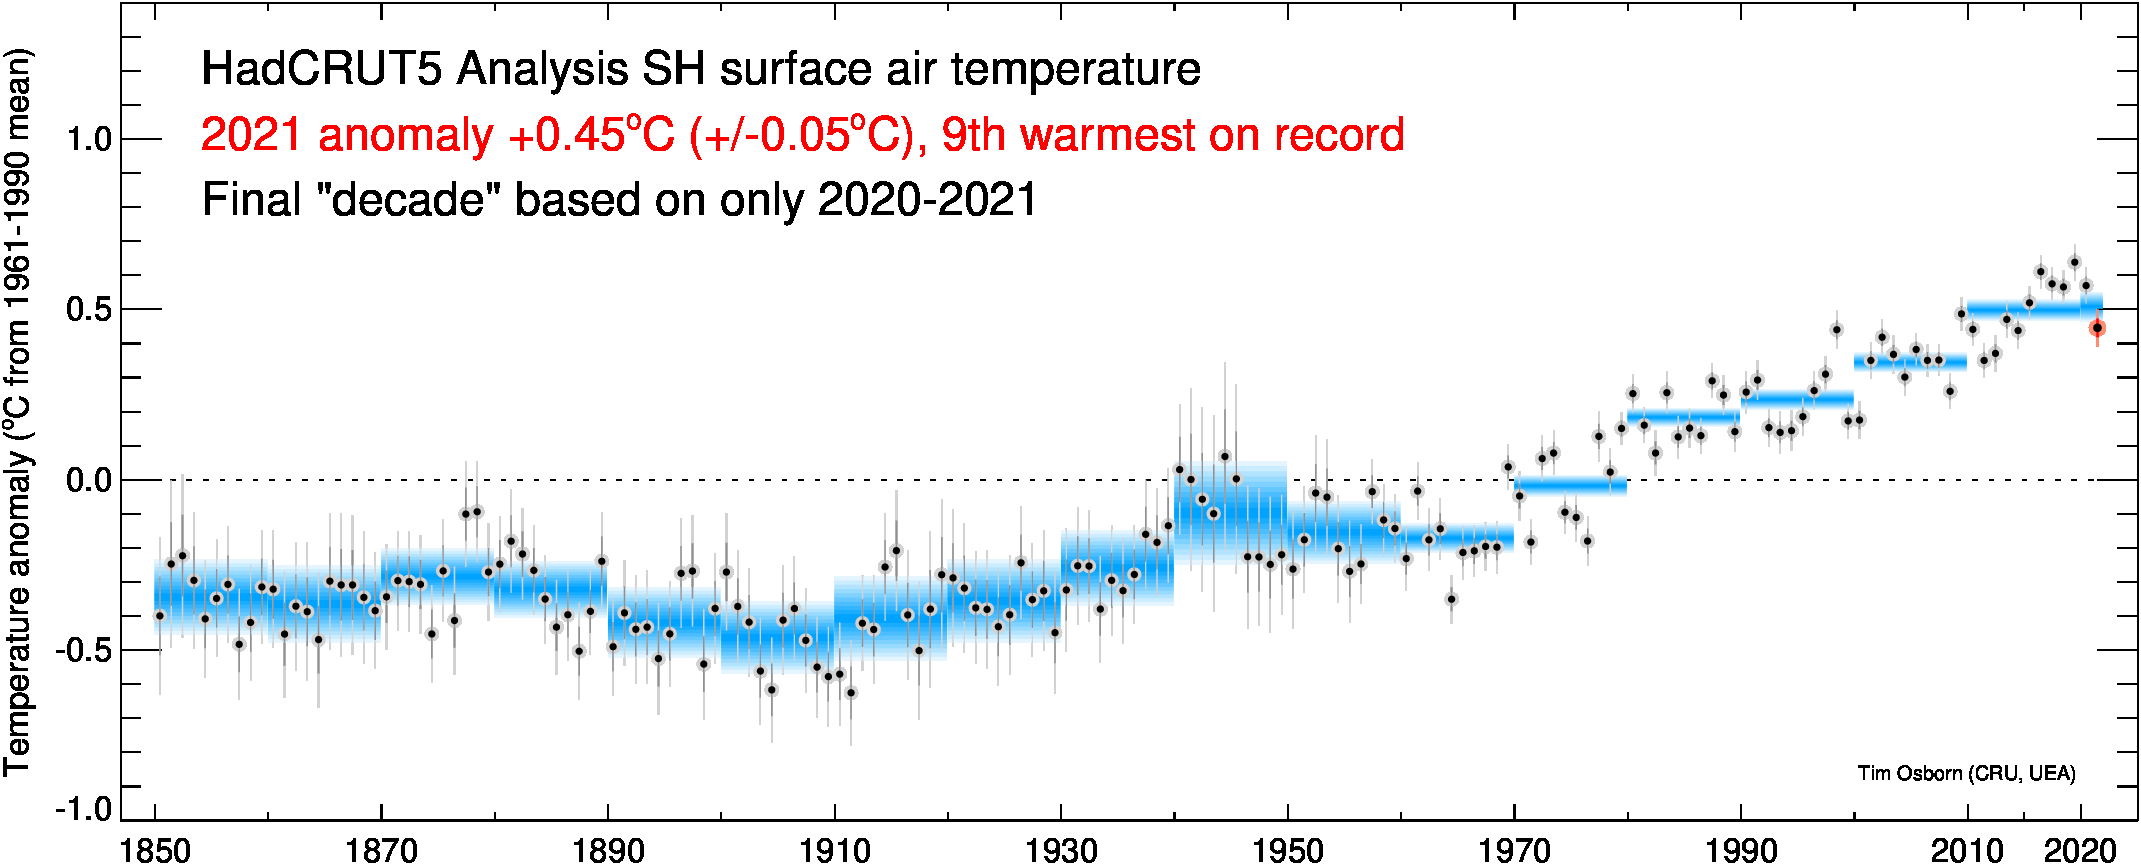
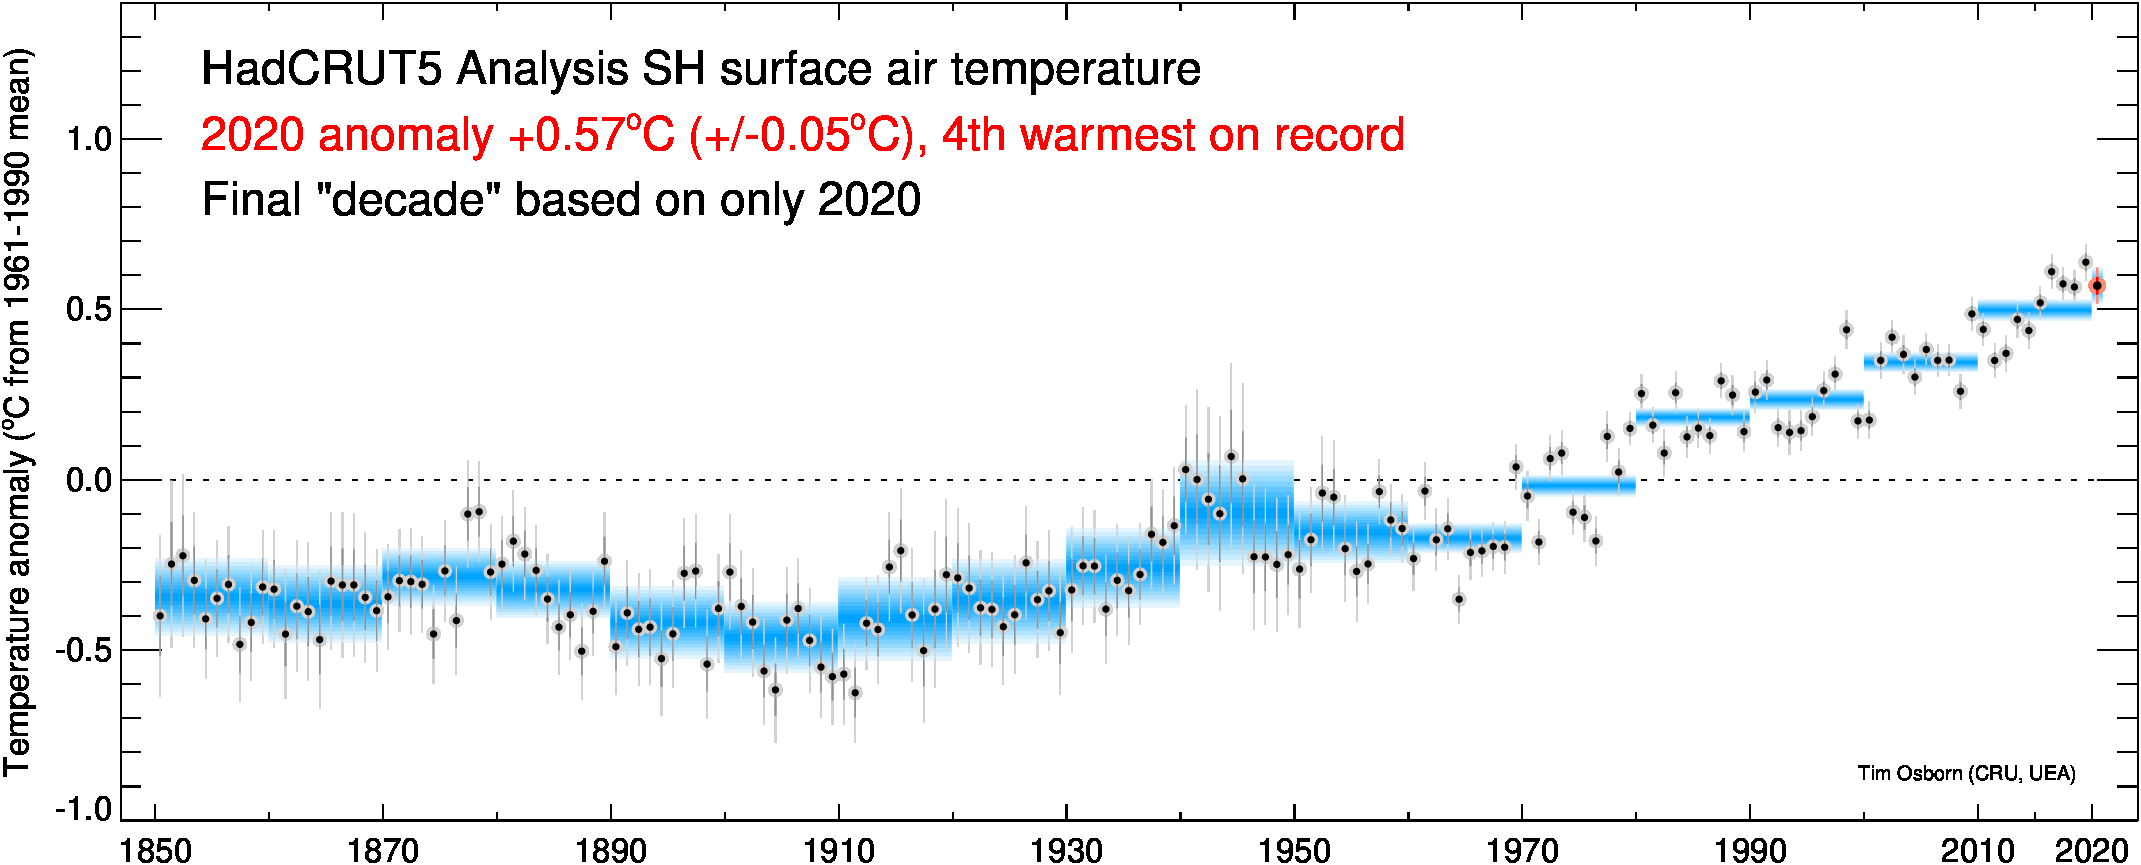
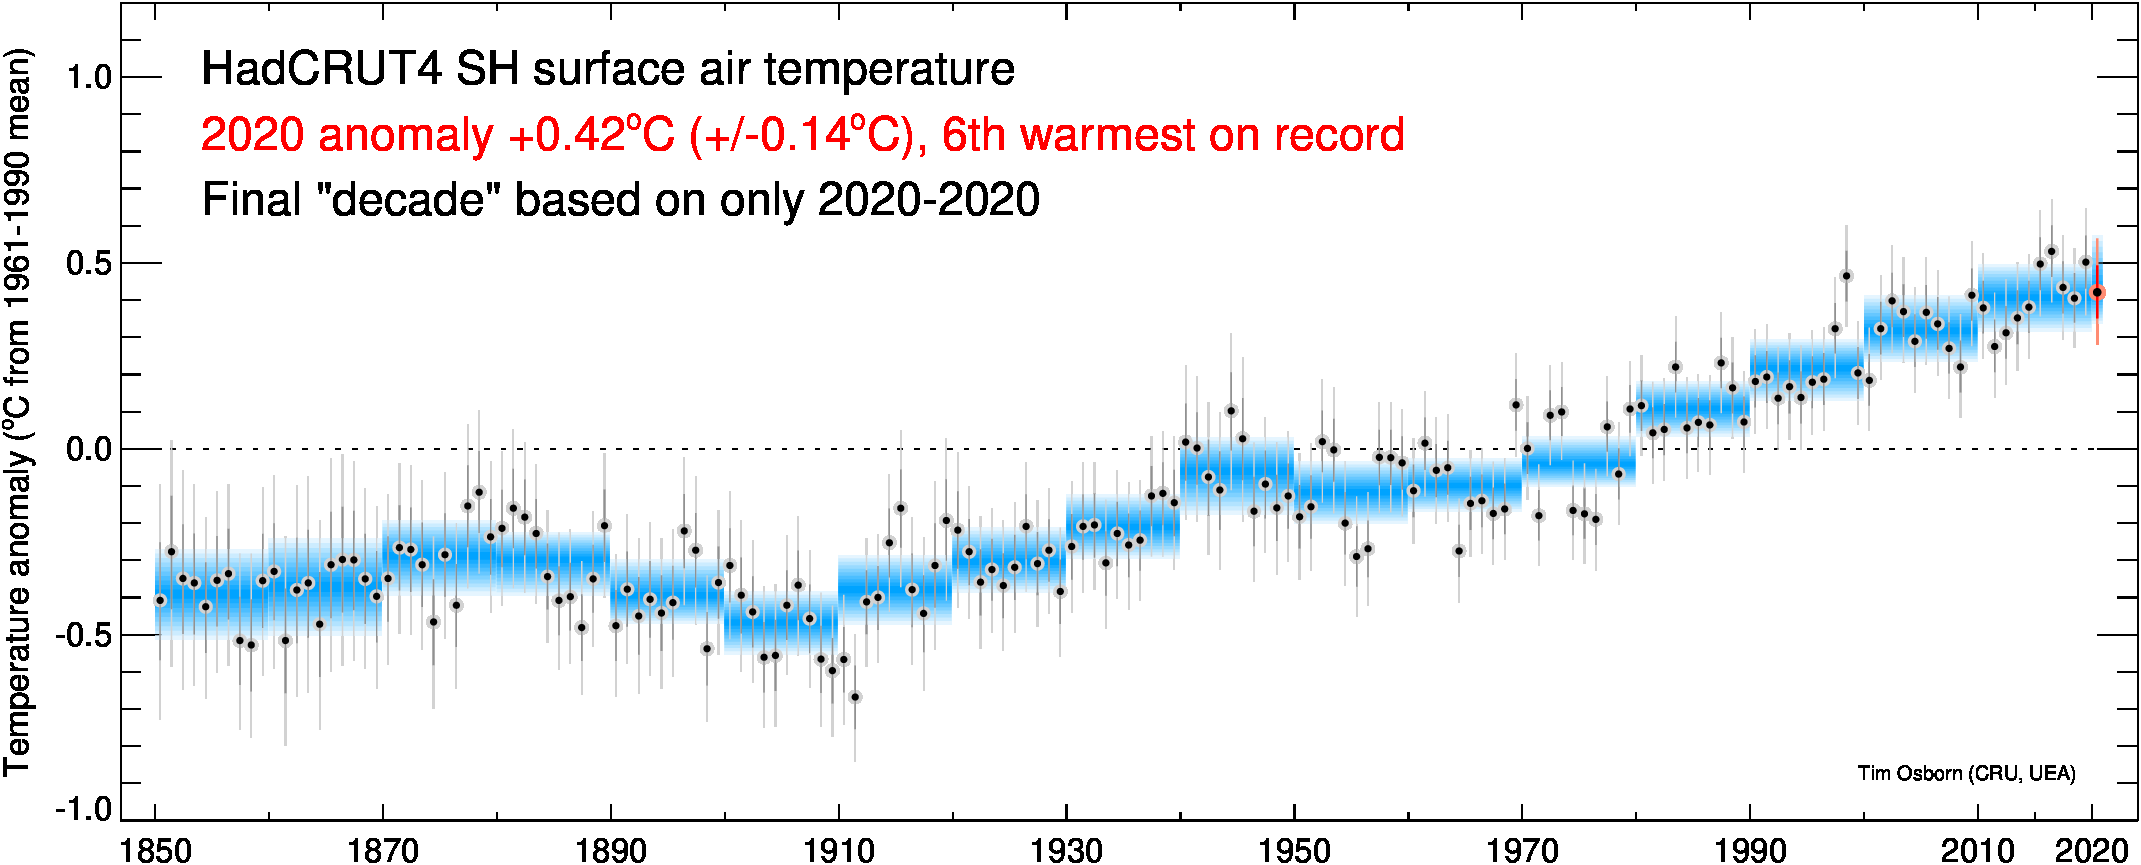
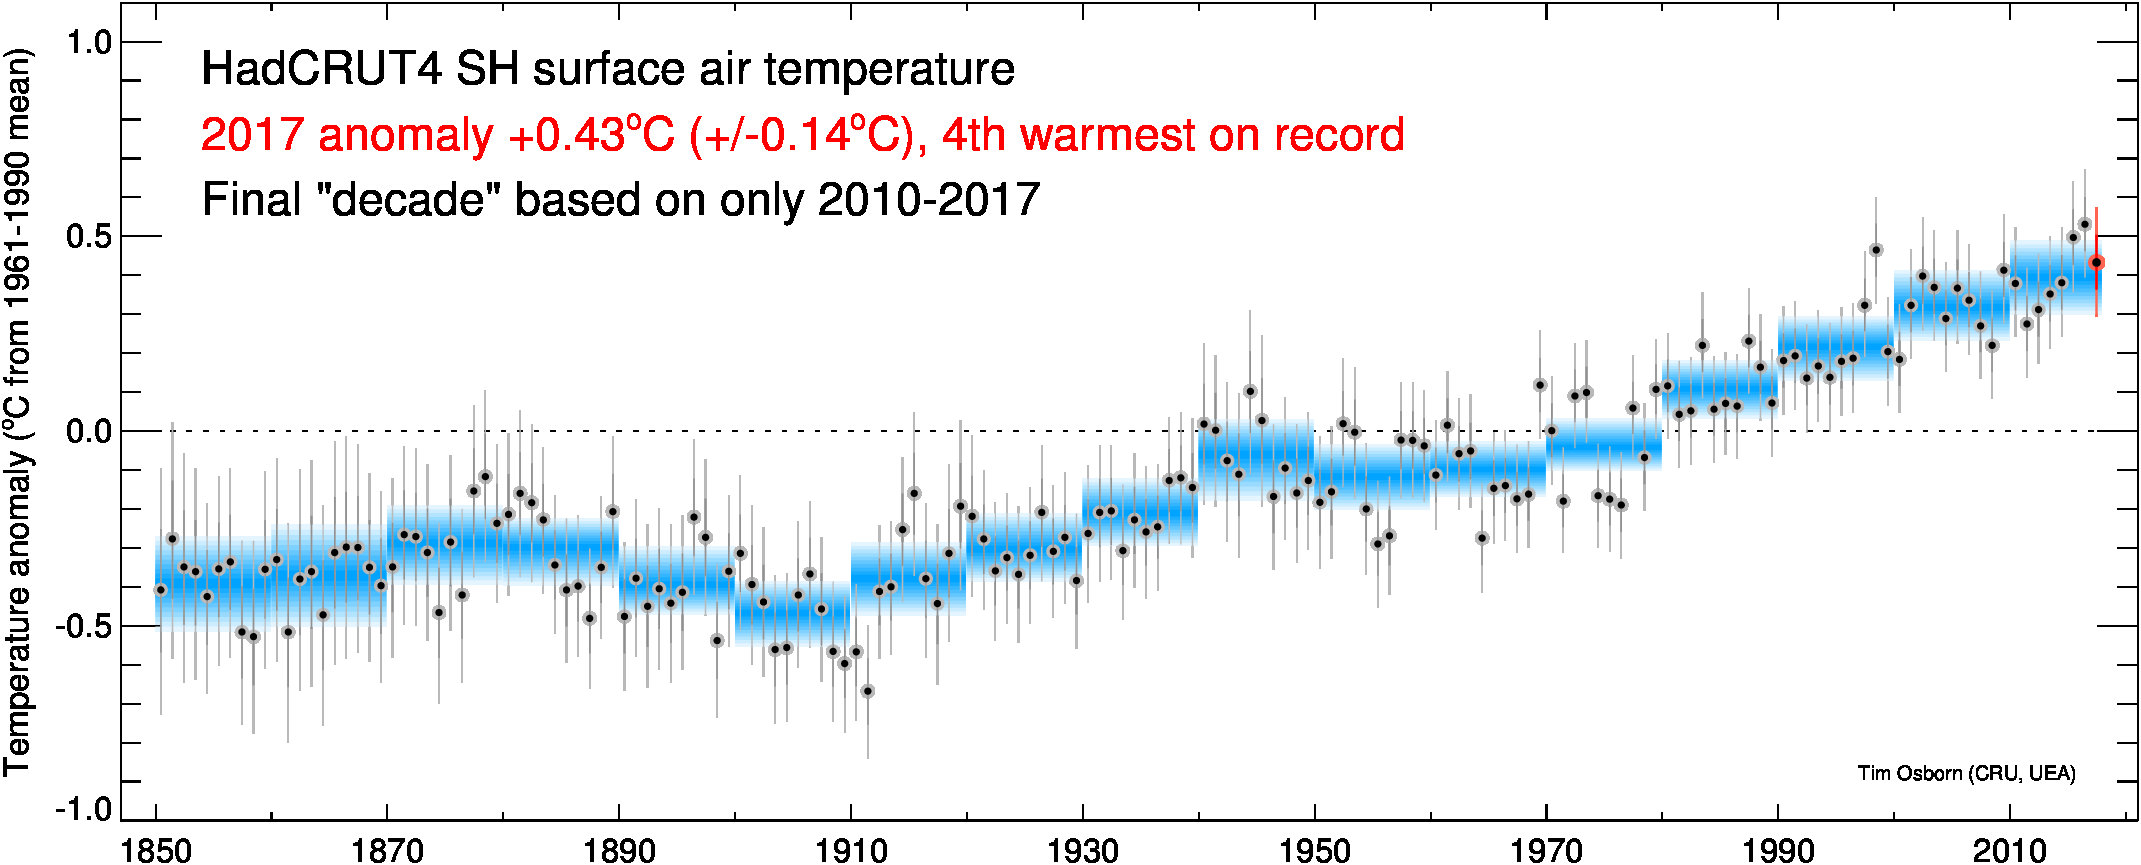
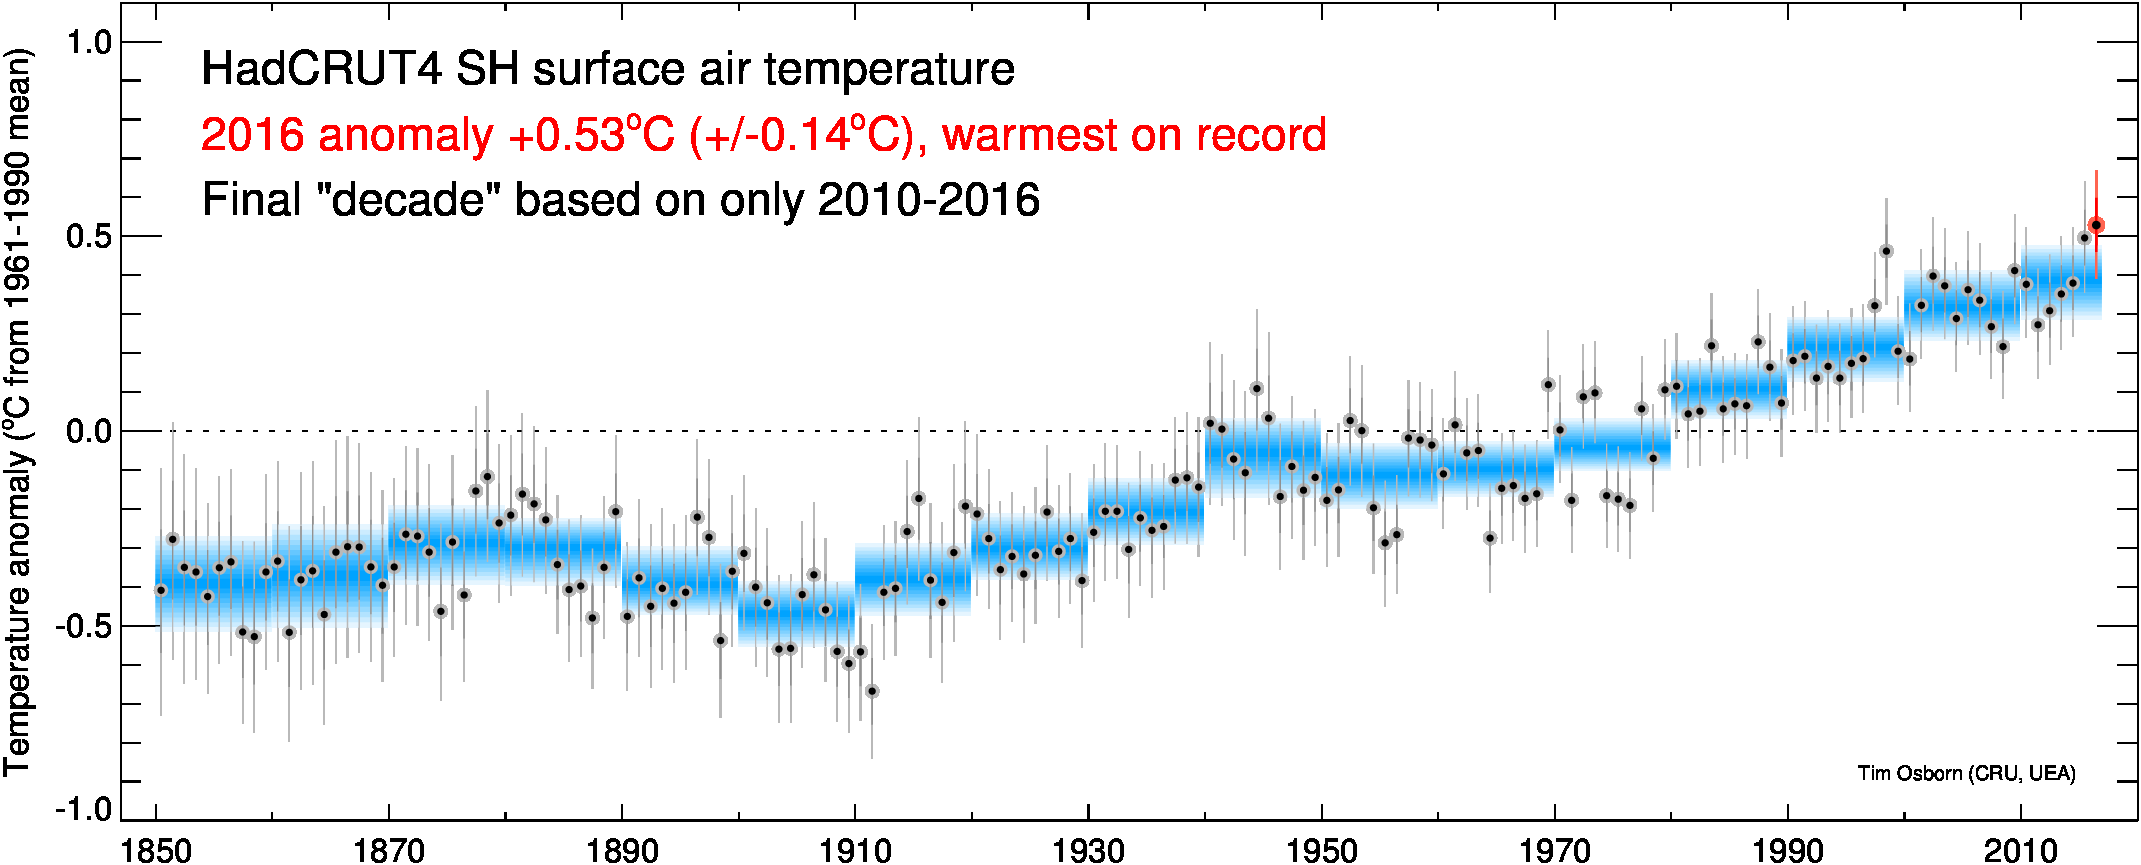
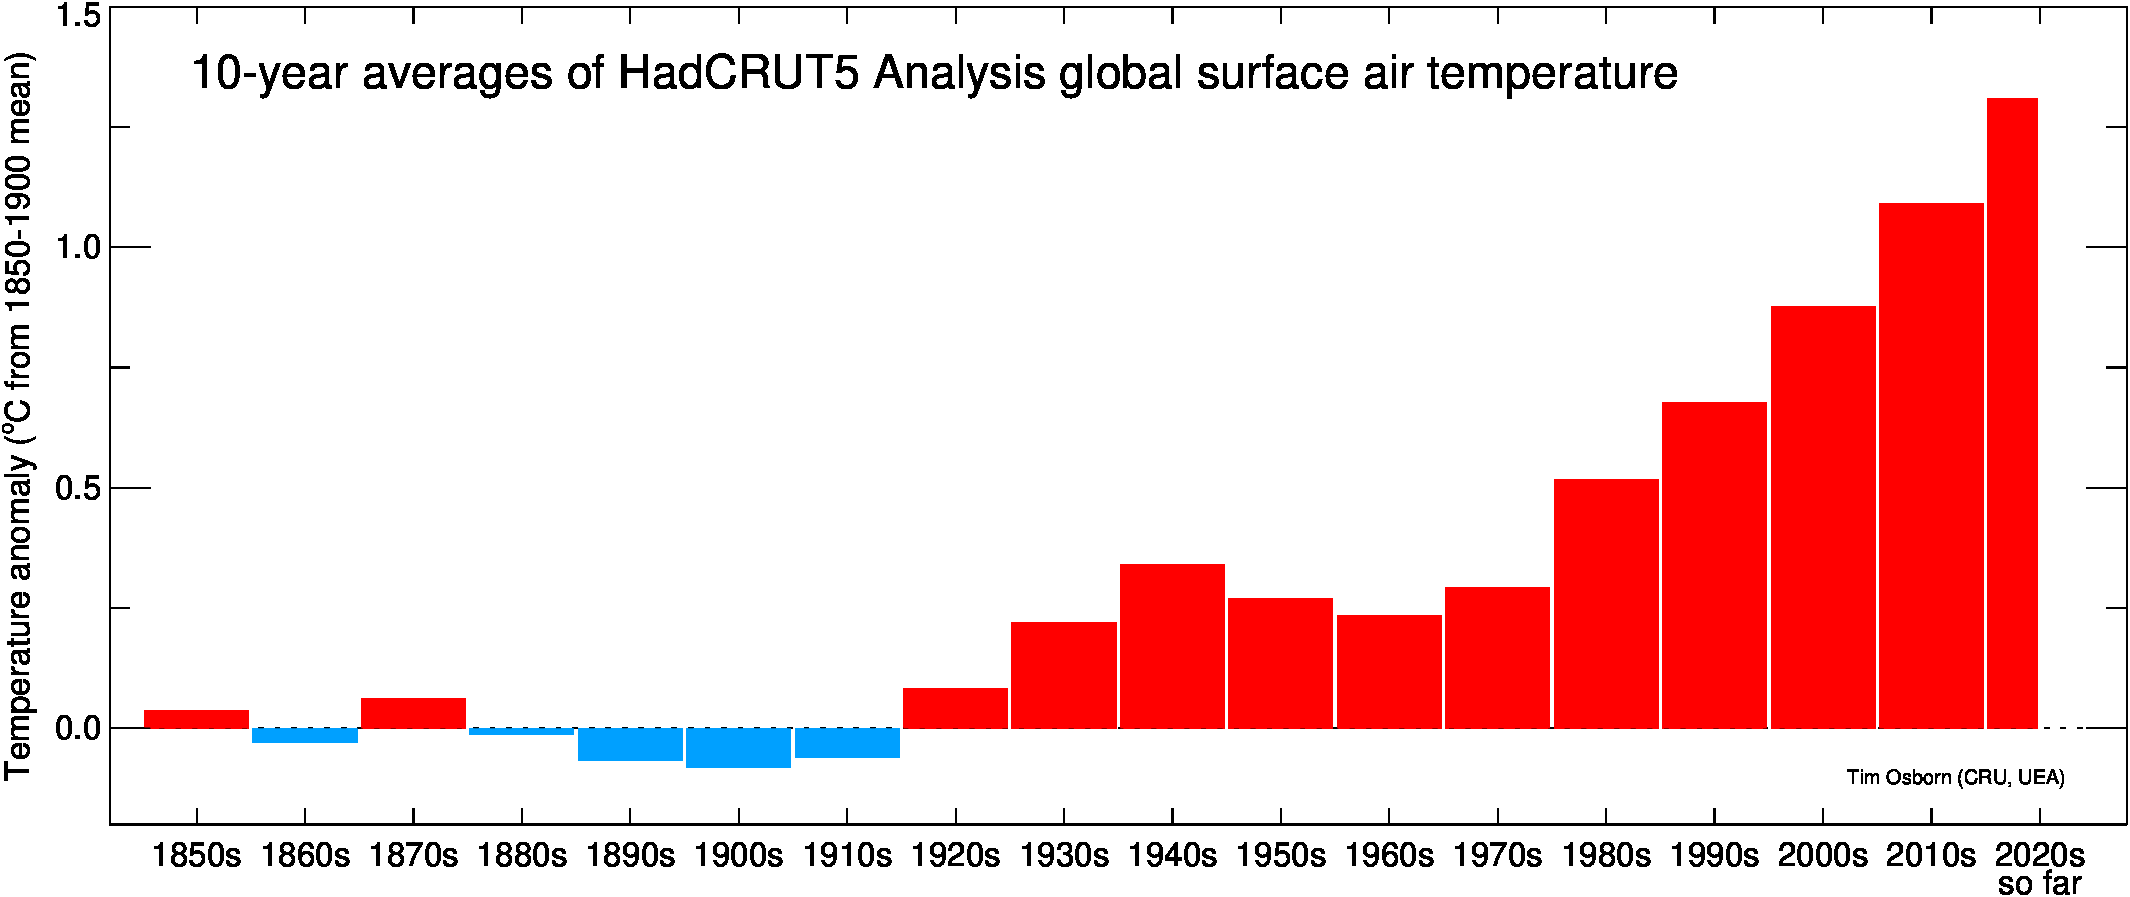
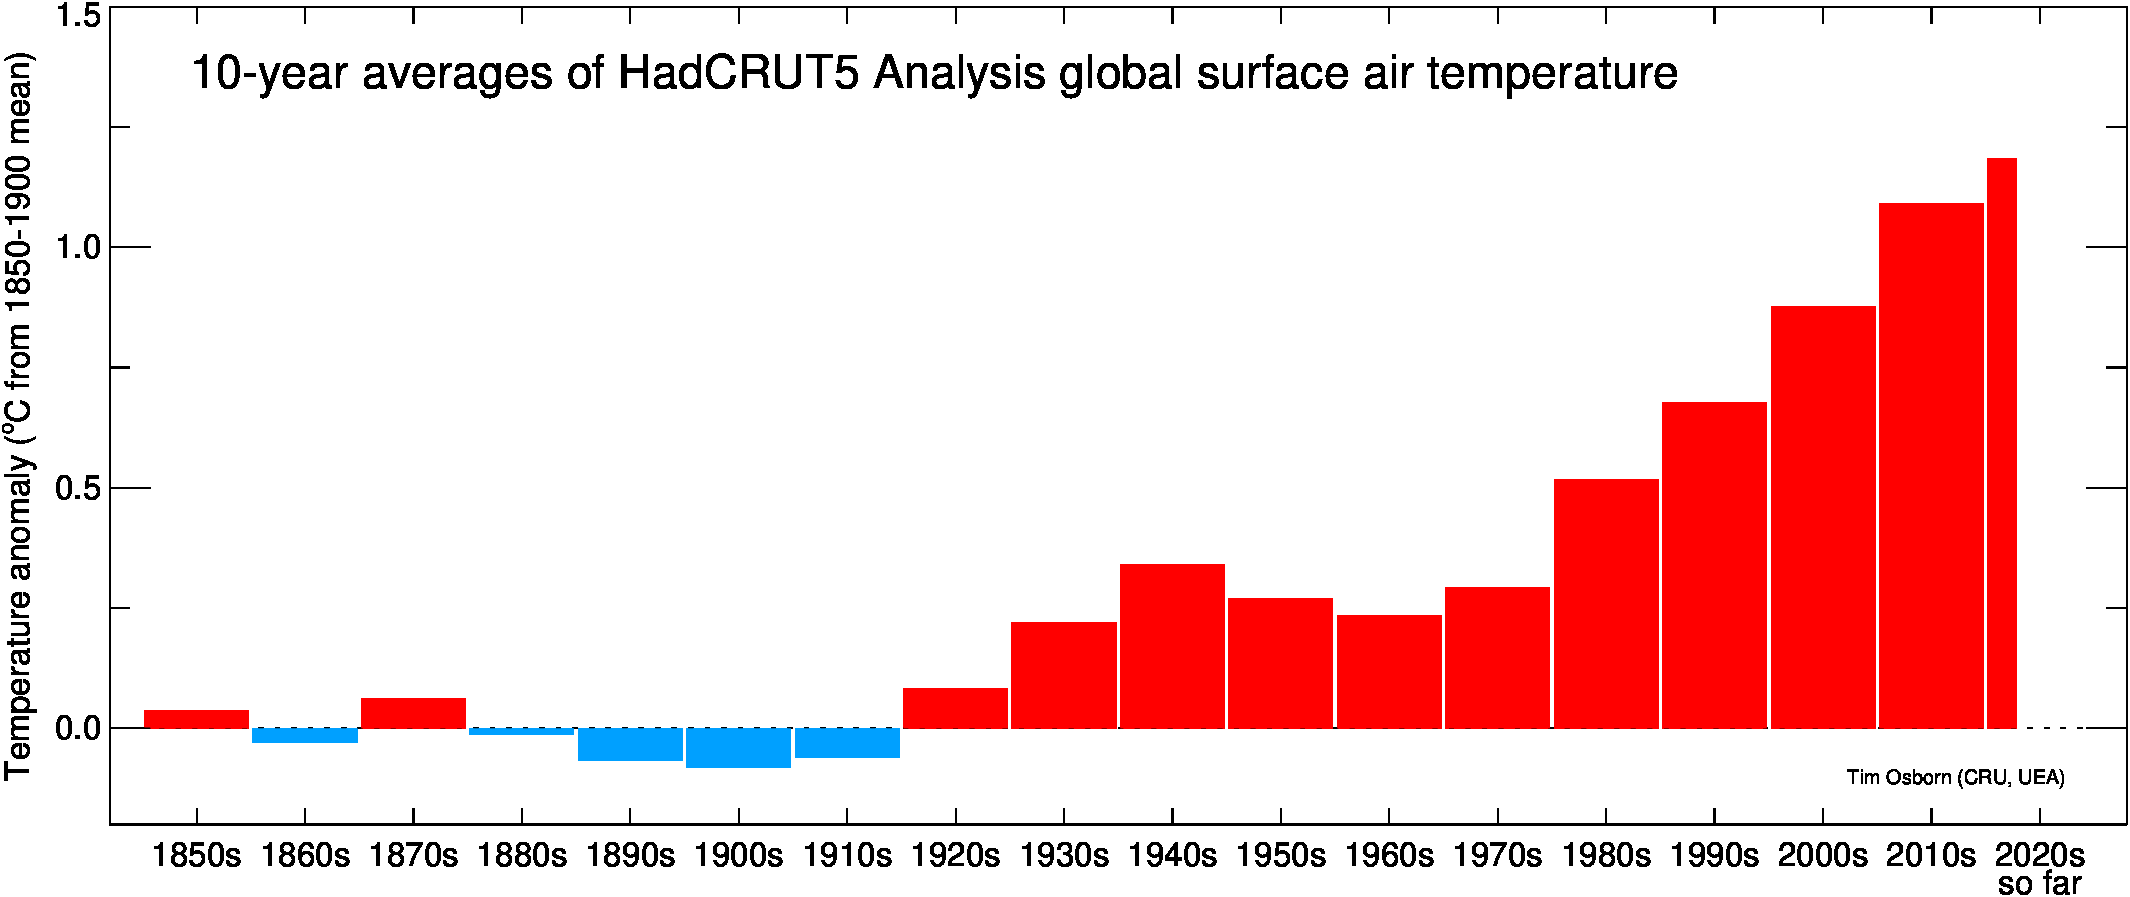
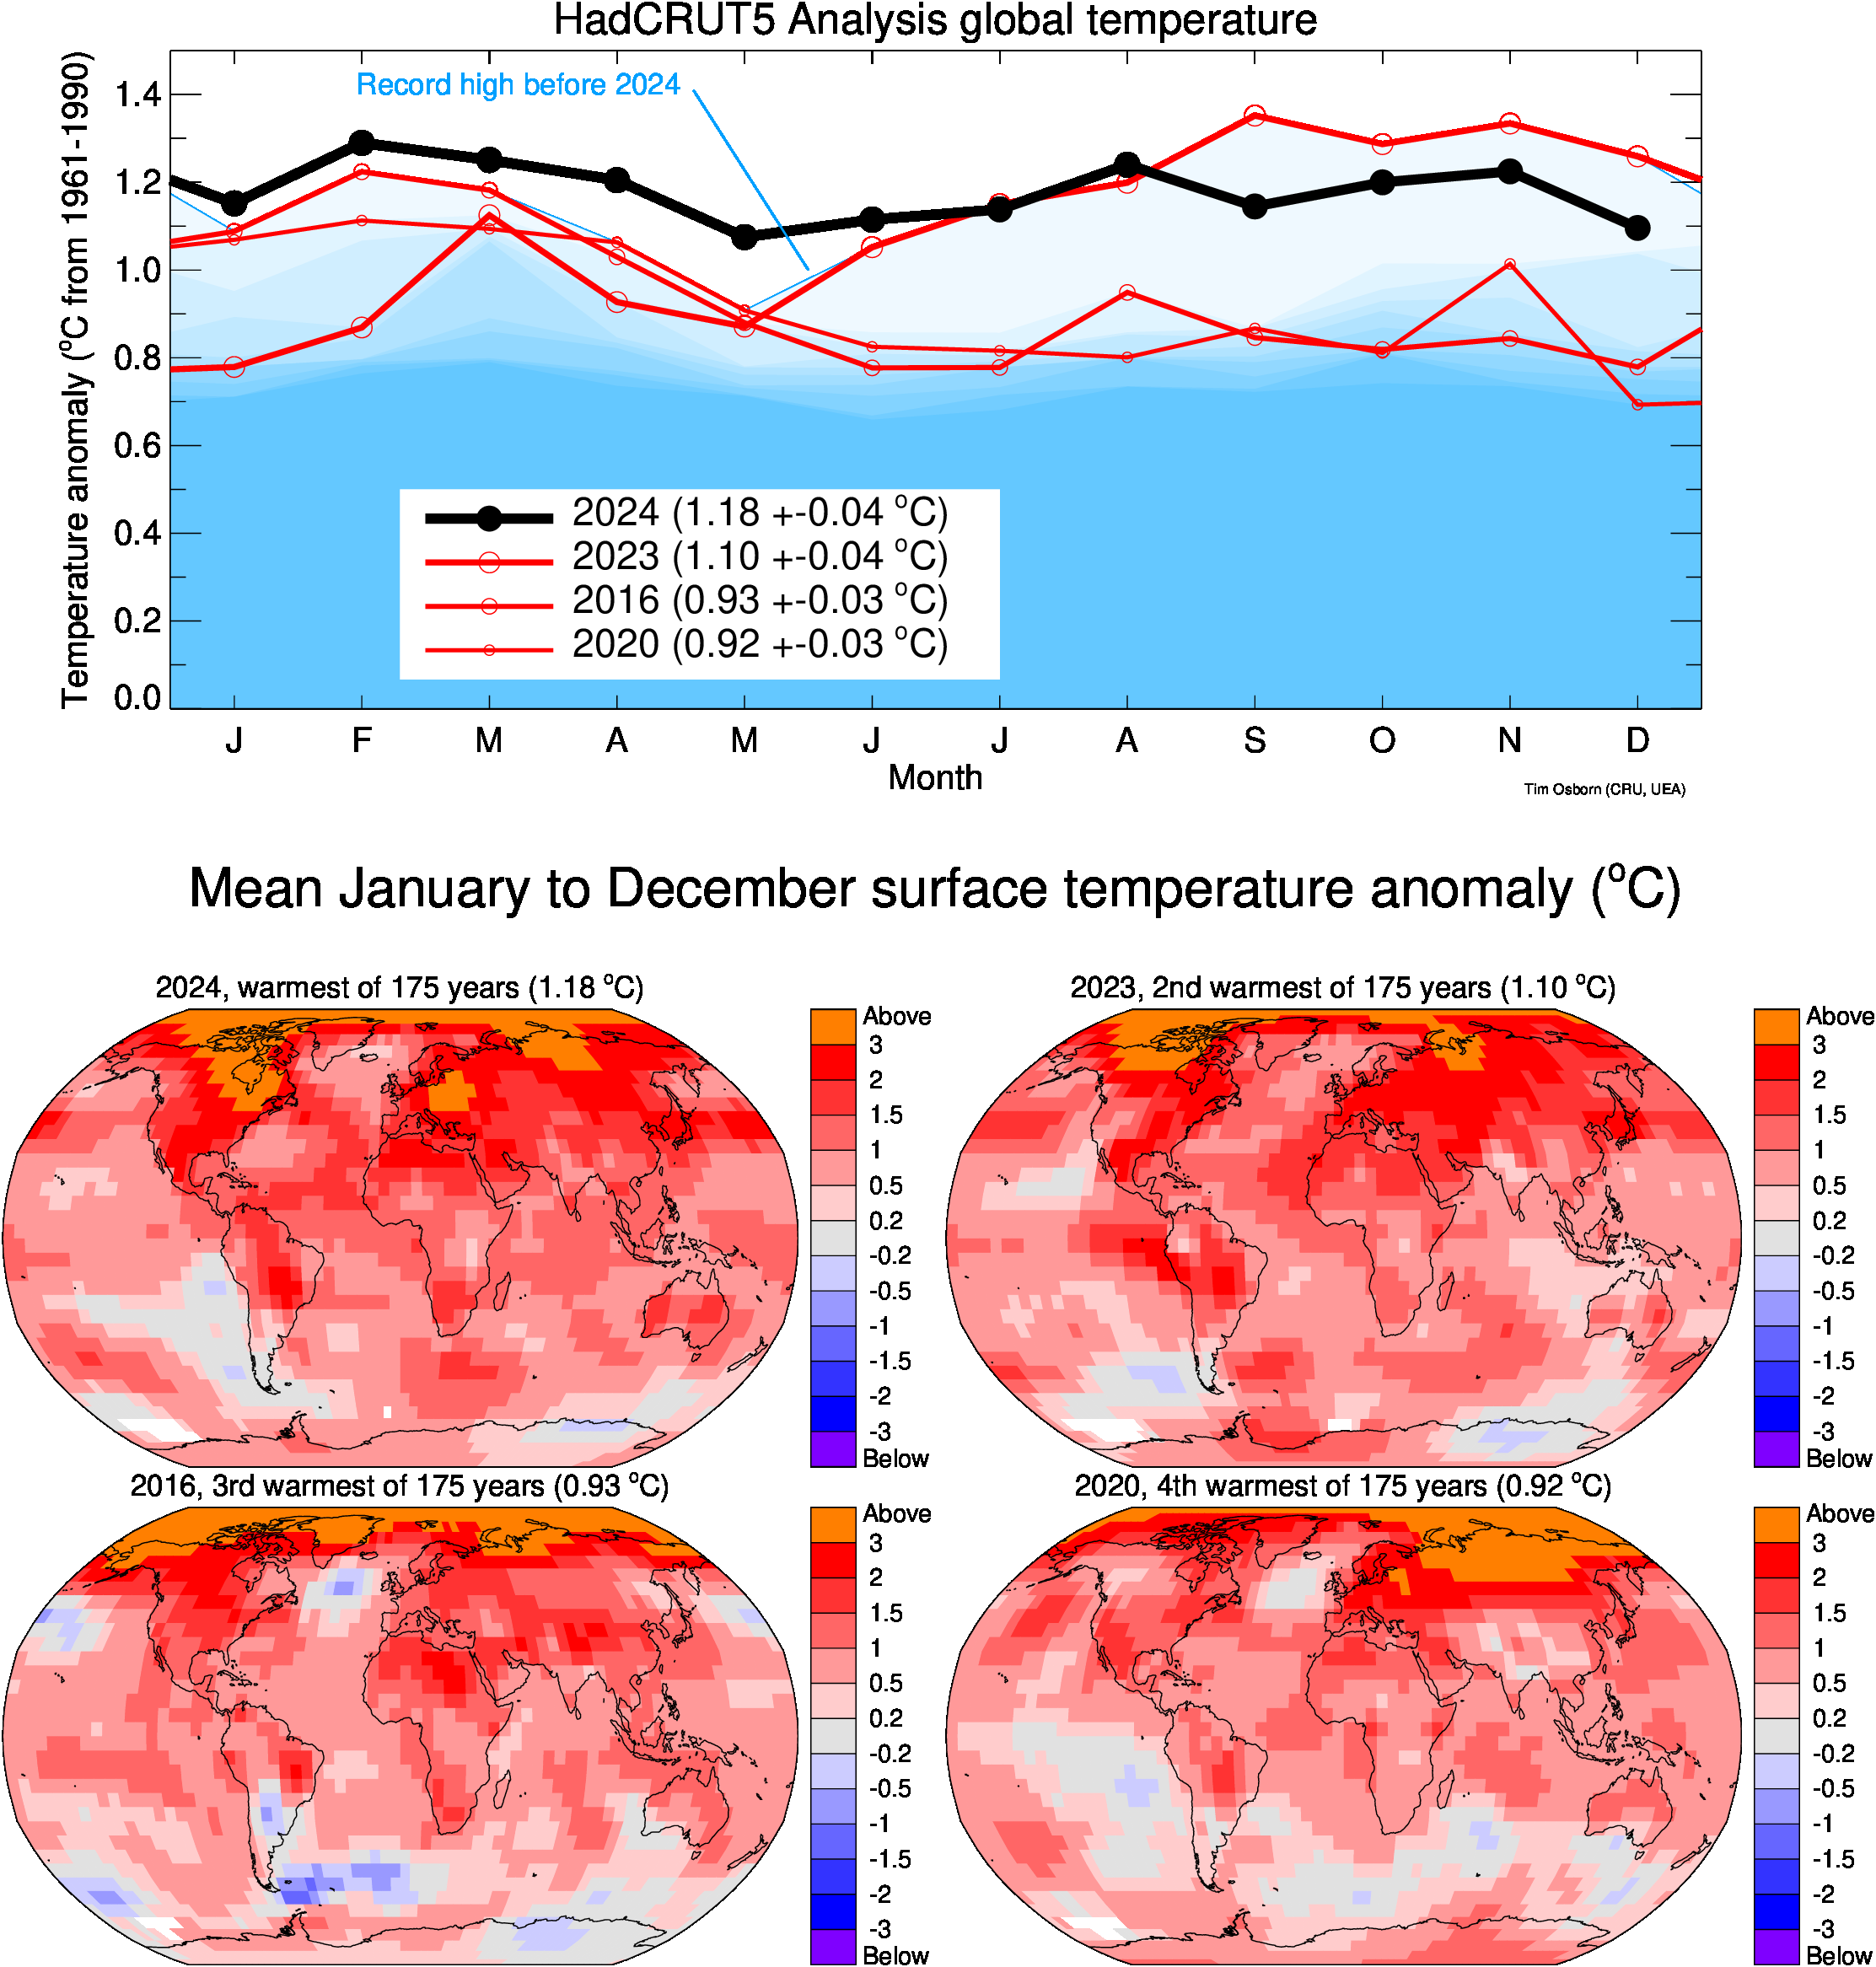
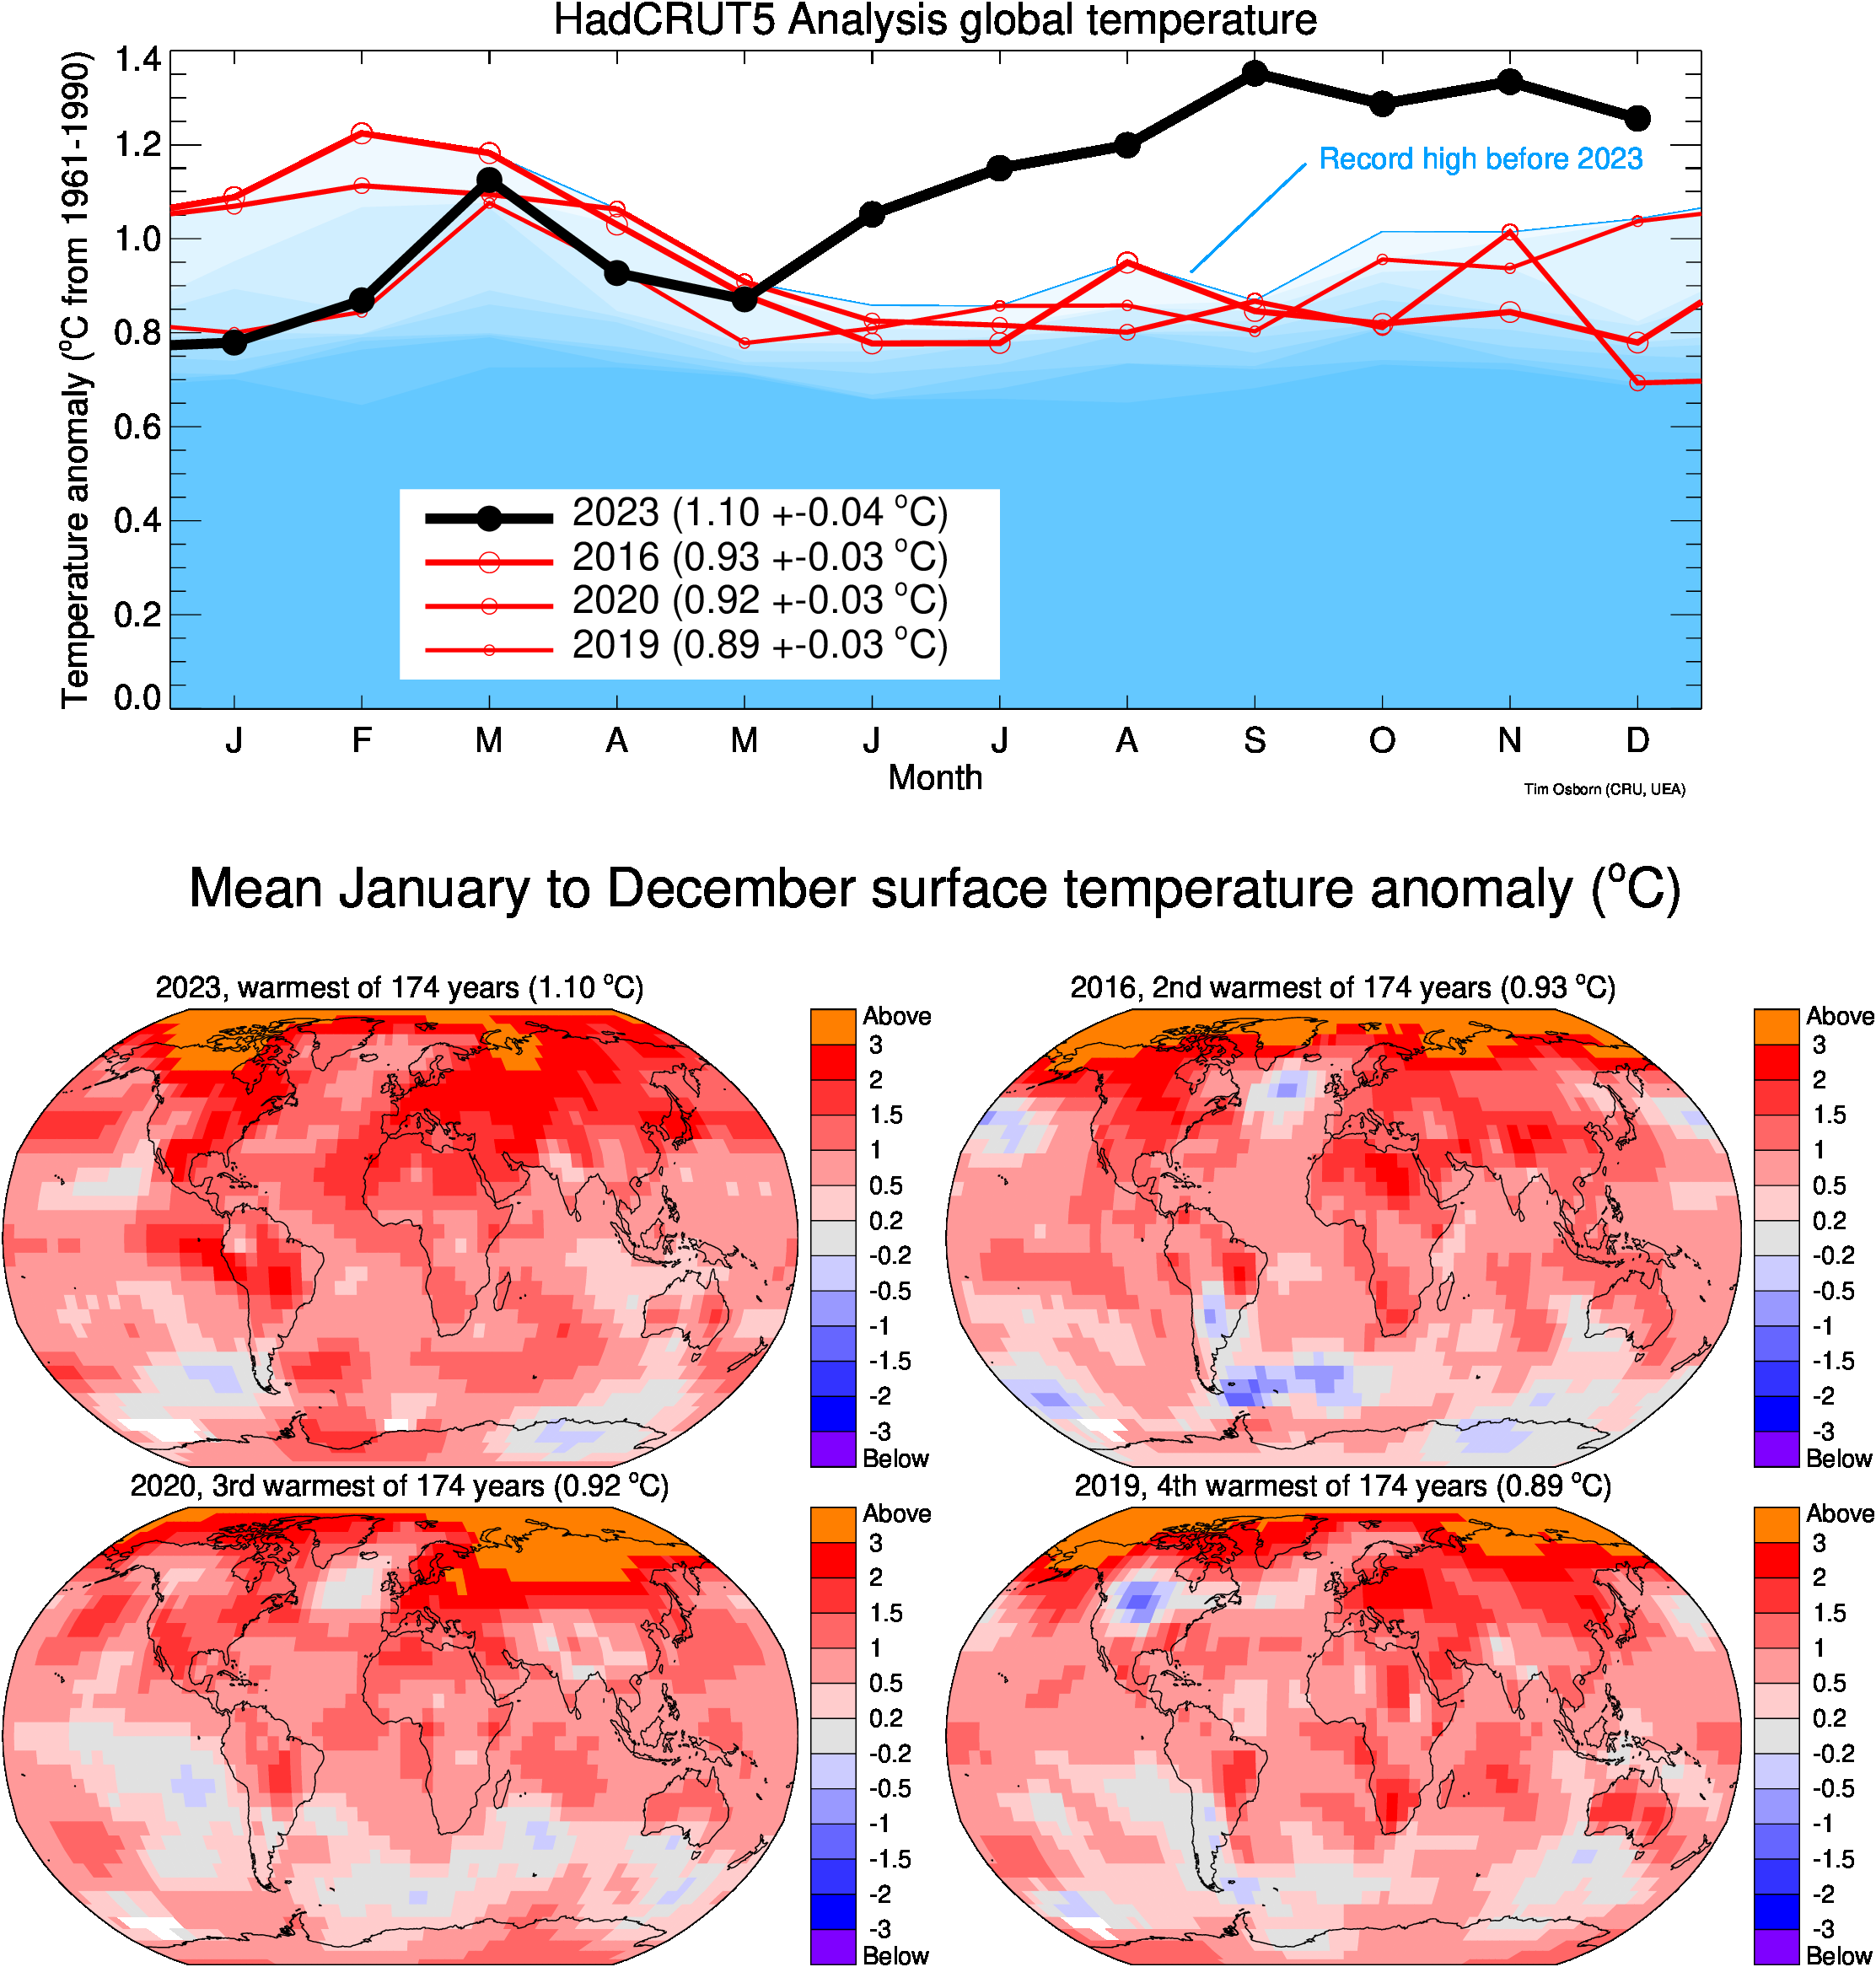
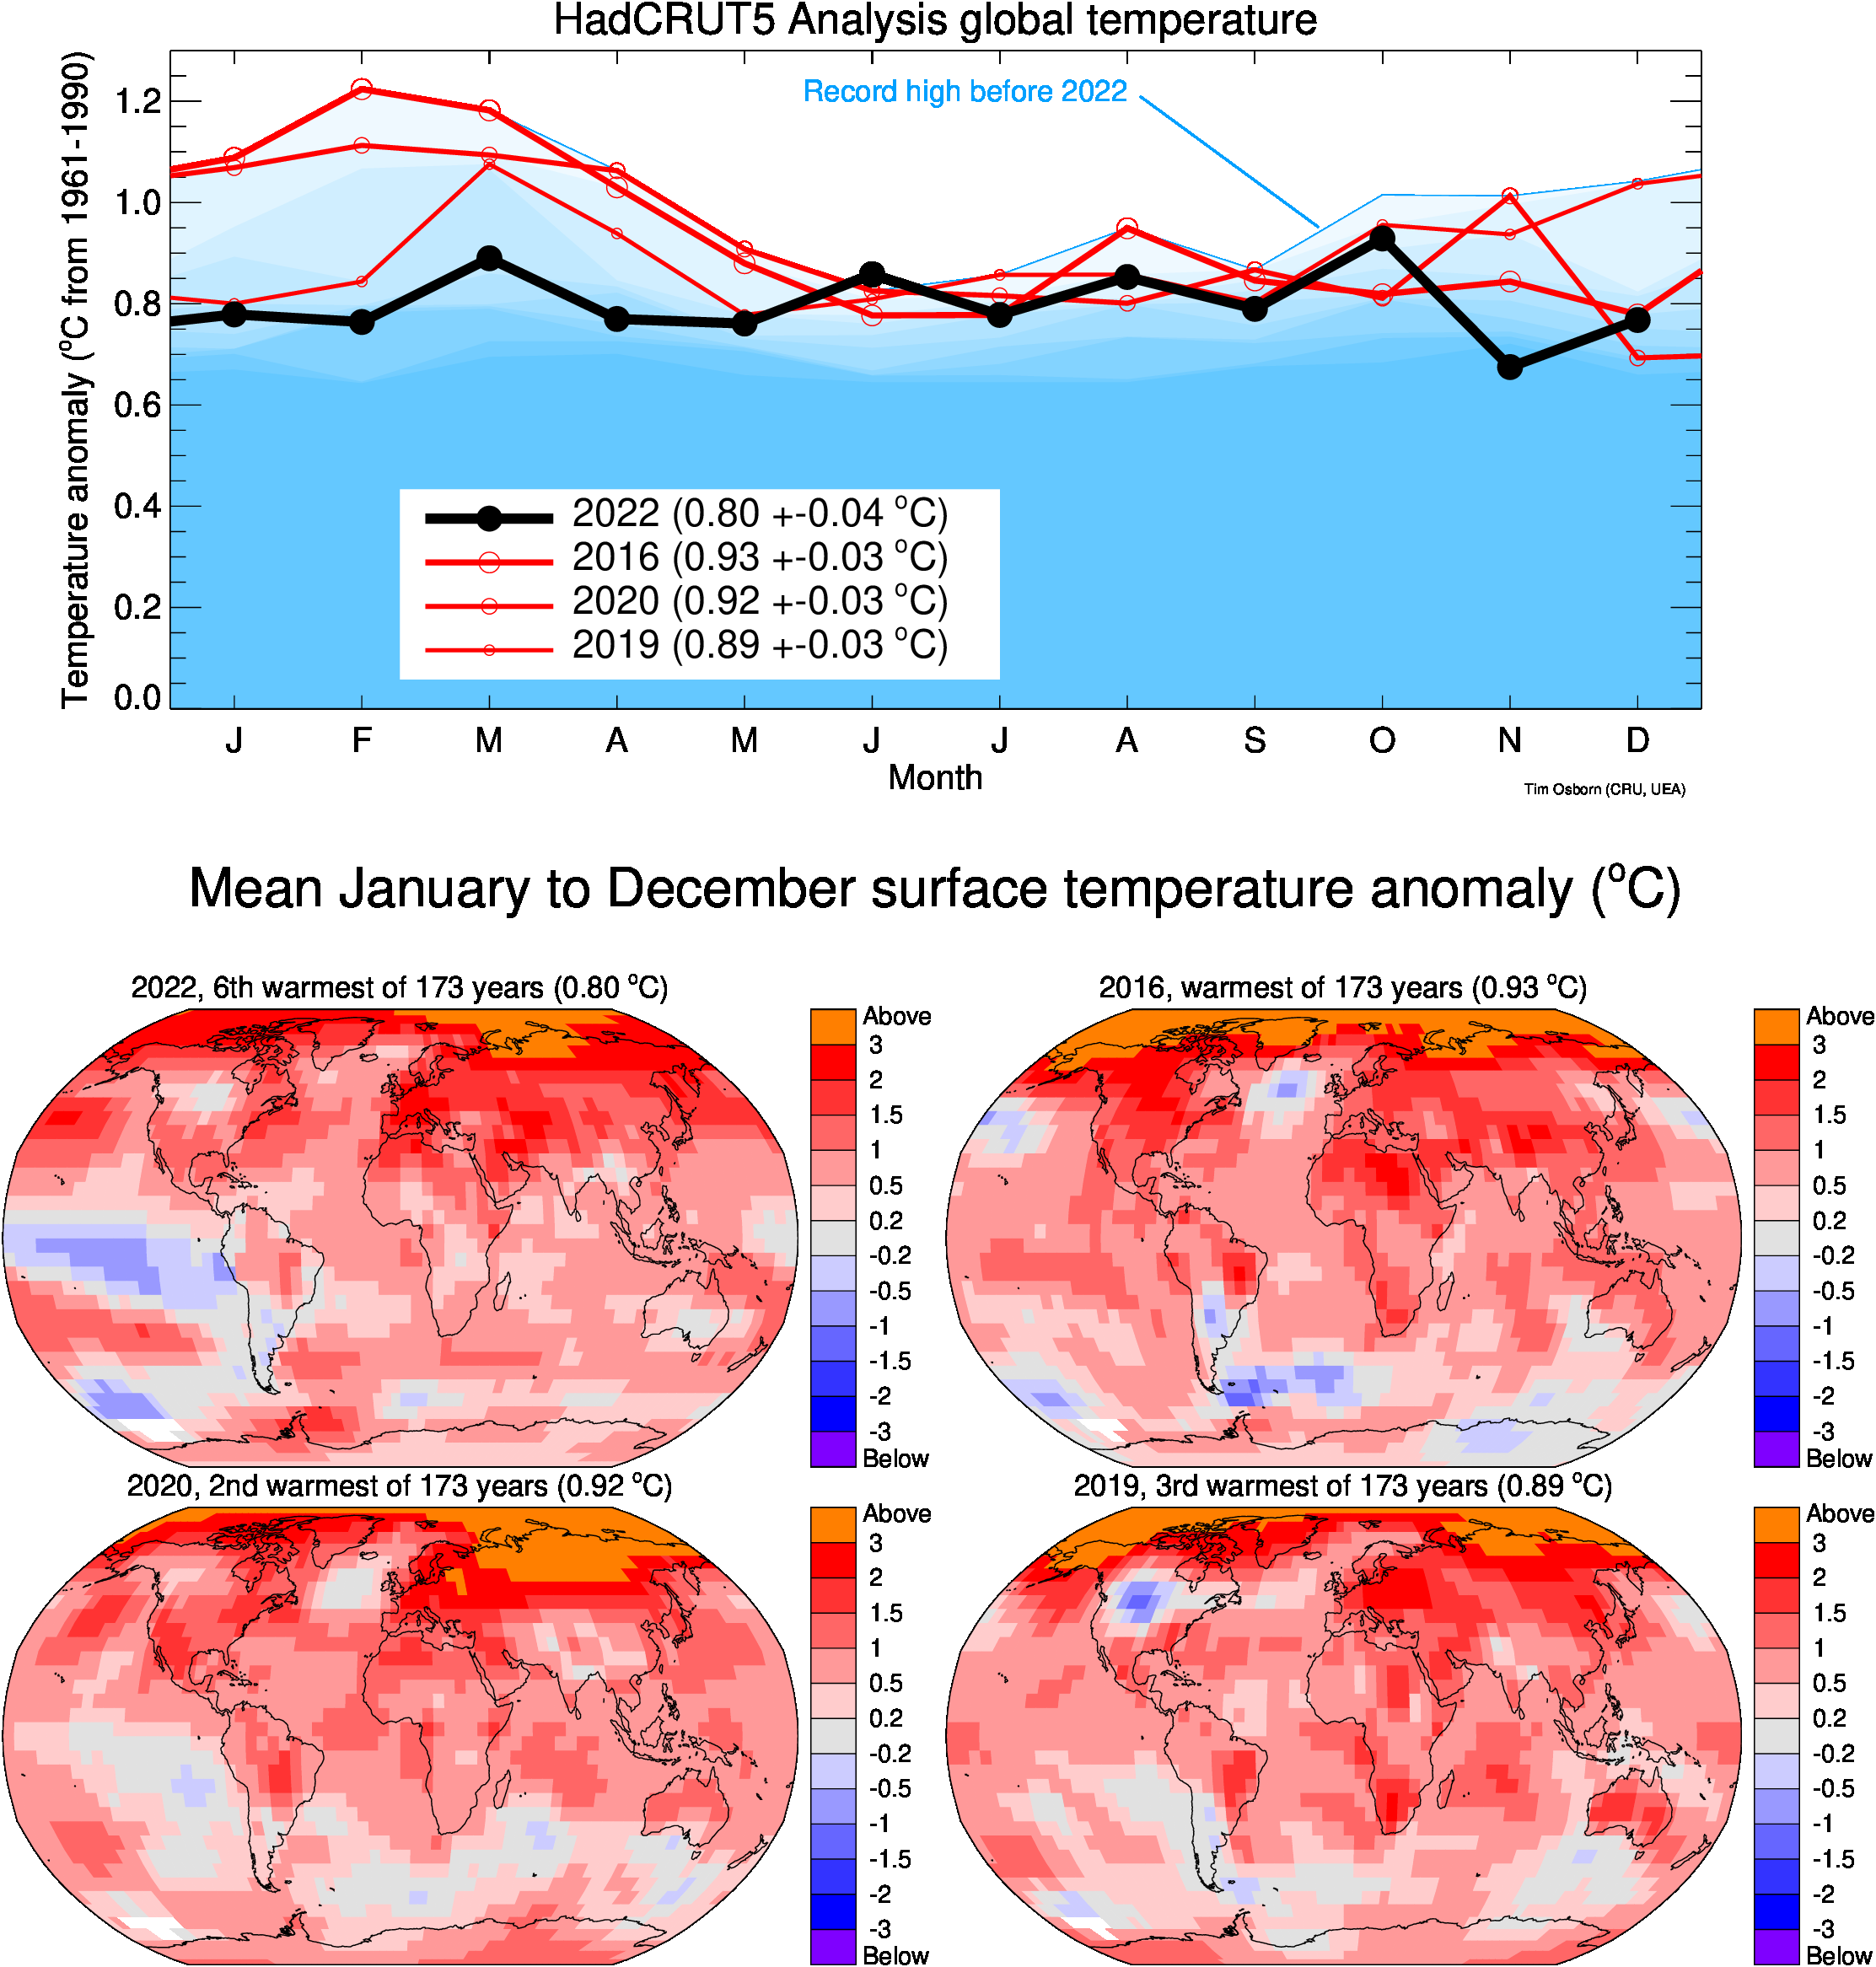
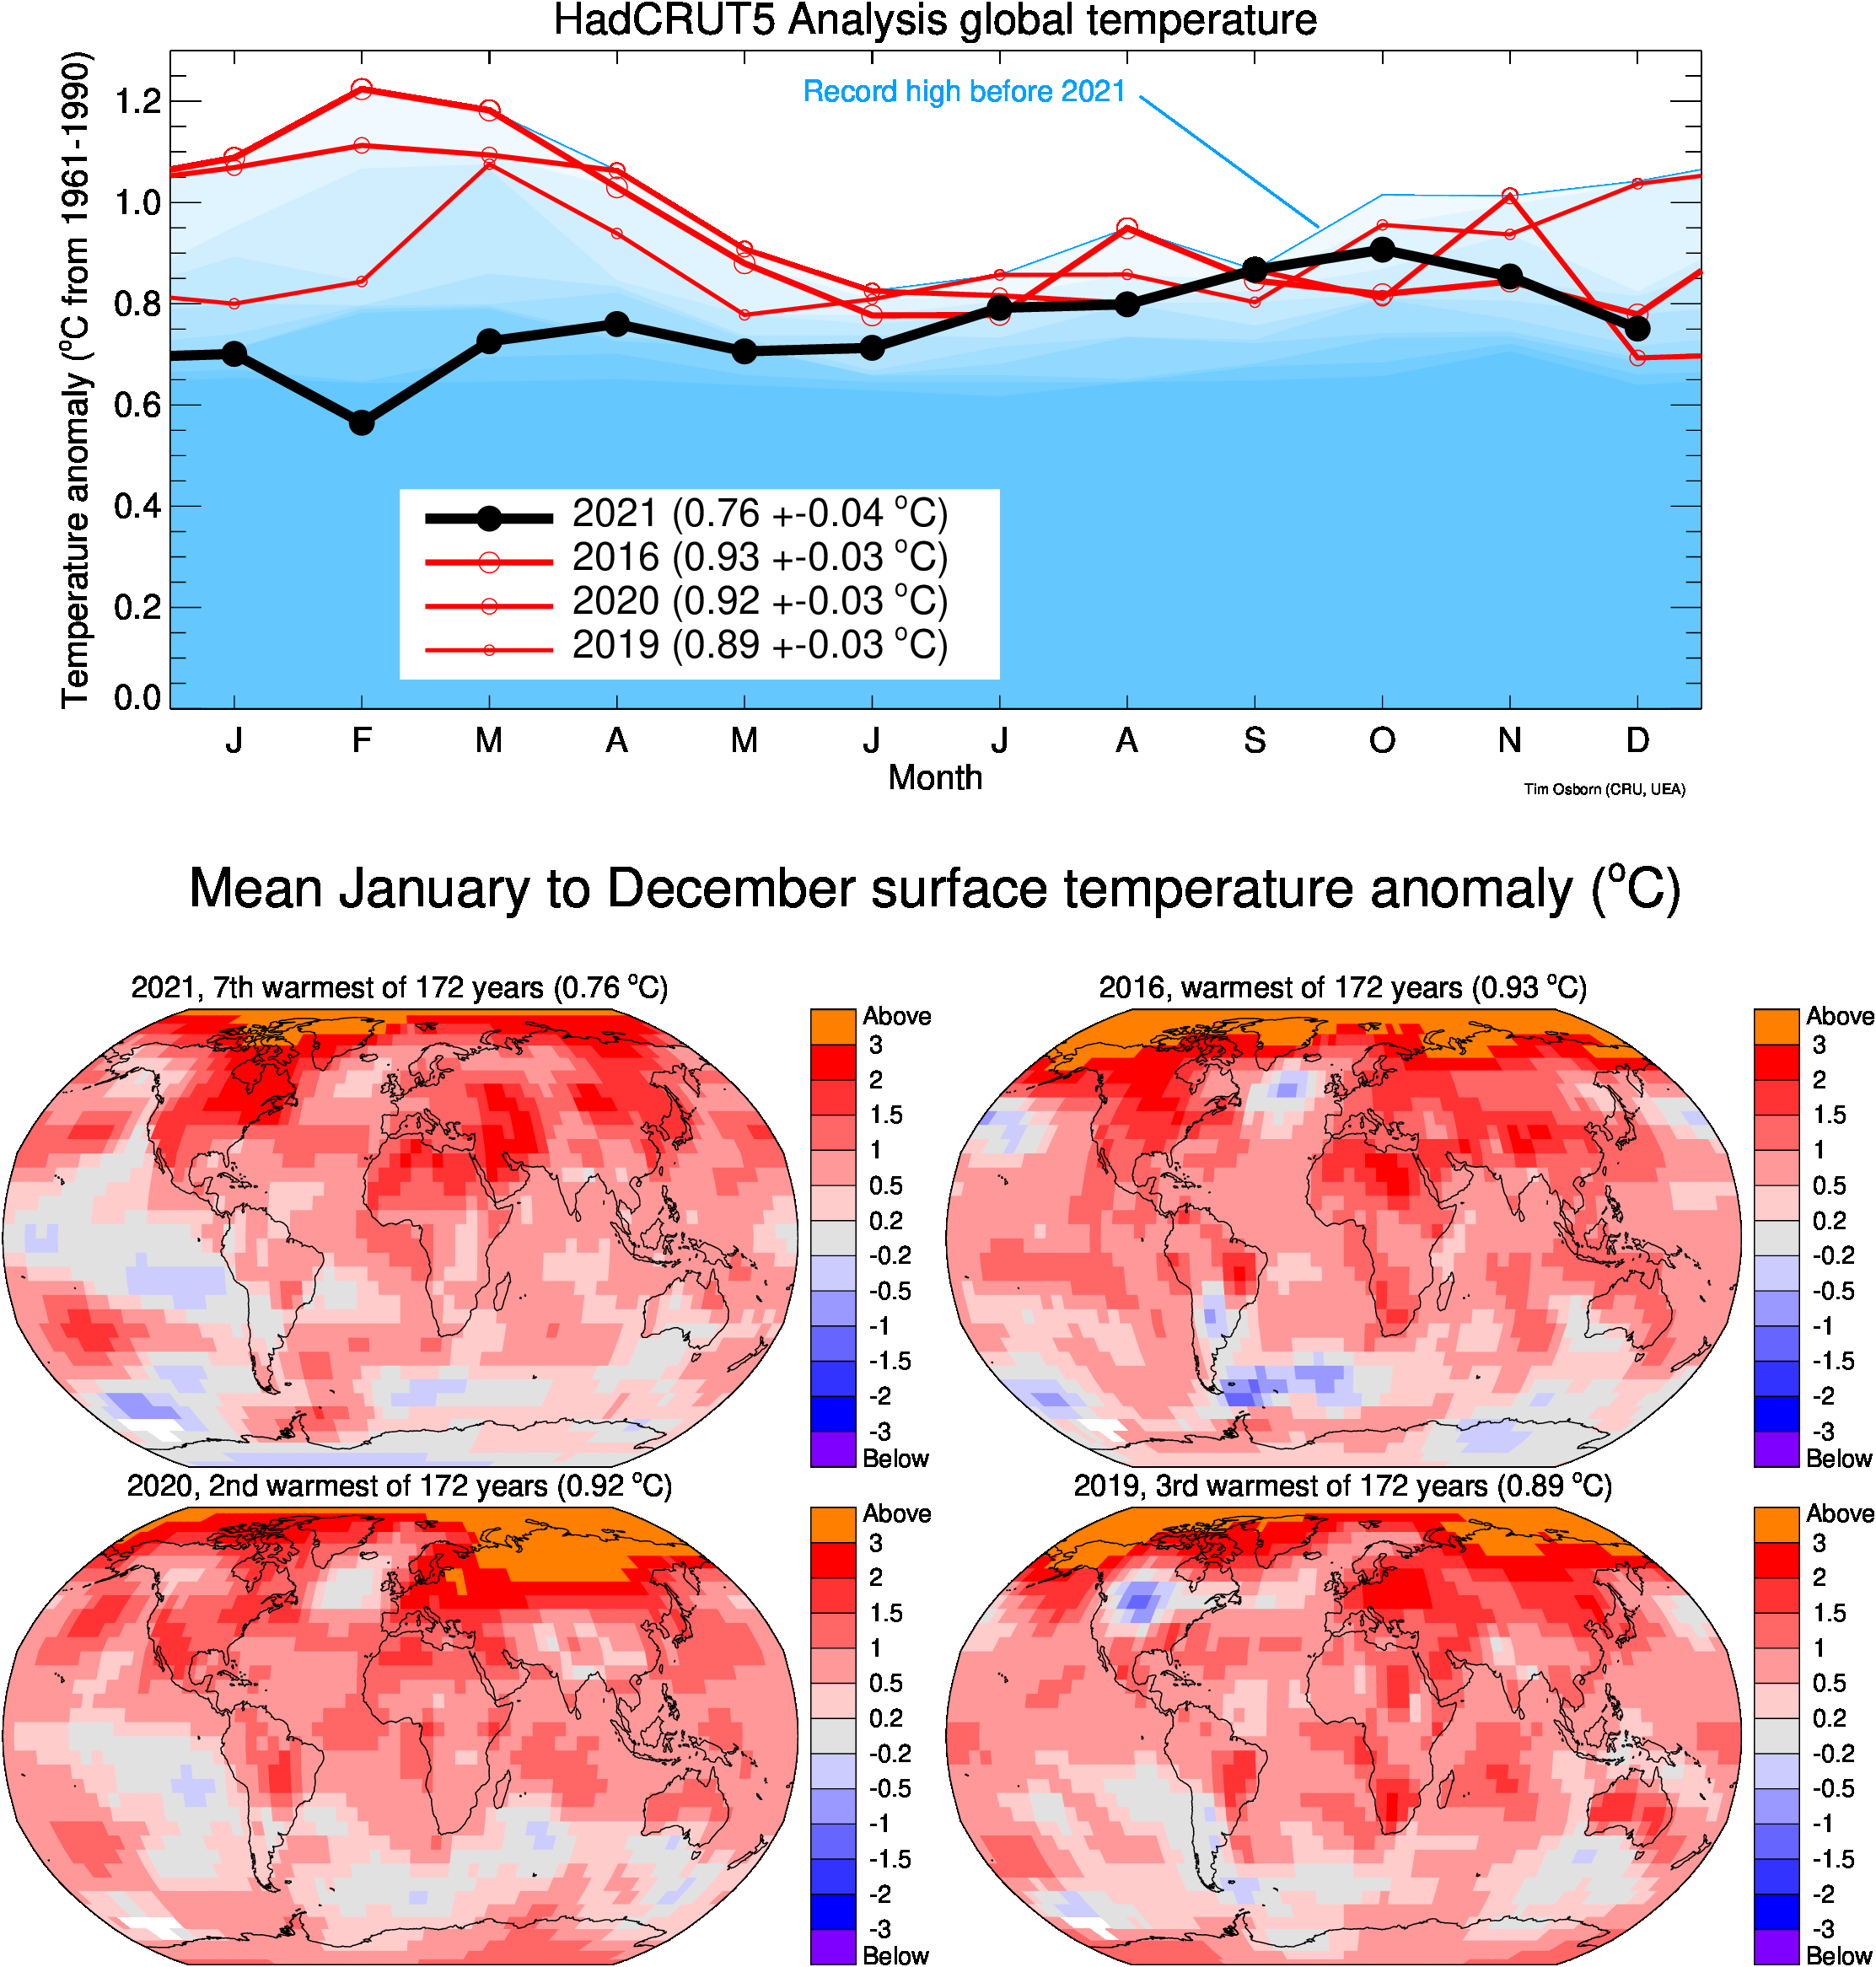
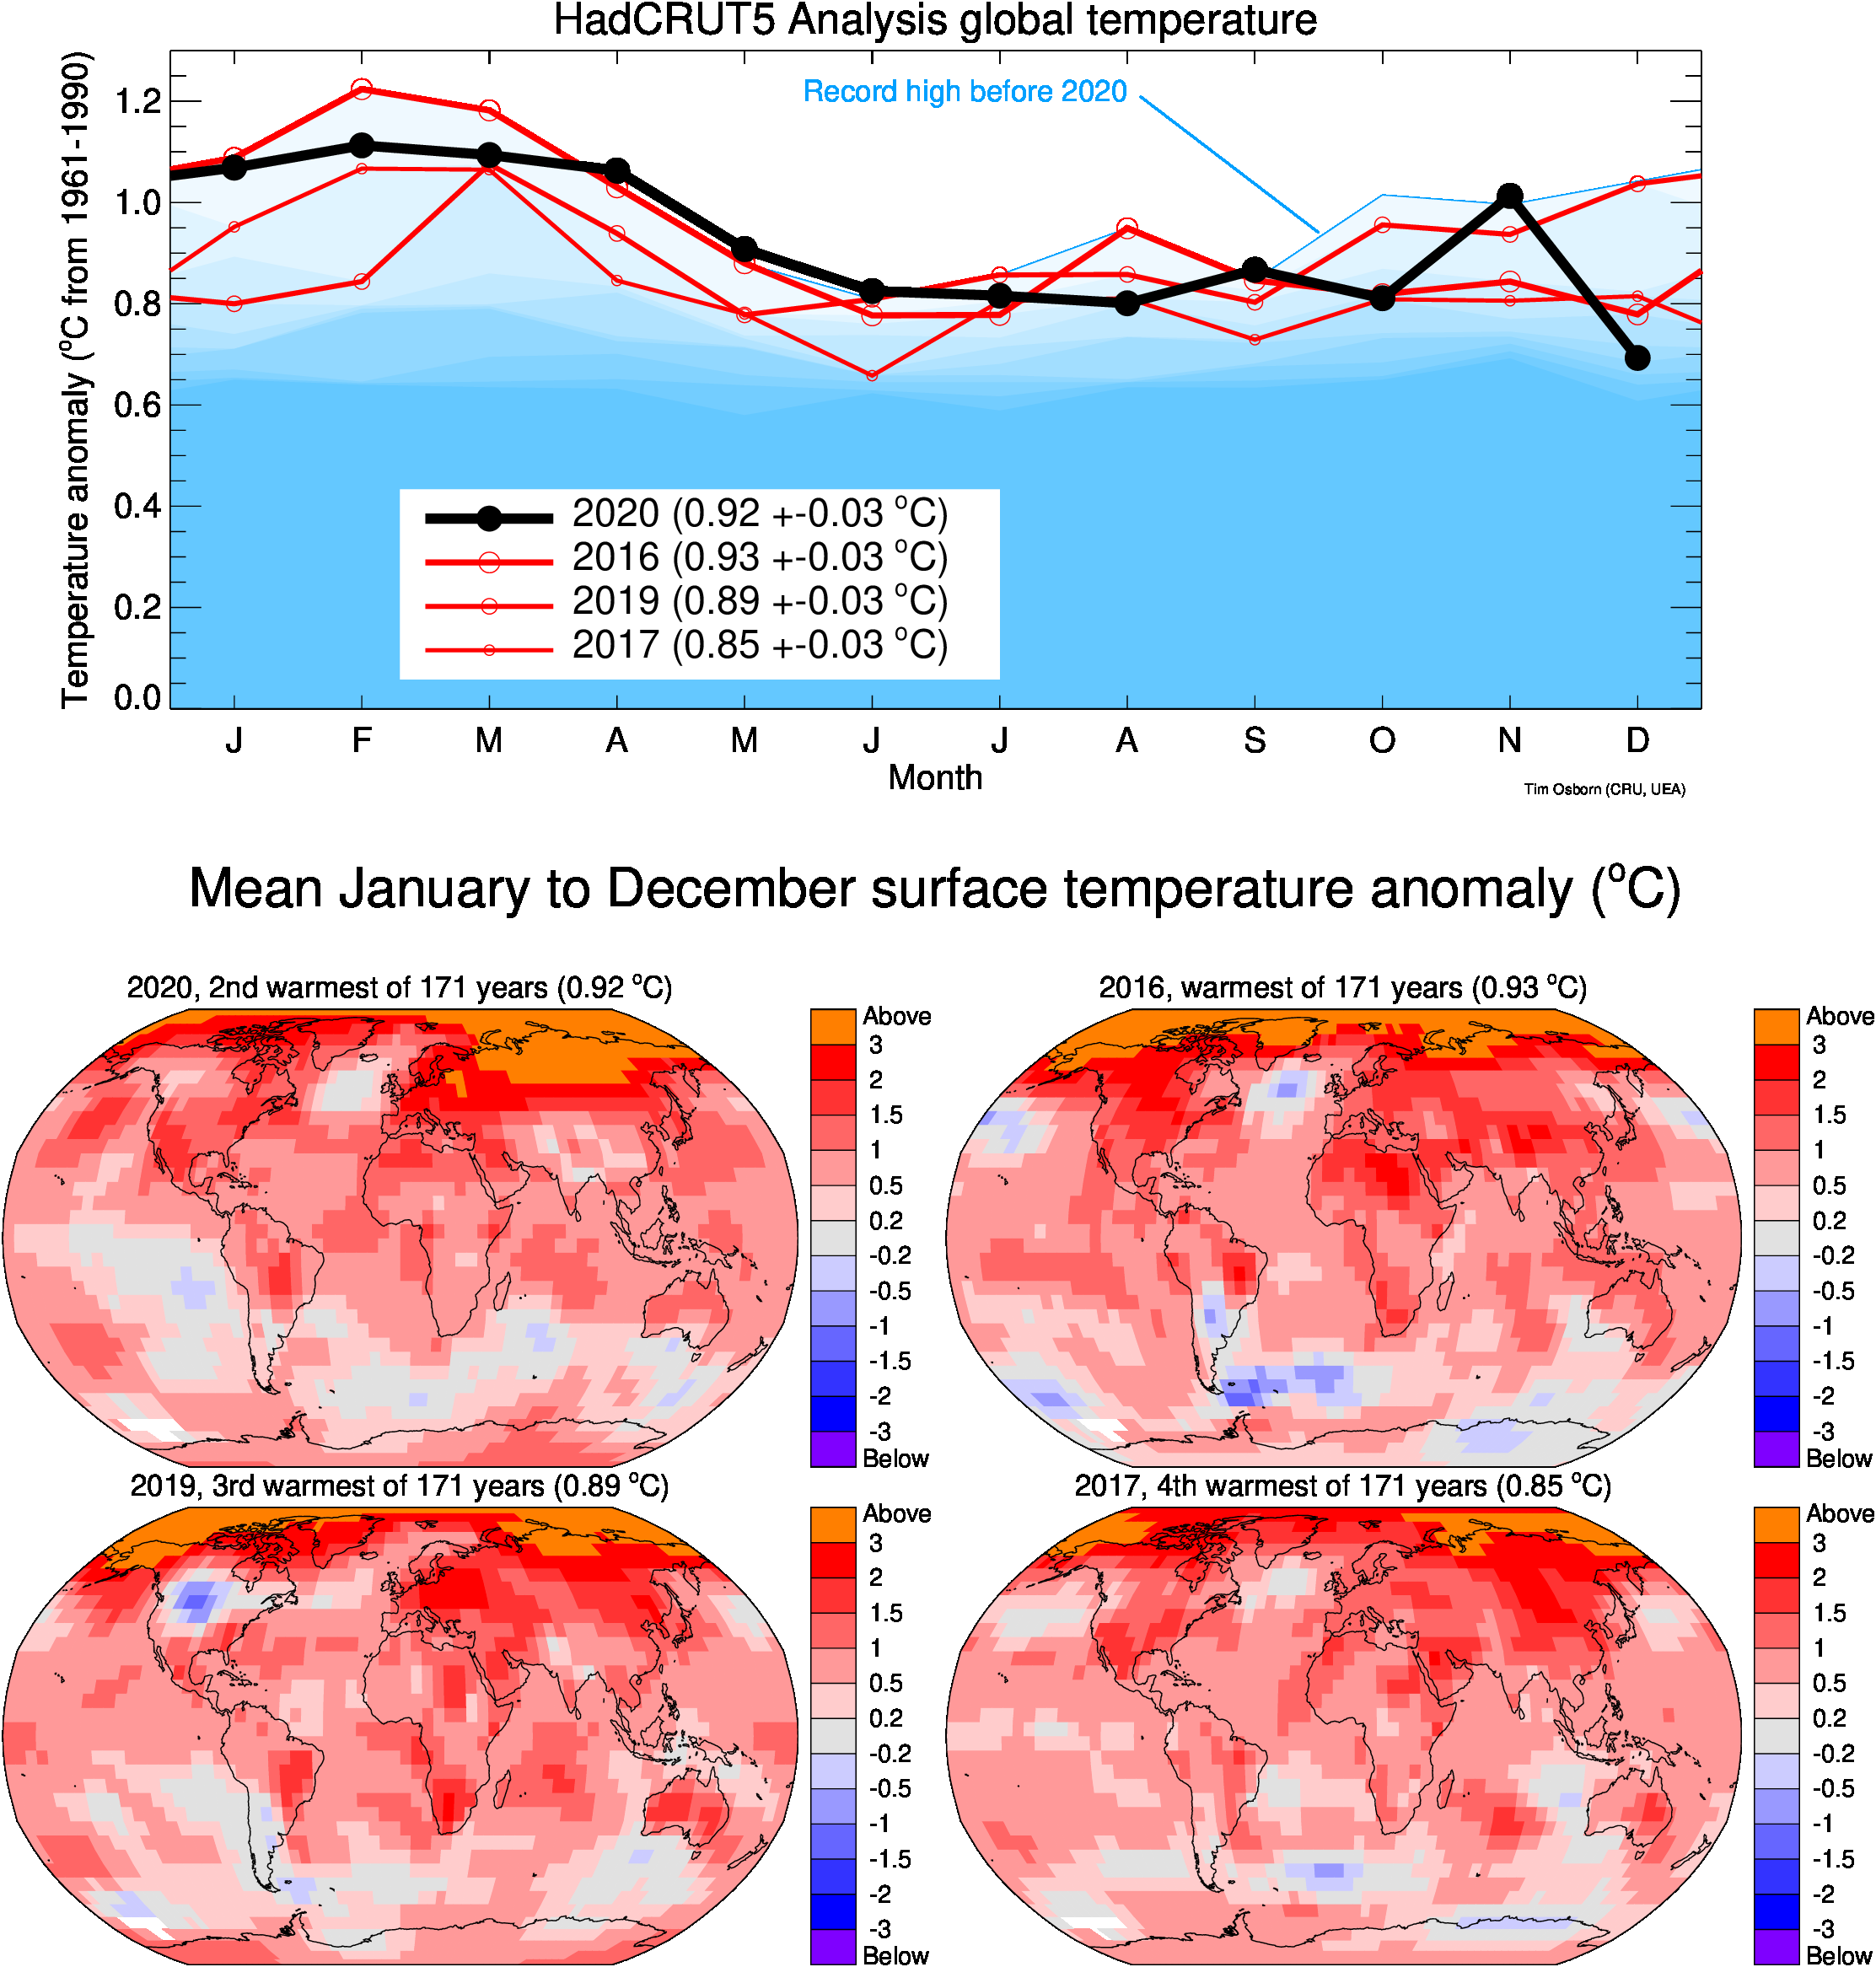
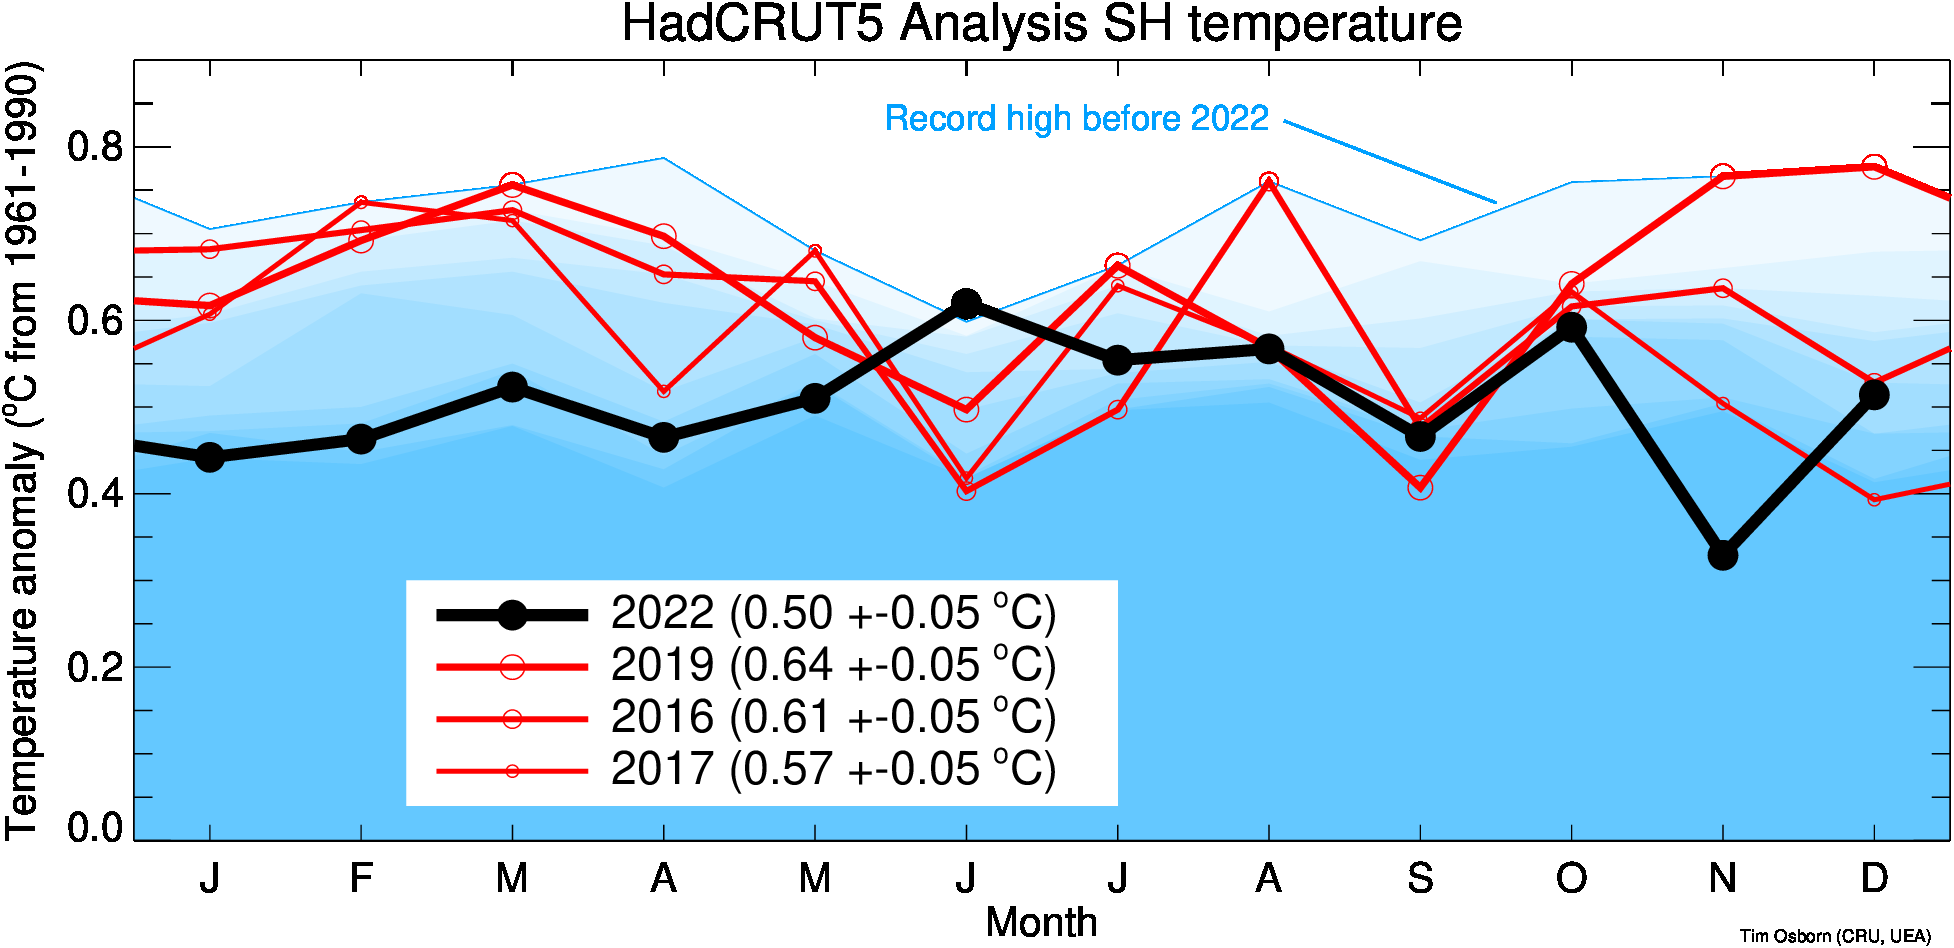
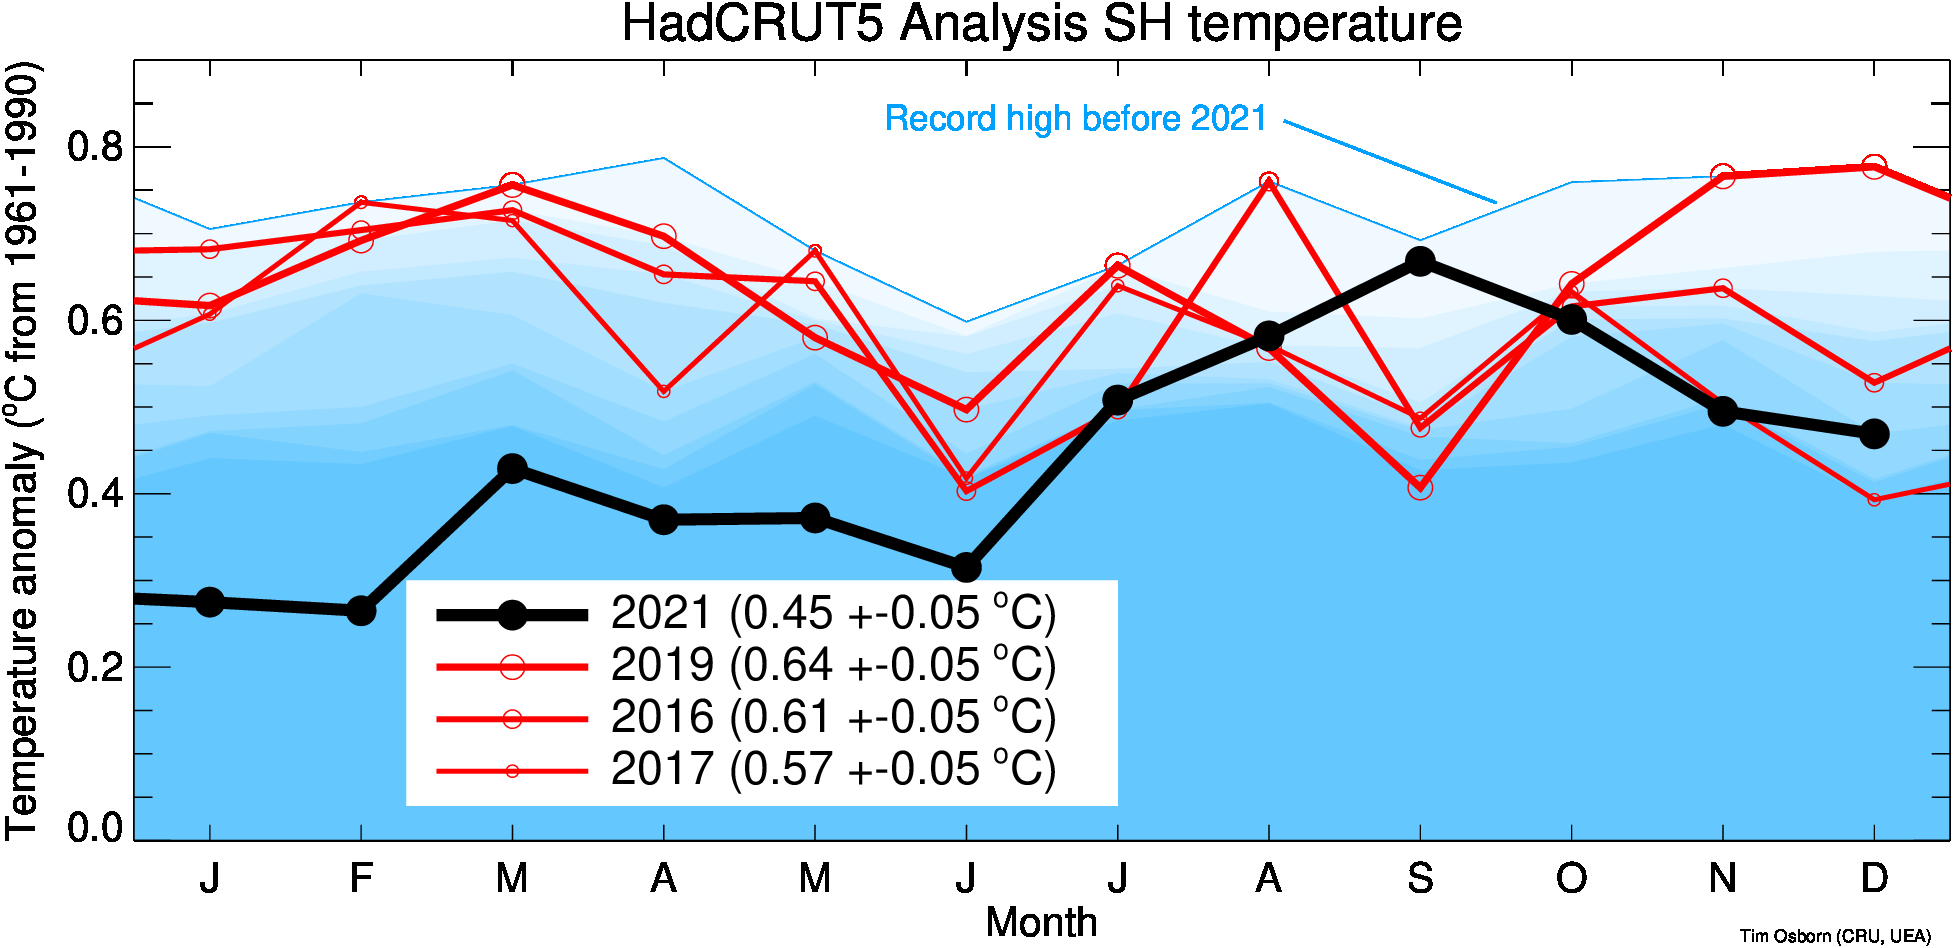
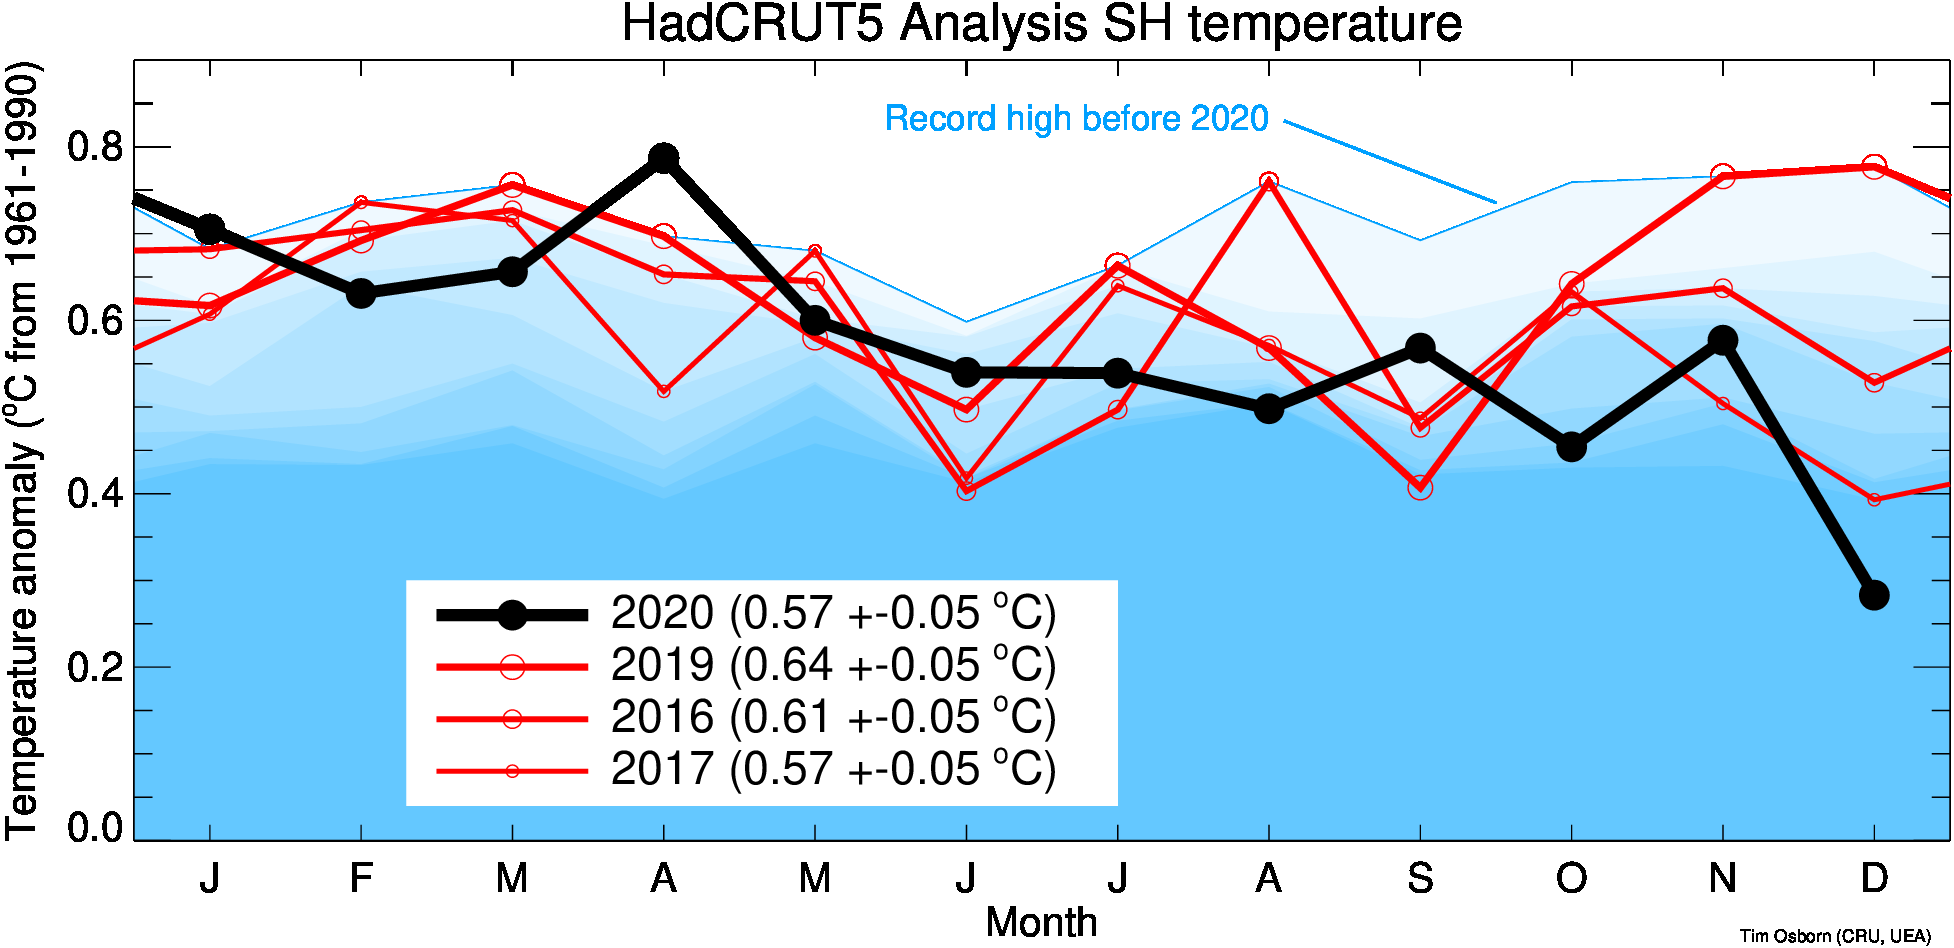
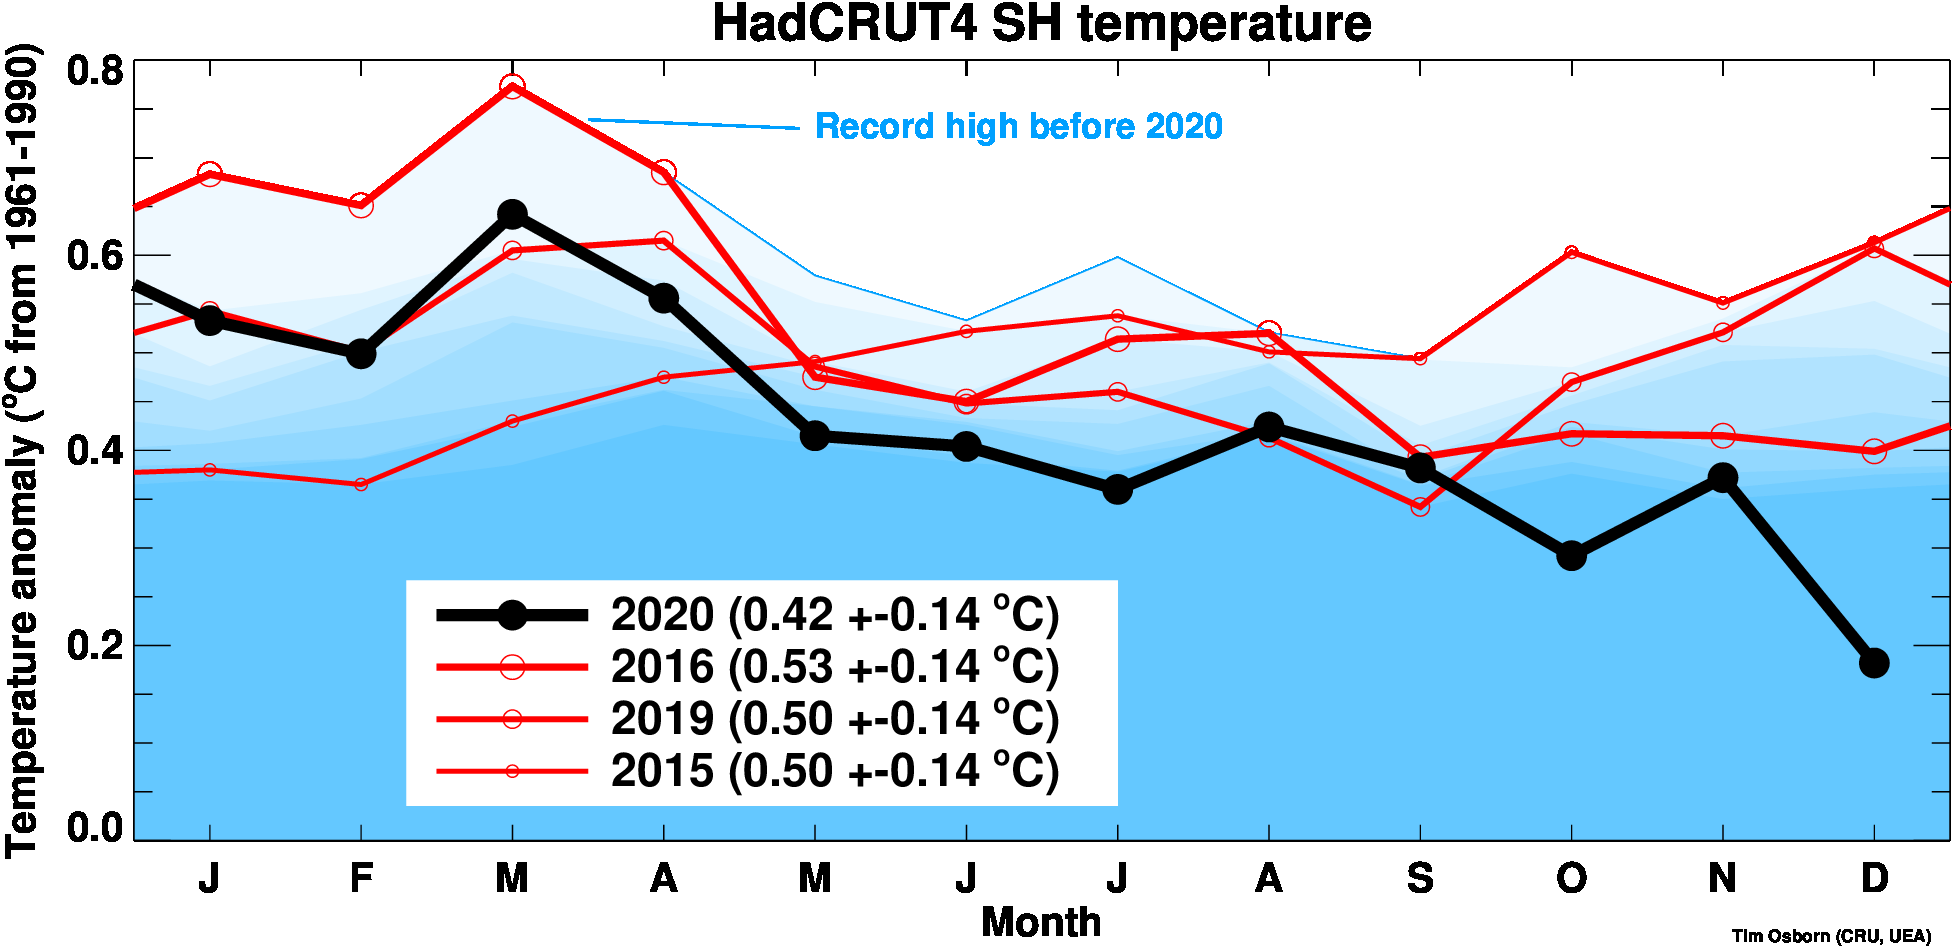
This page contains some visualisations of global and hemispheric temperatures. The temperature dataset used is our HadCRUT5 data (land and marine), or our CRUTEM5 data (land only).
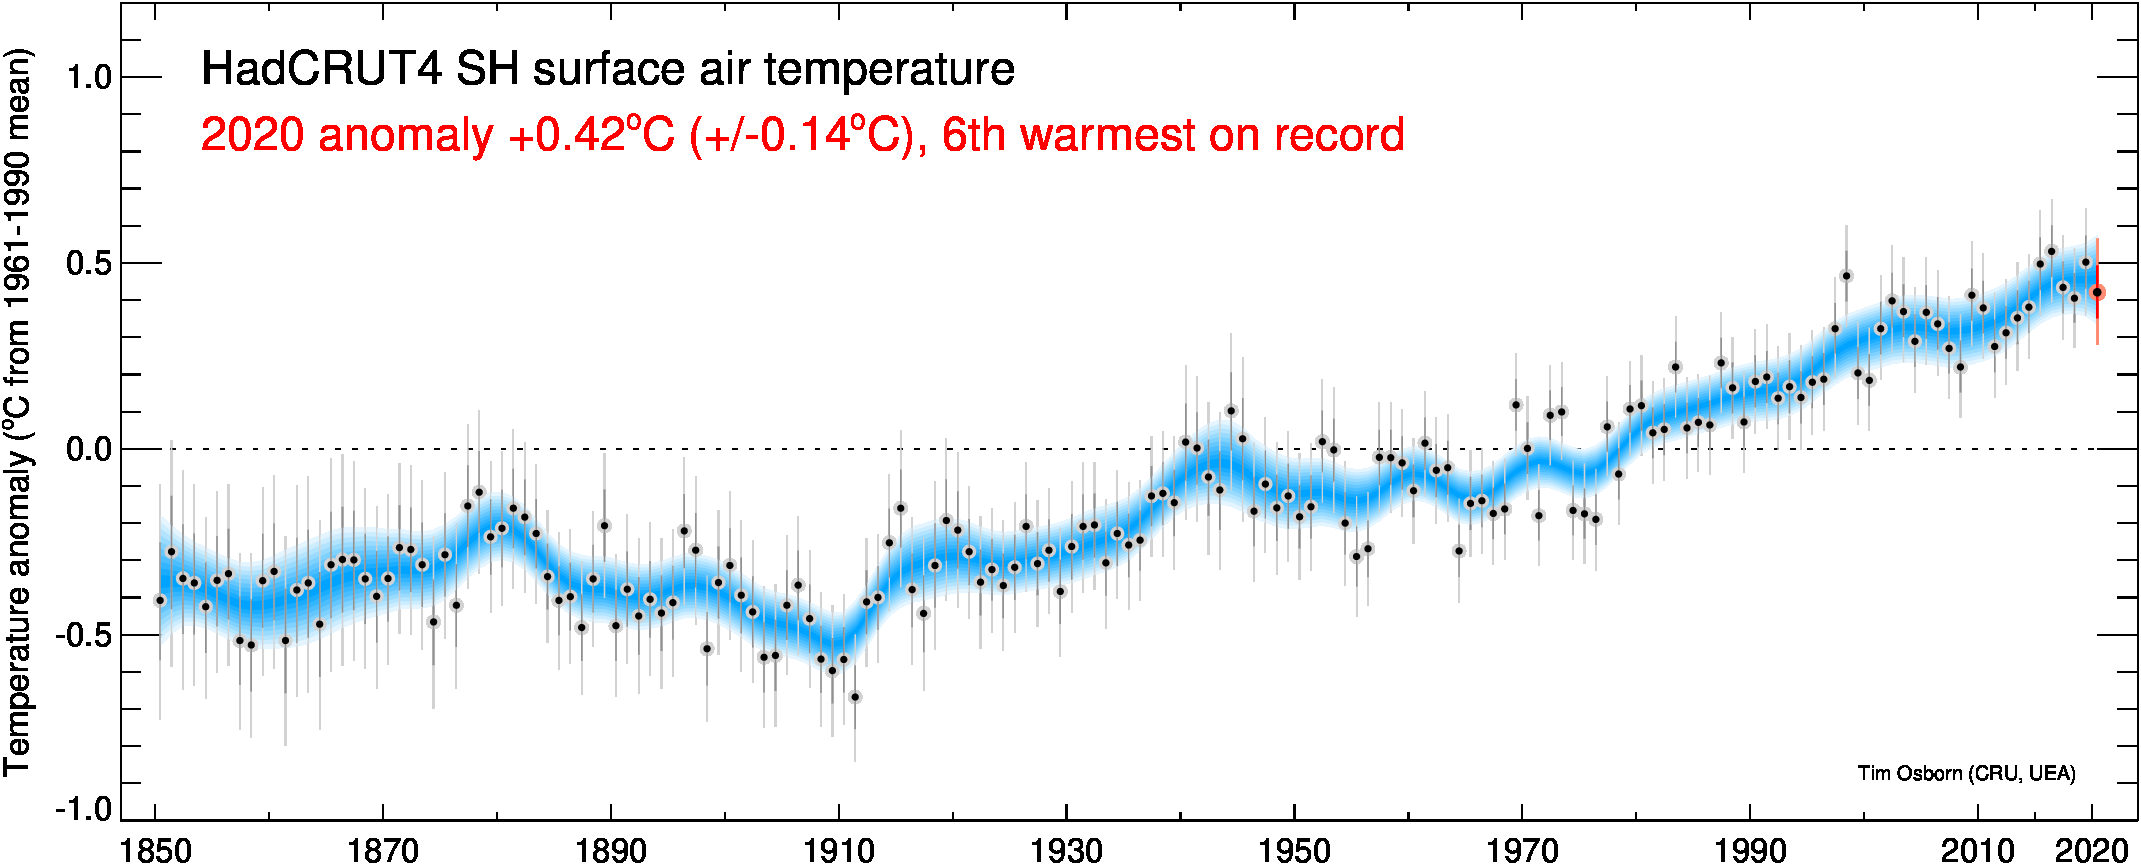
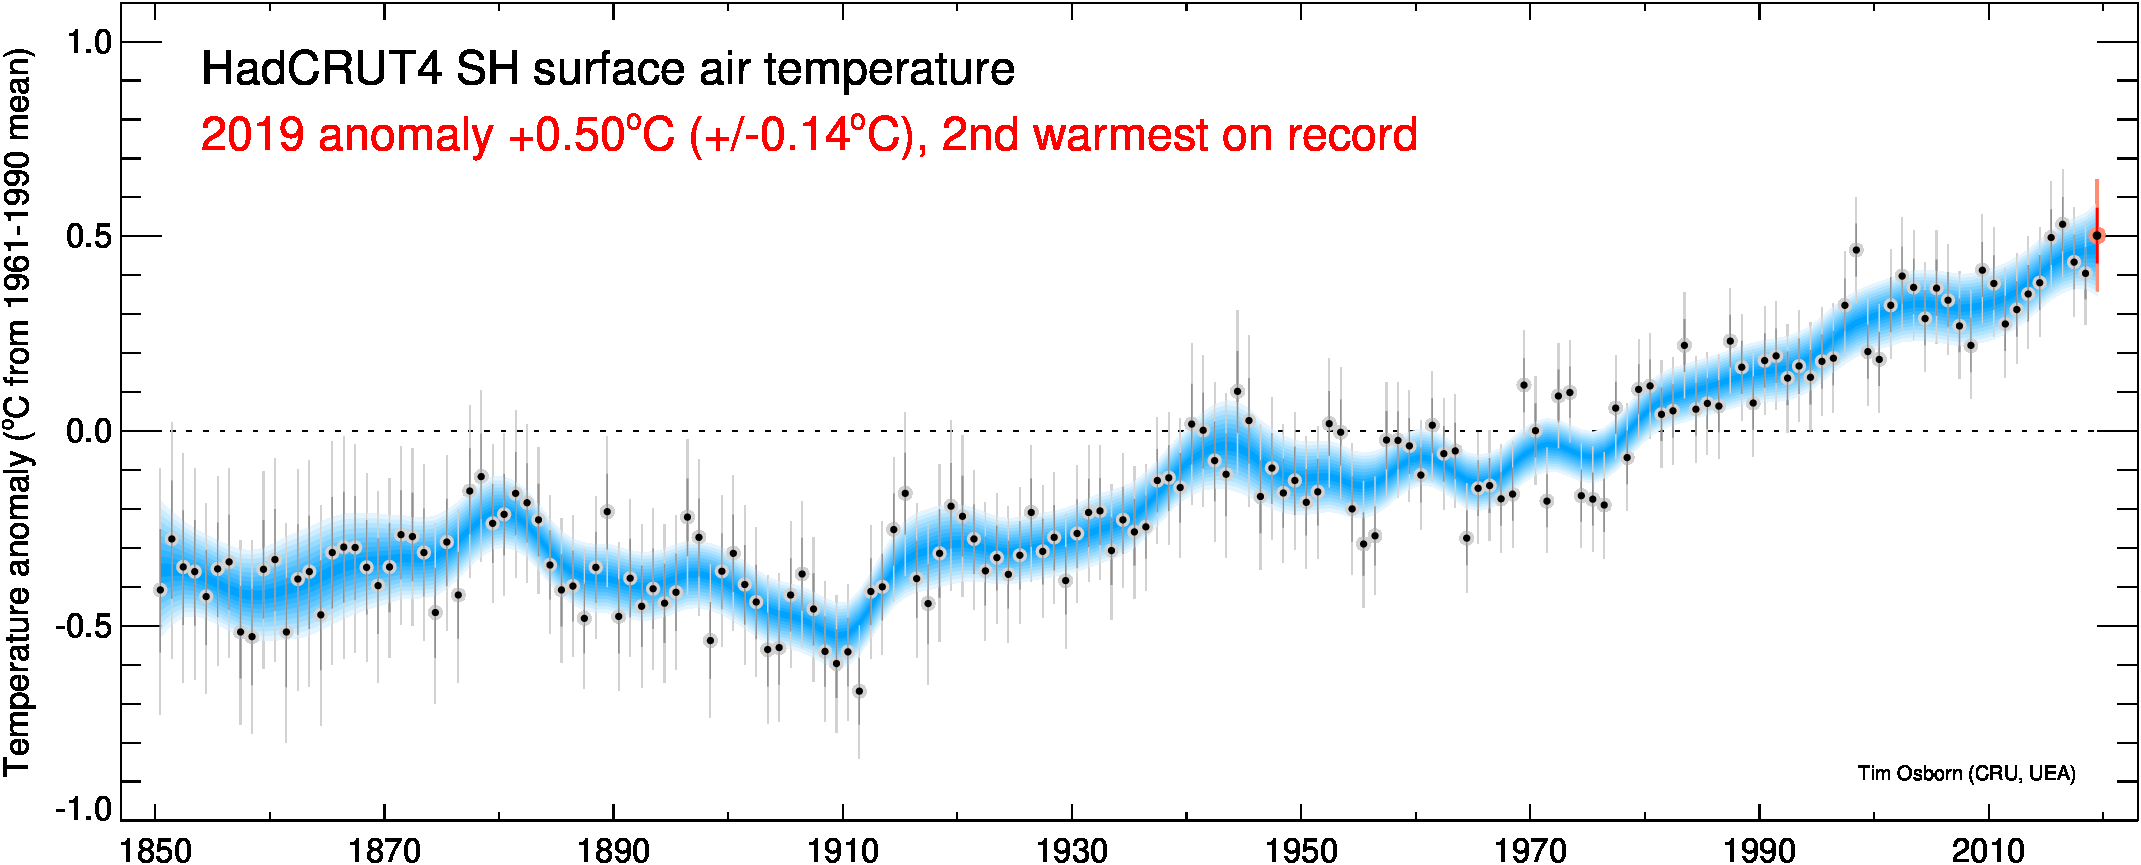
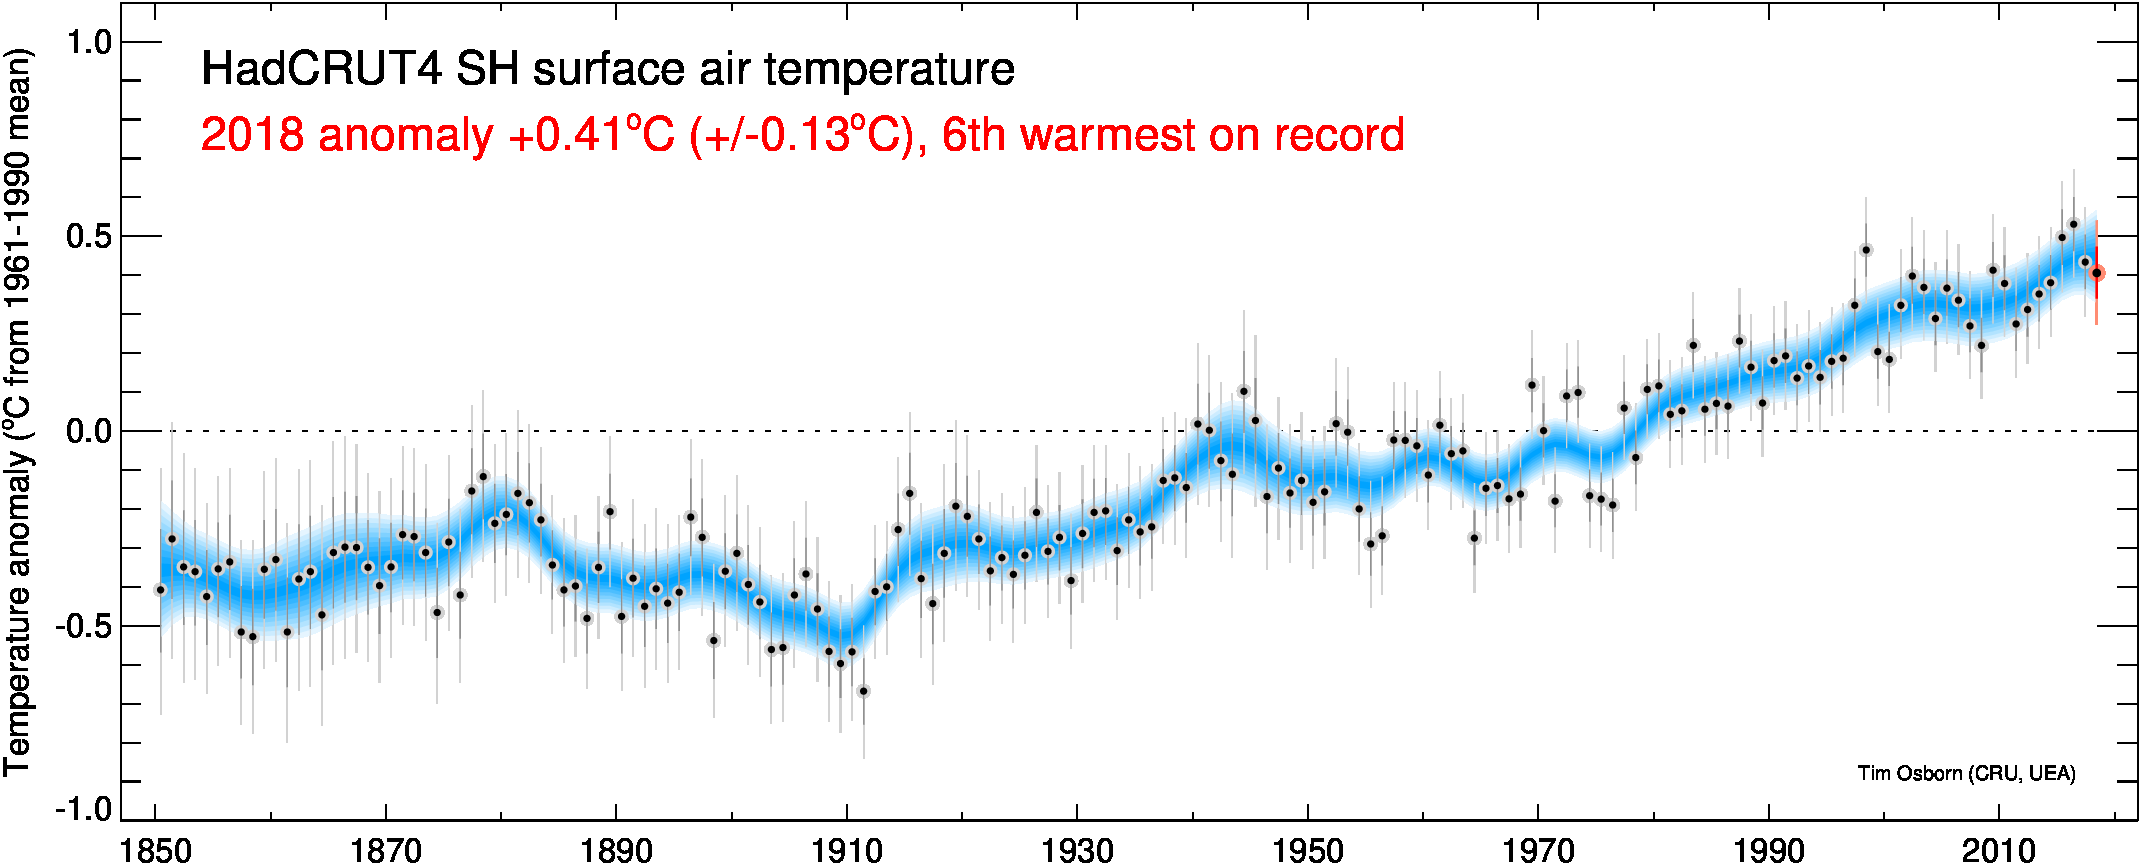
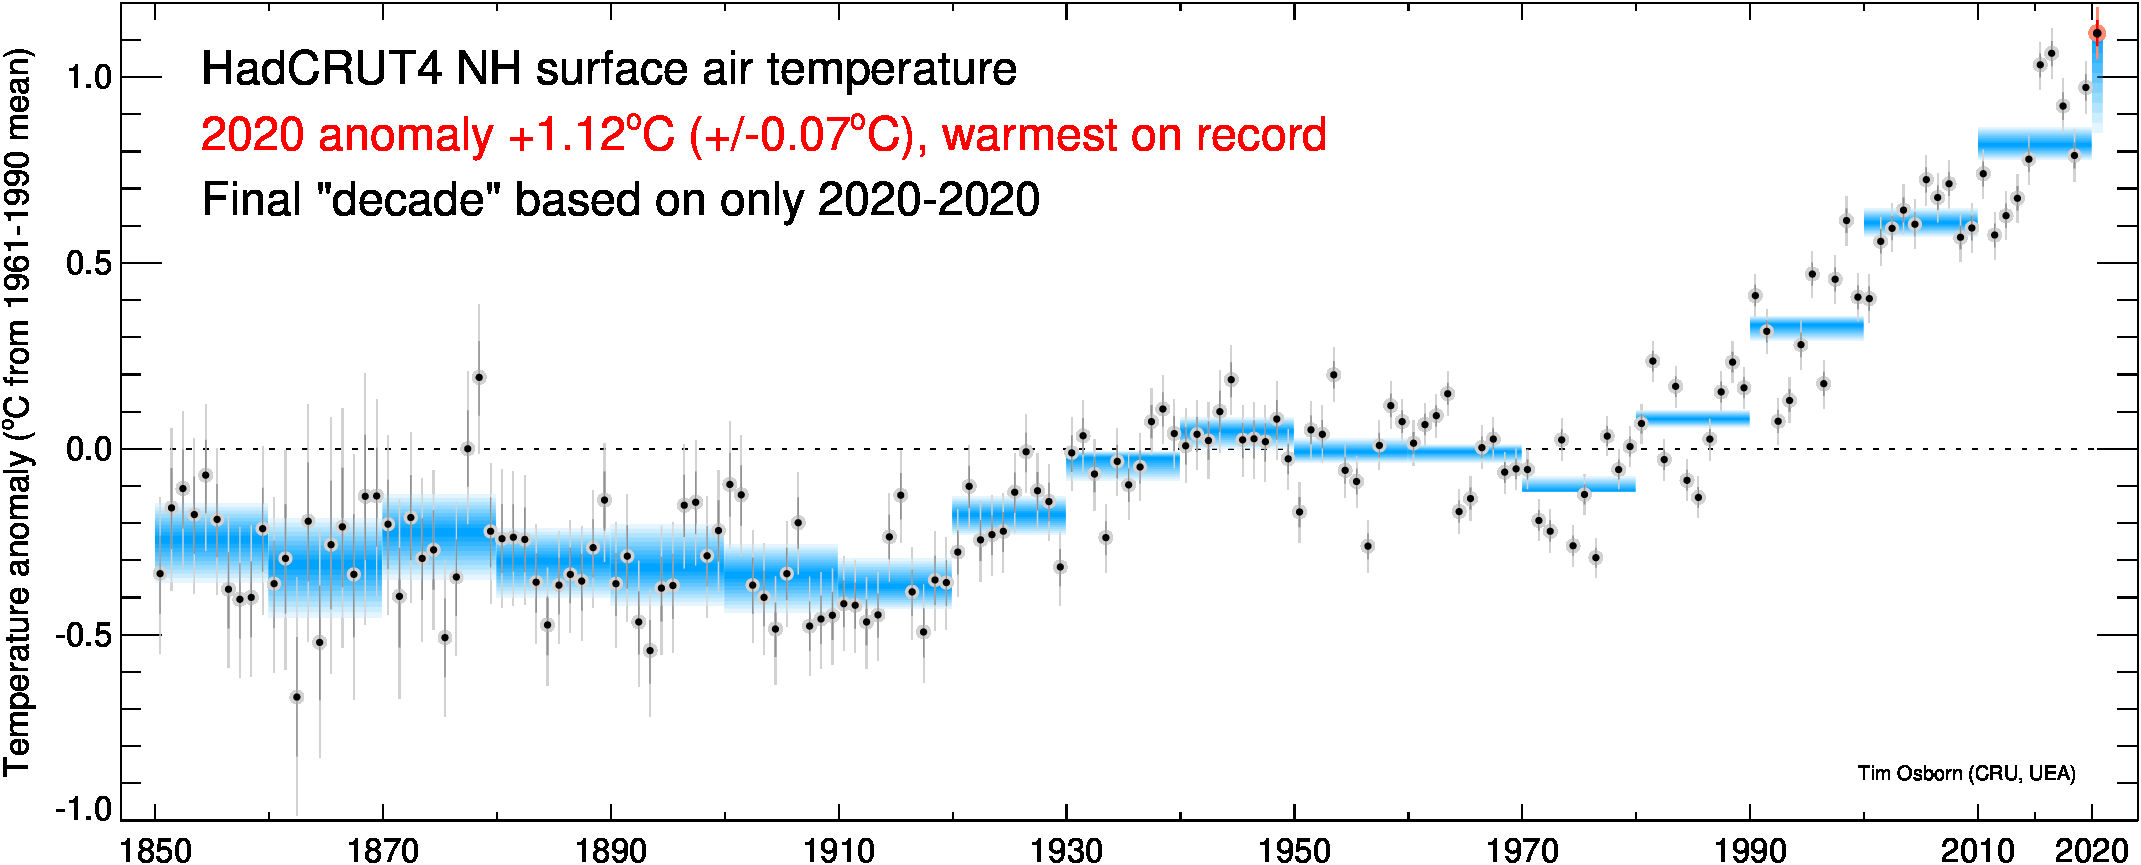
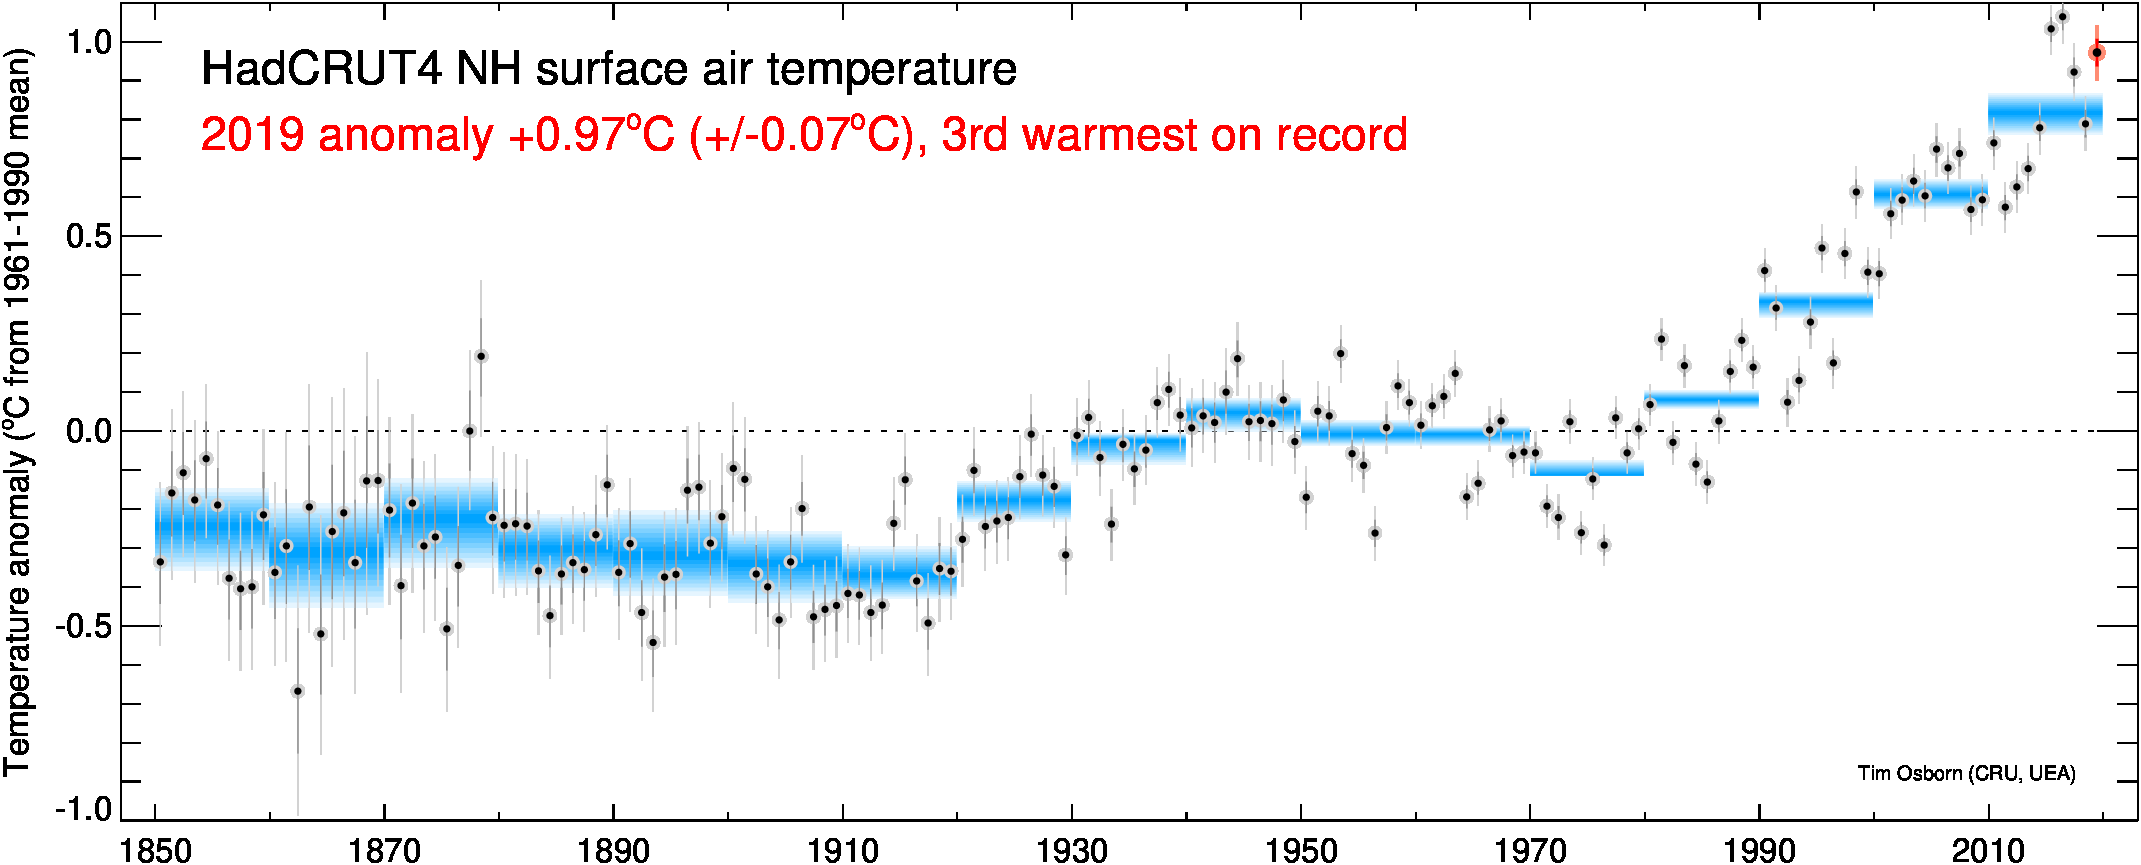
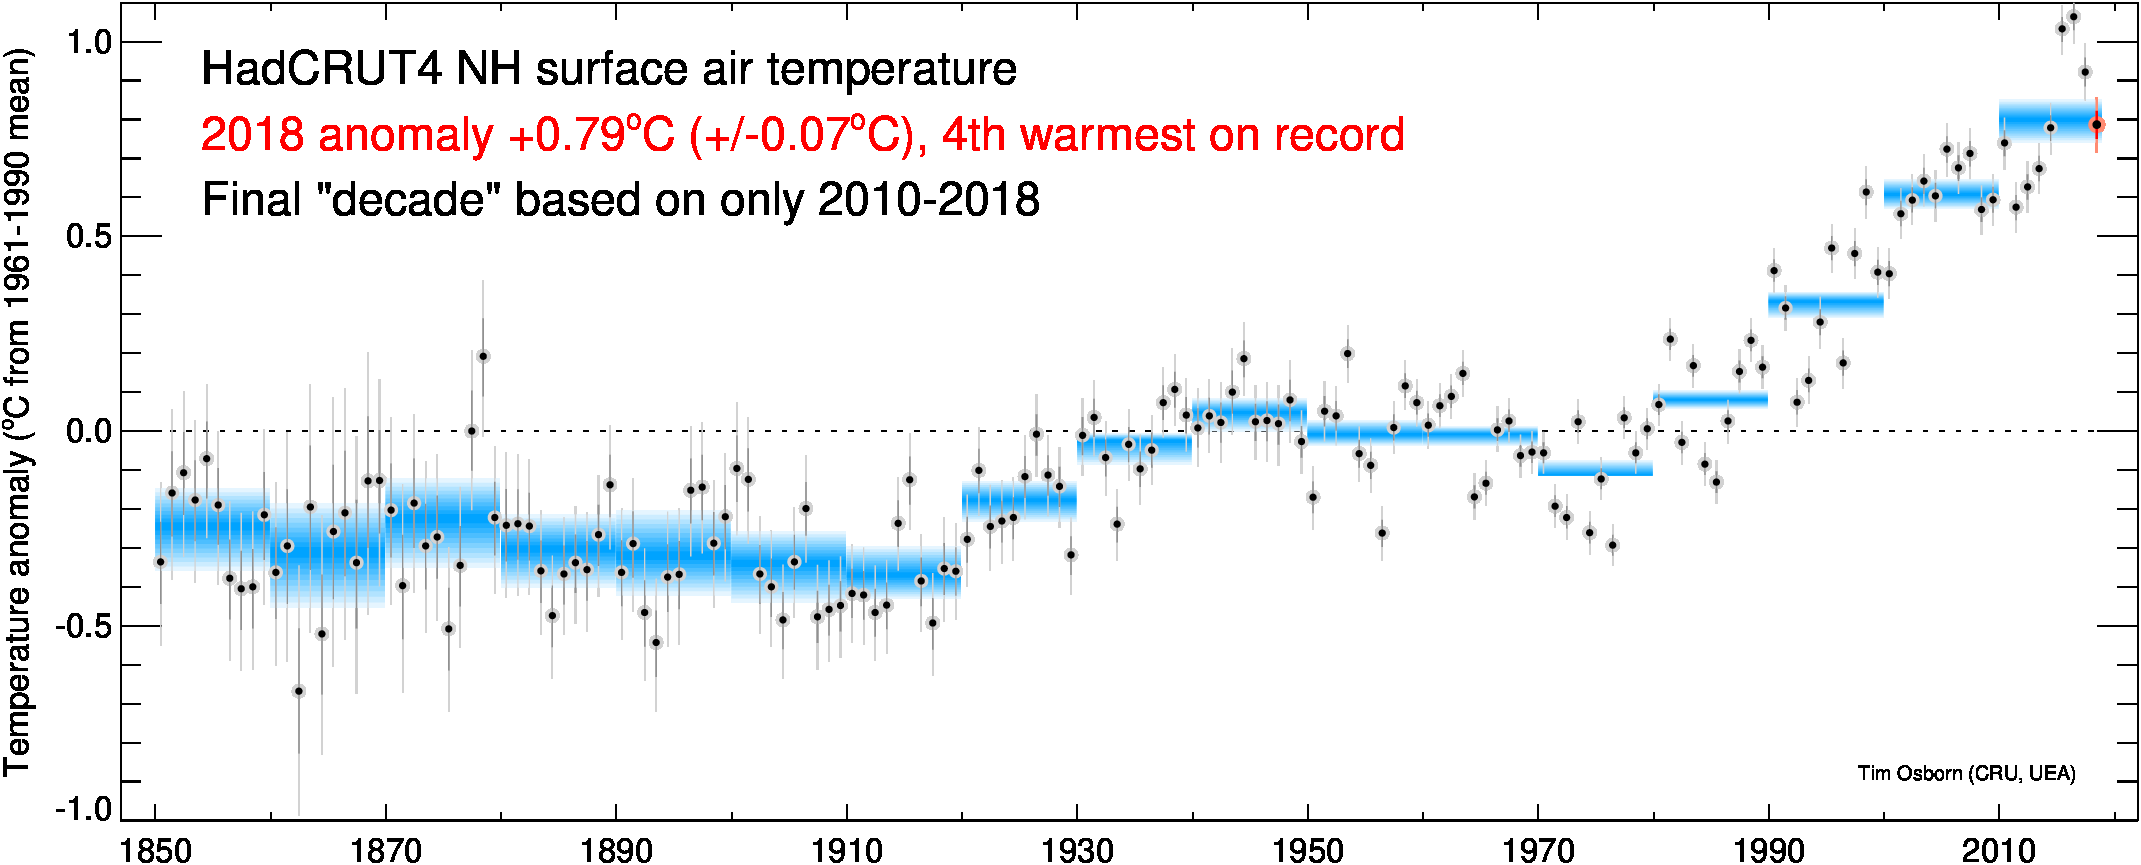
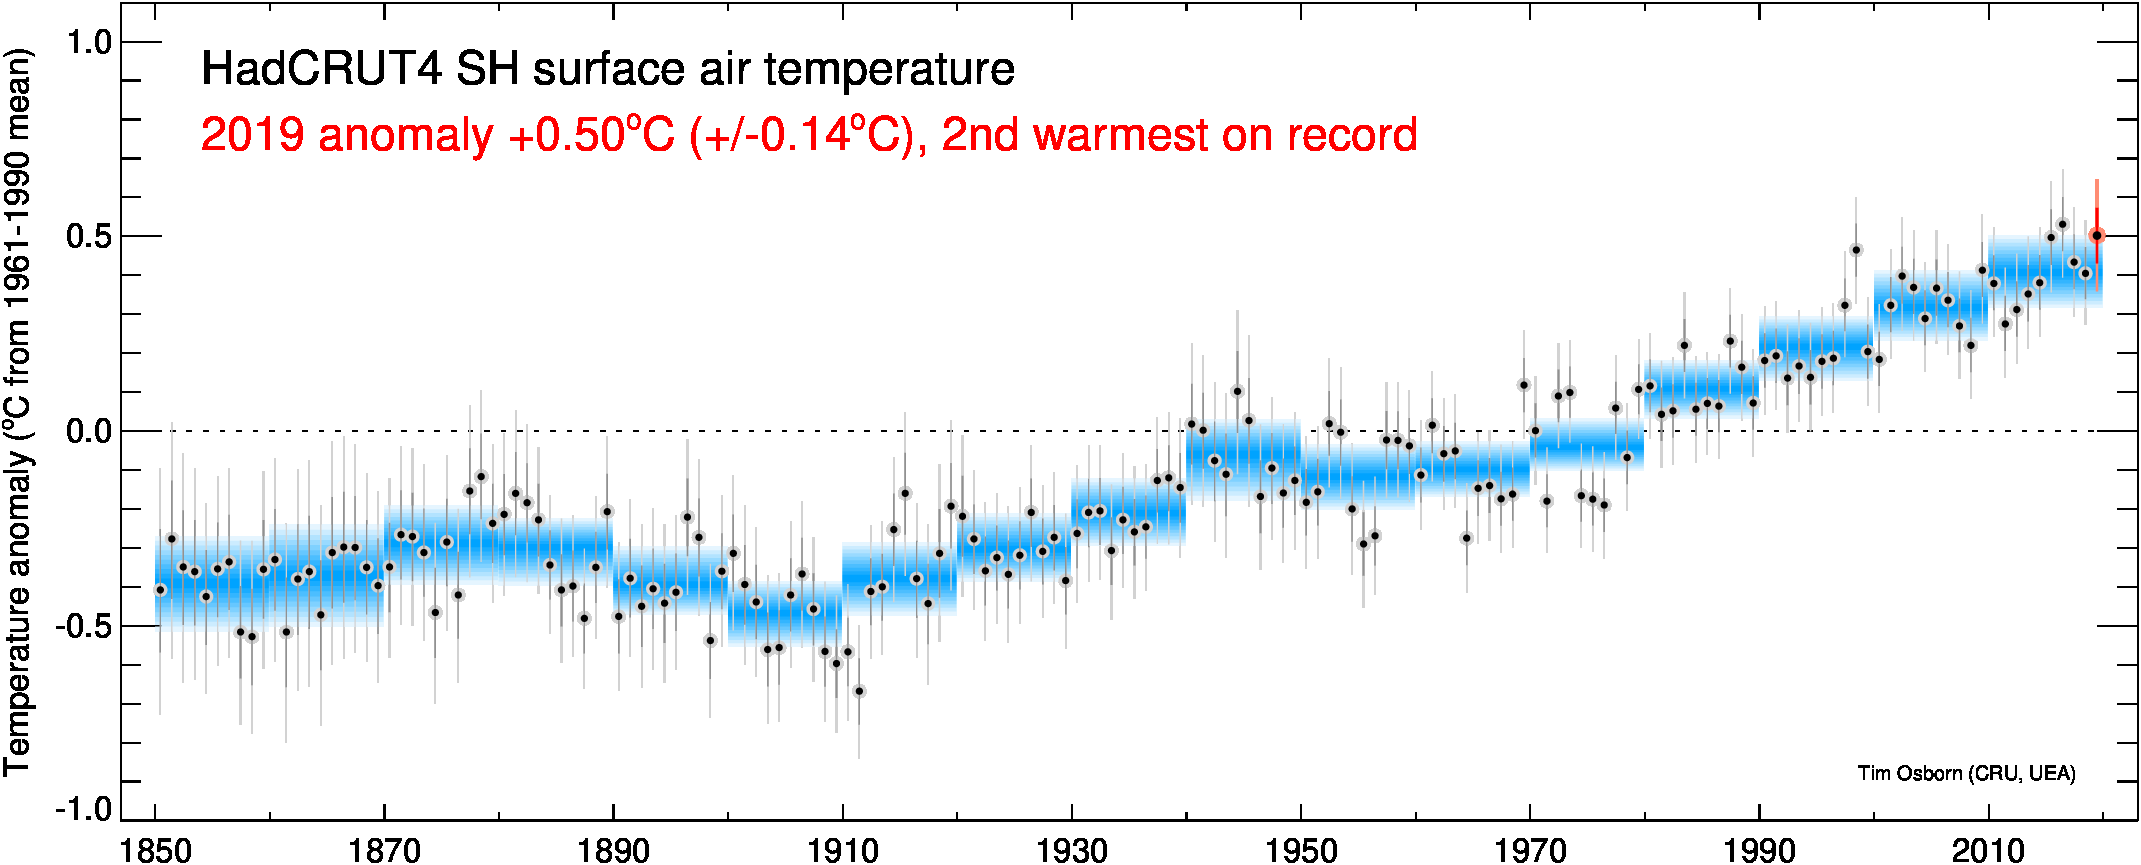
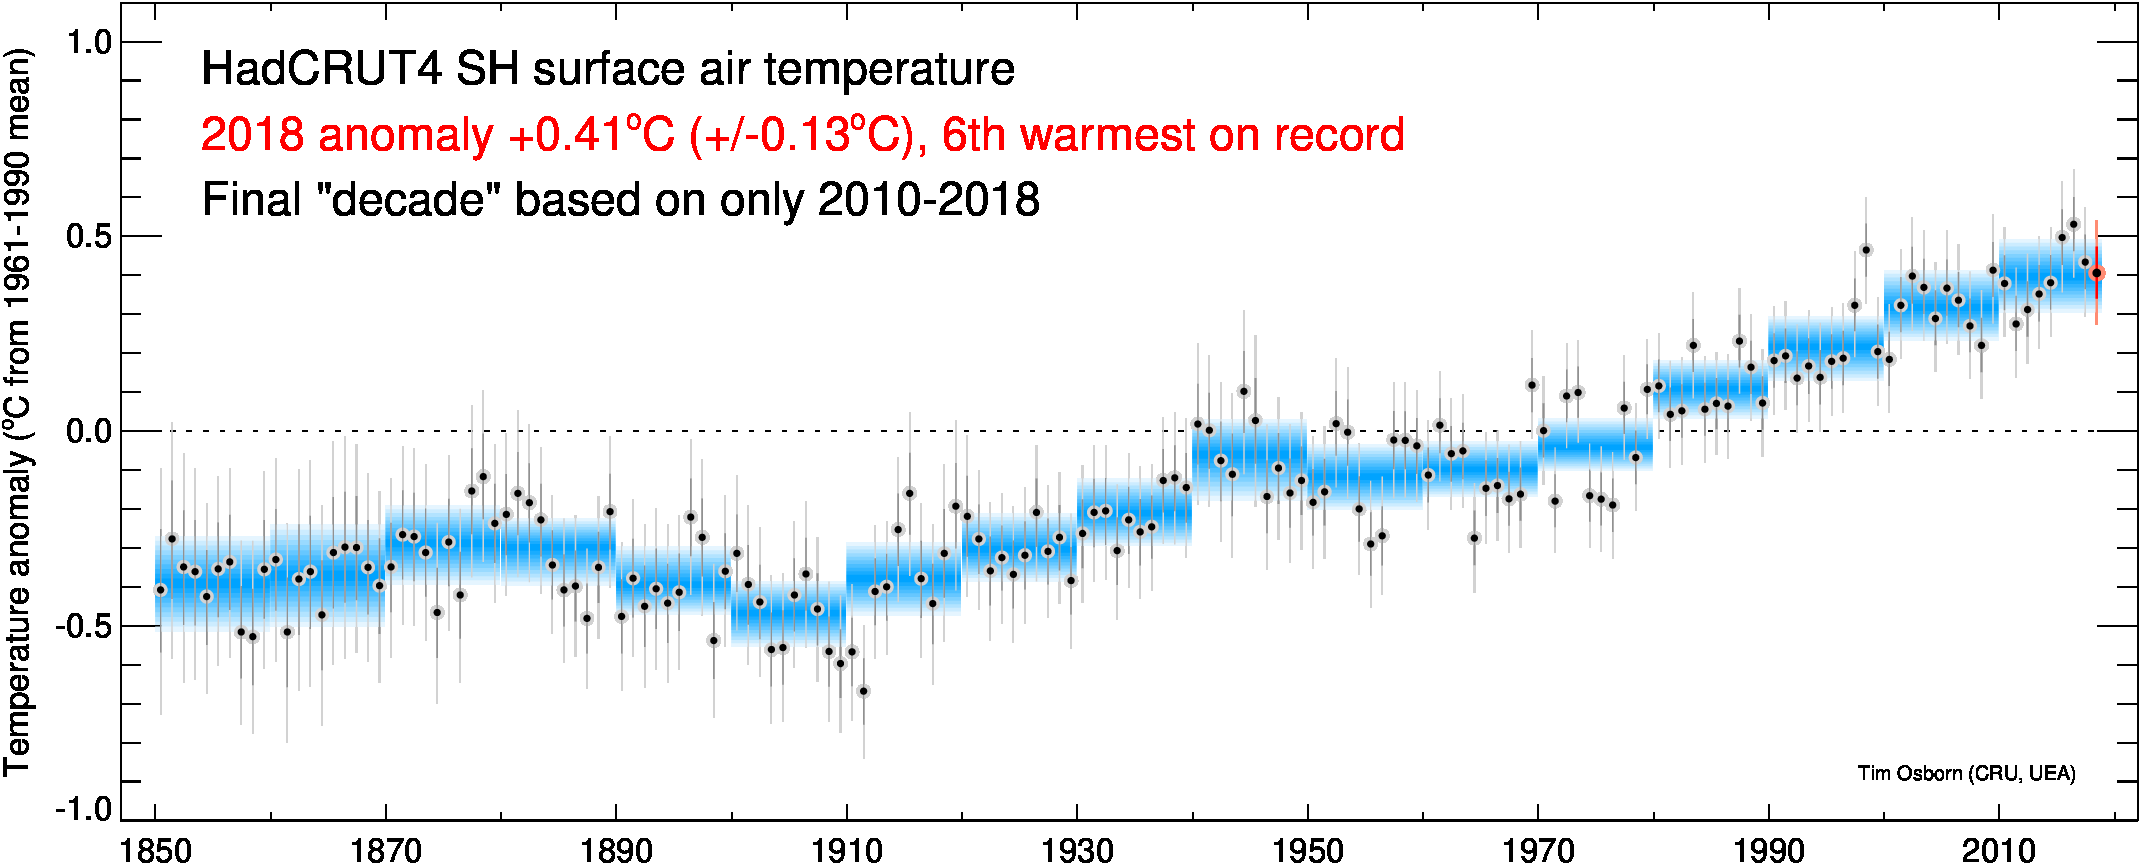
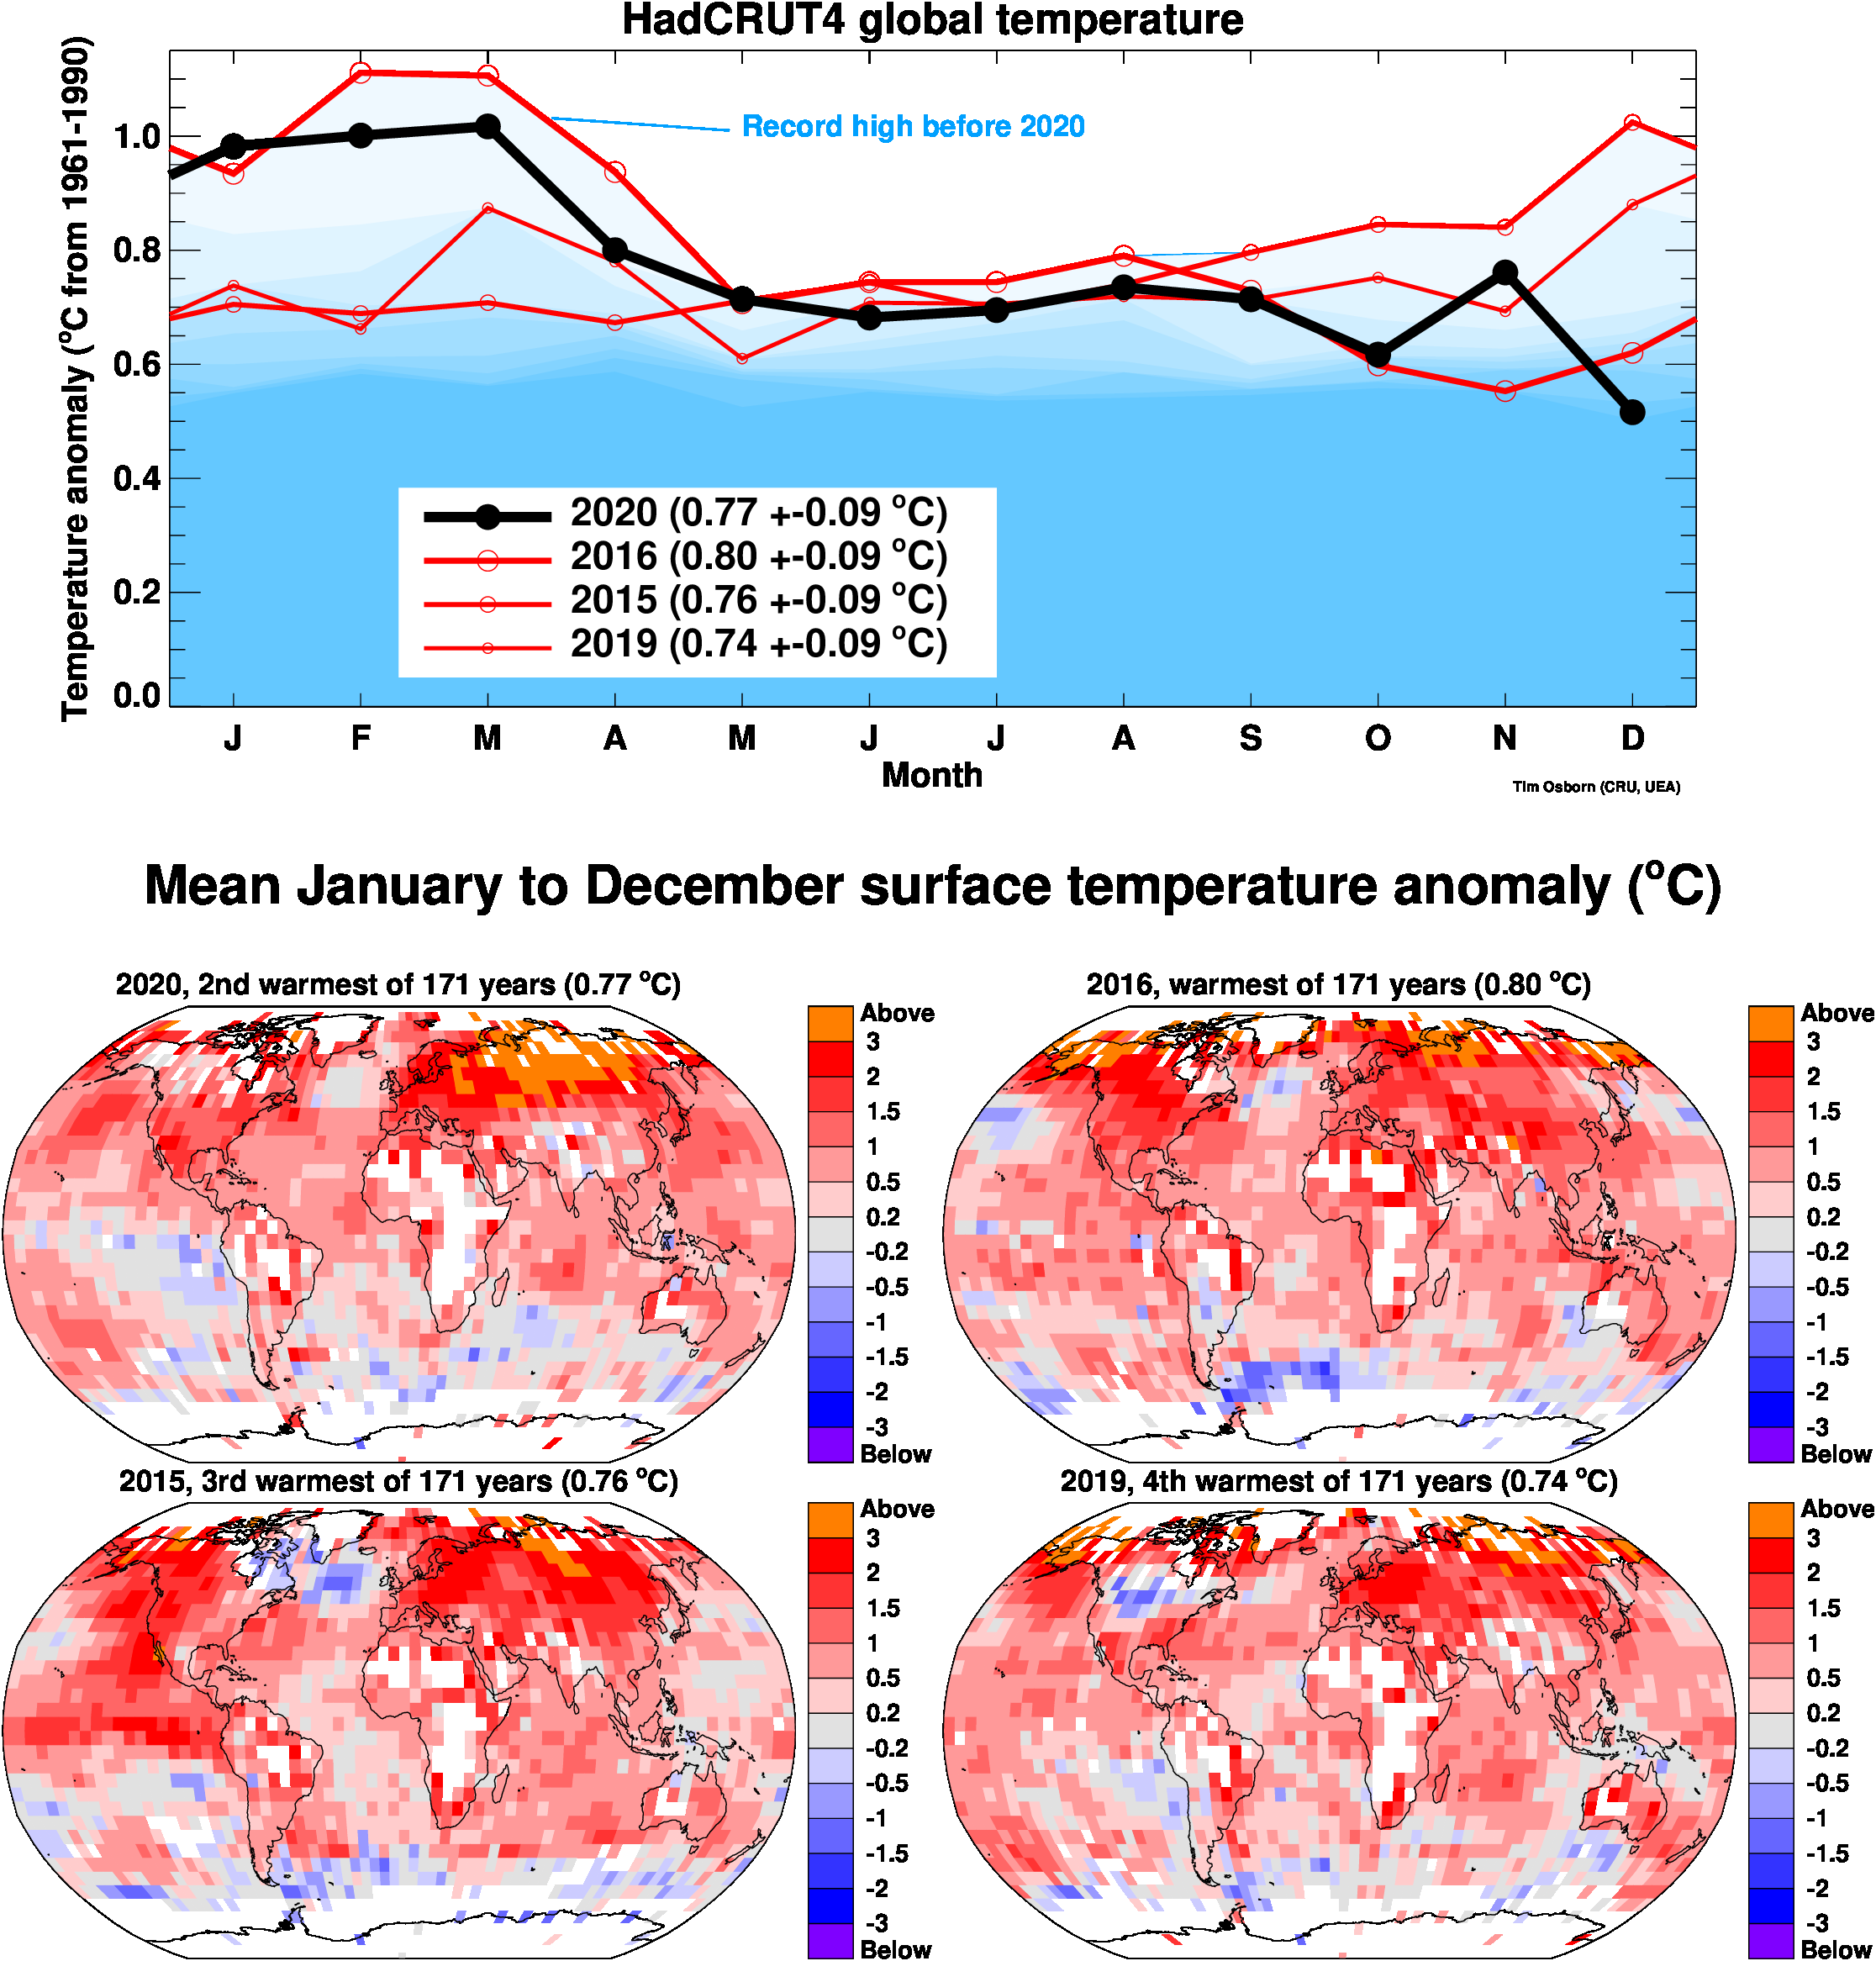
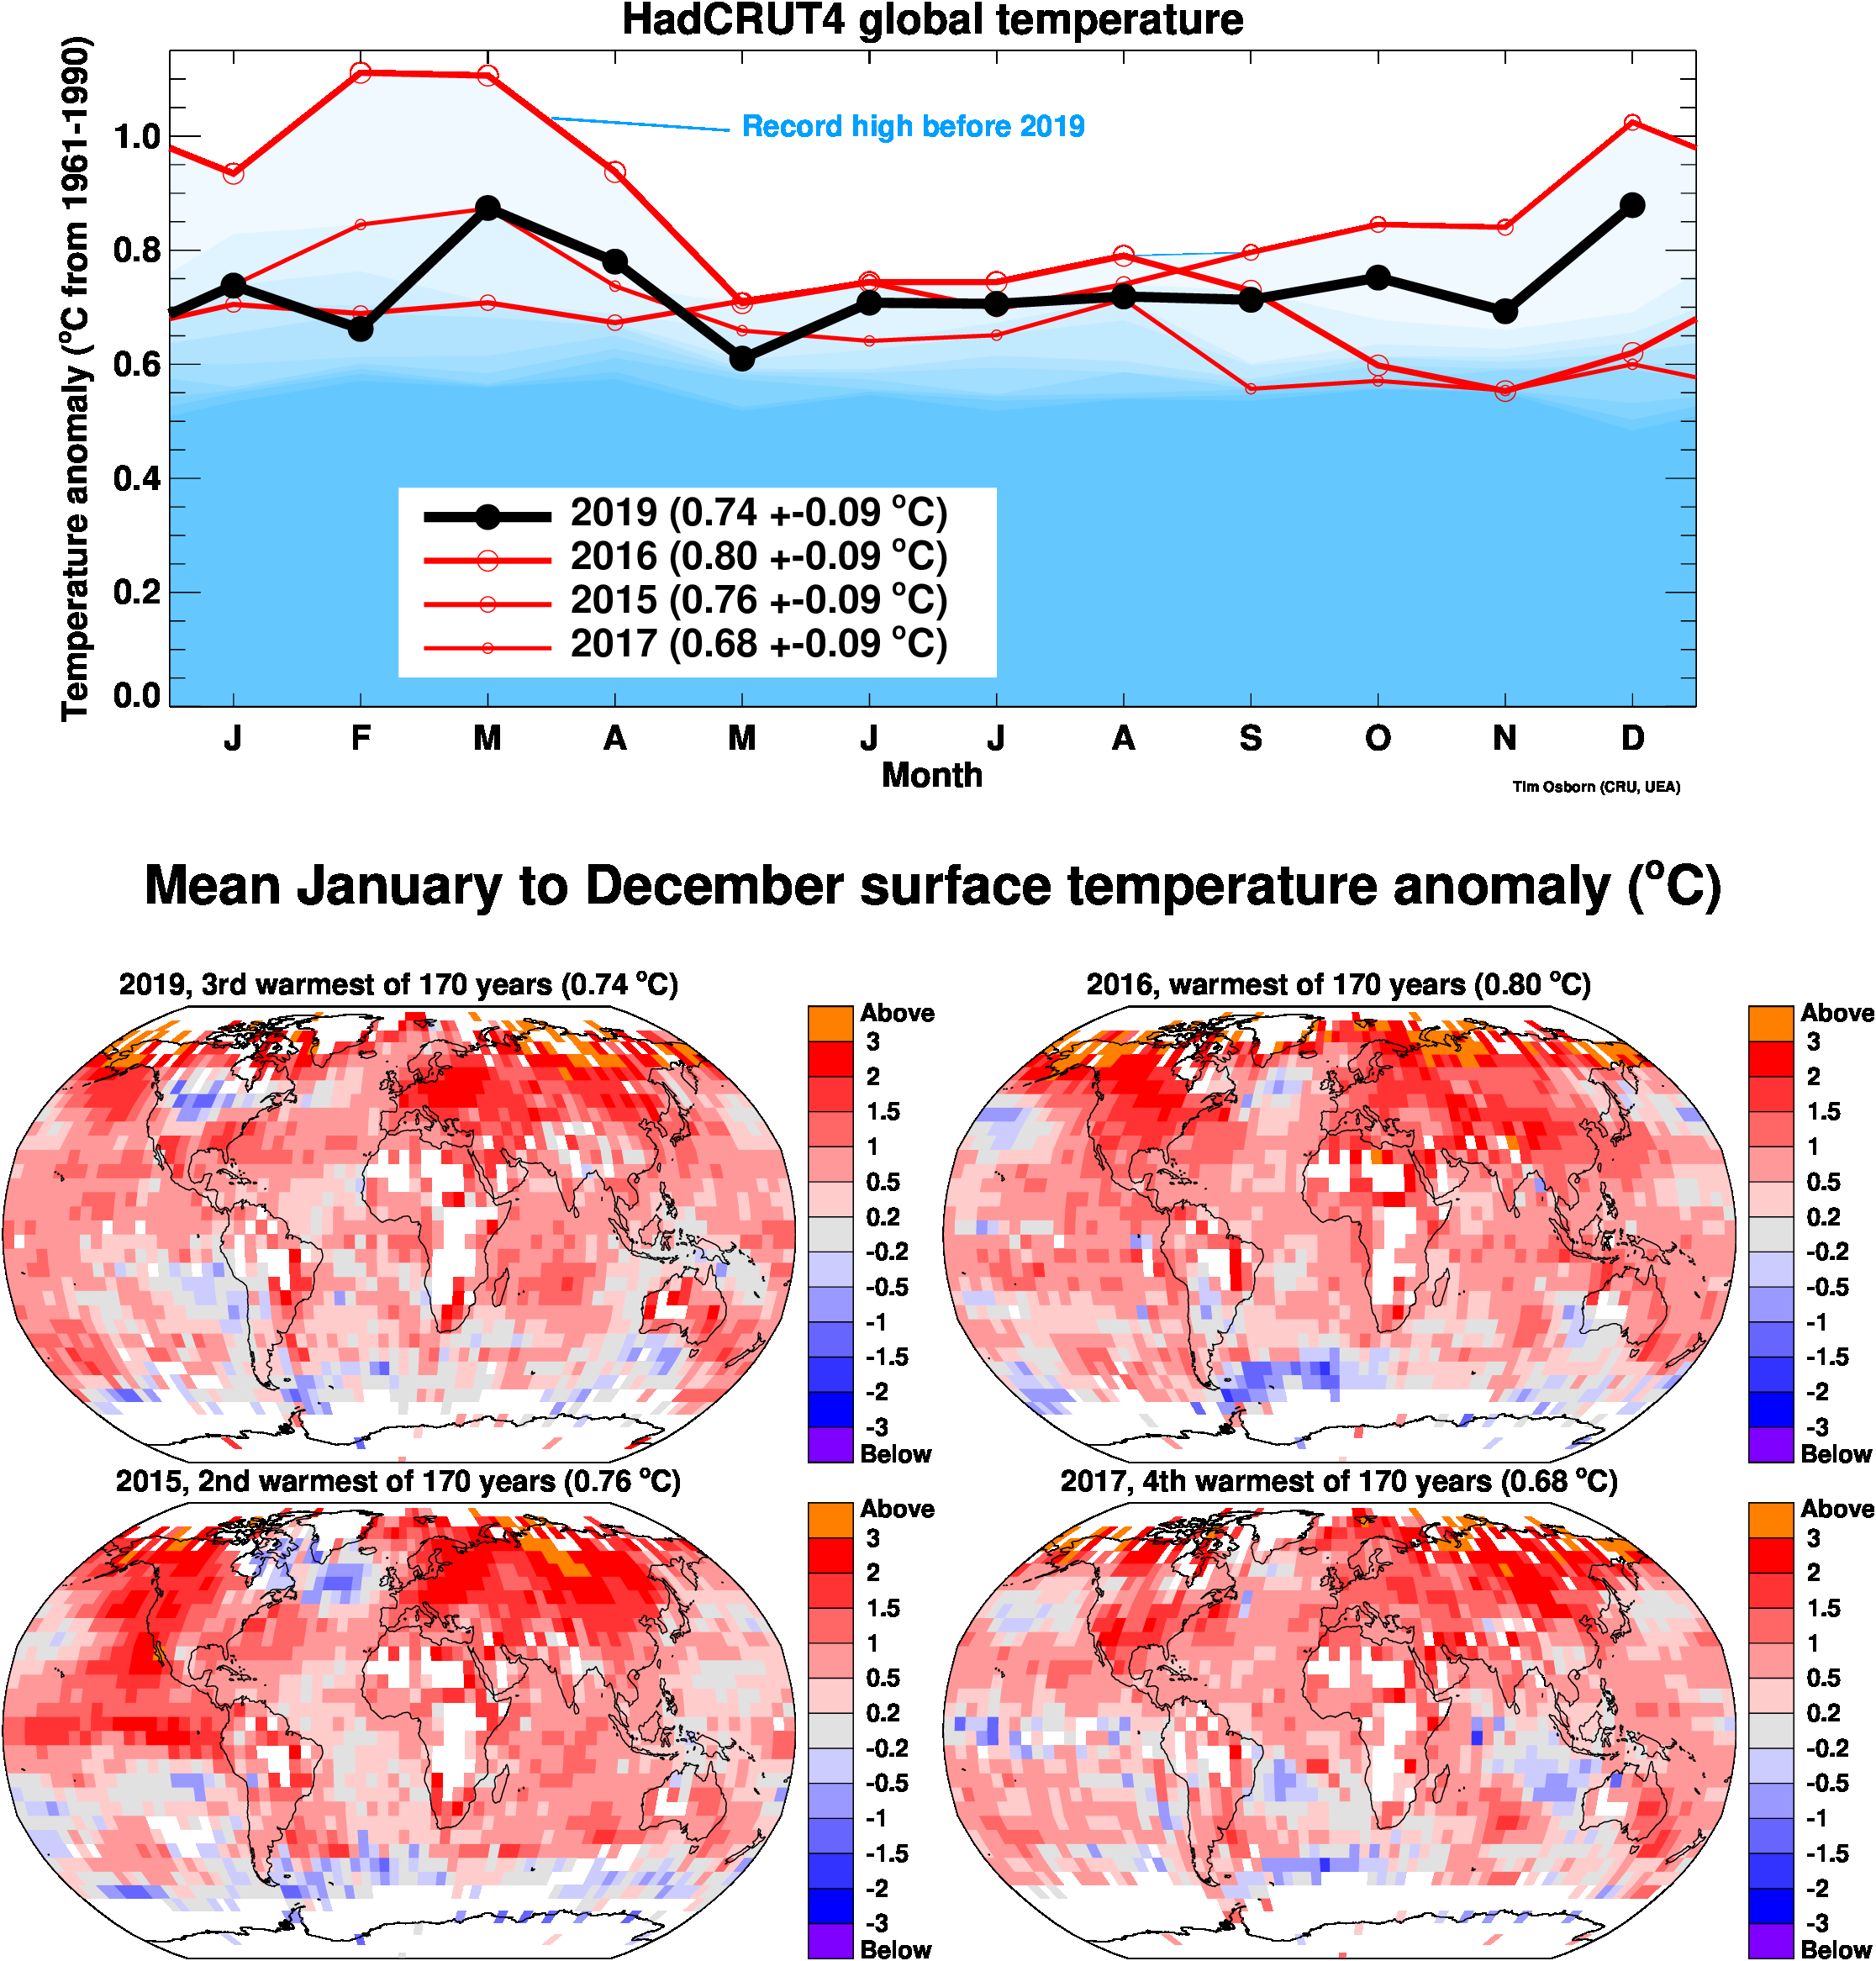
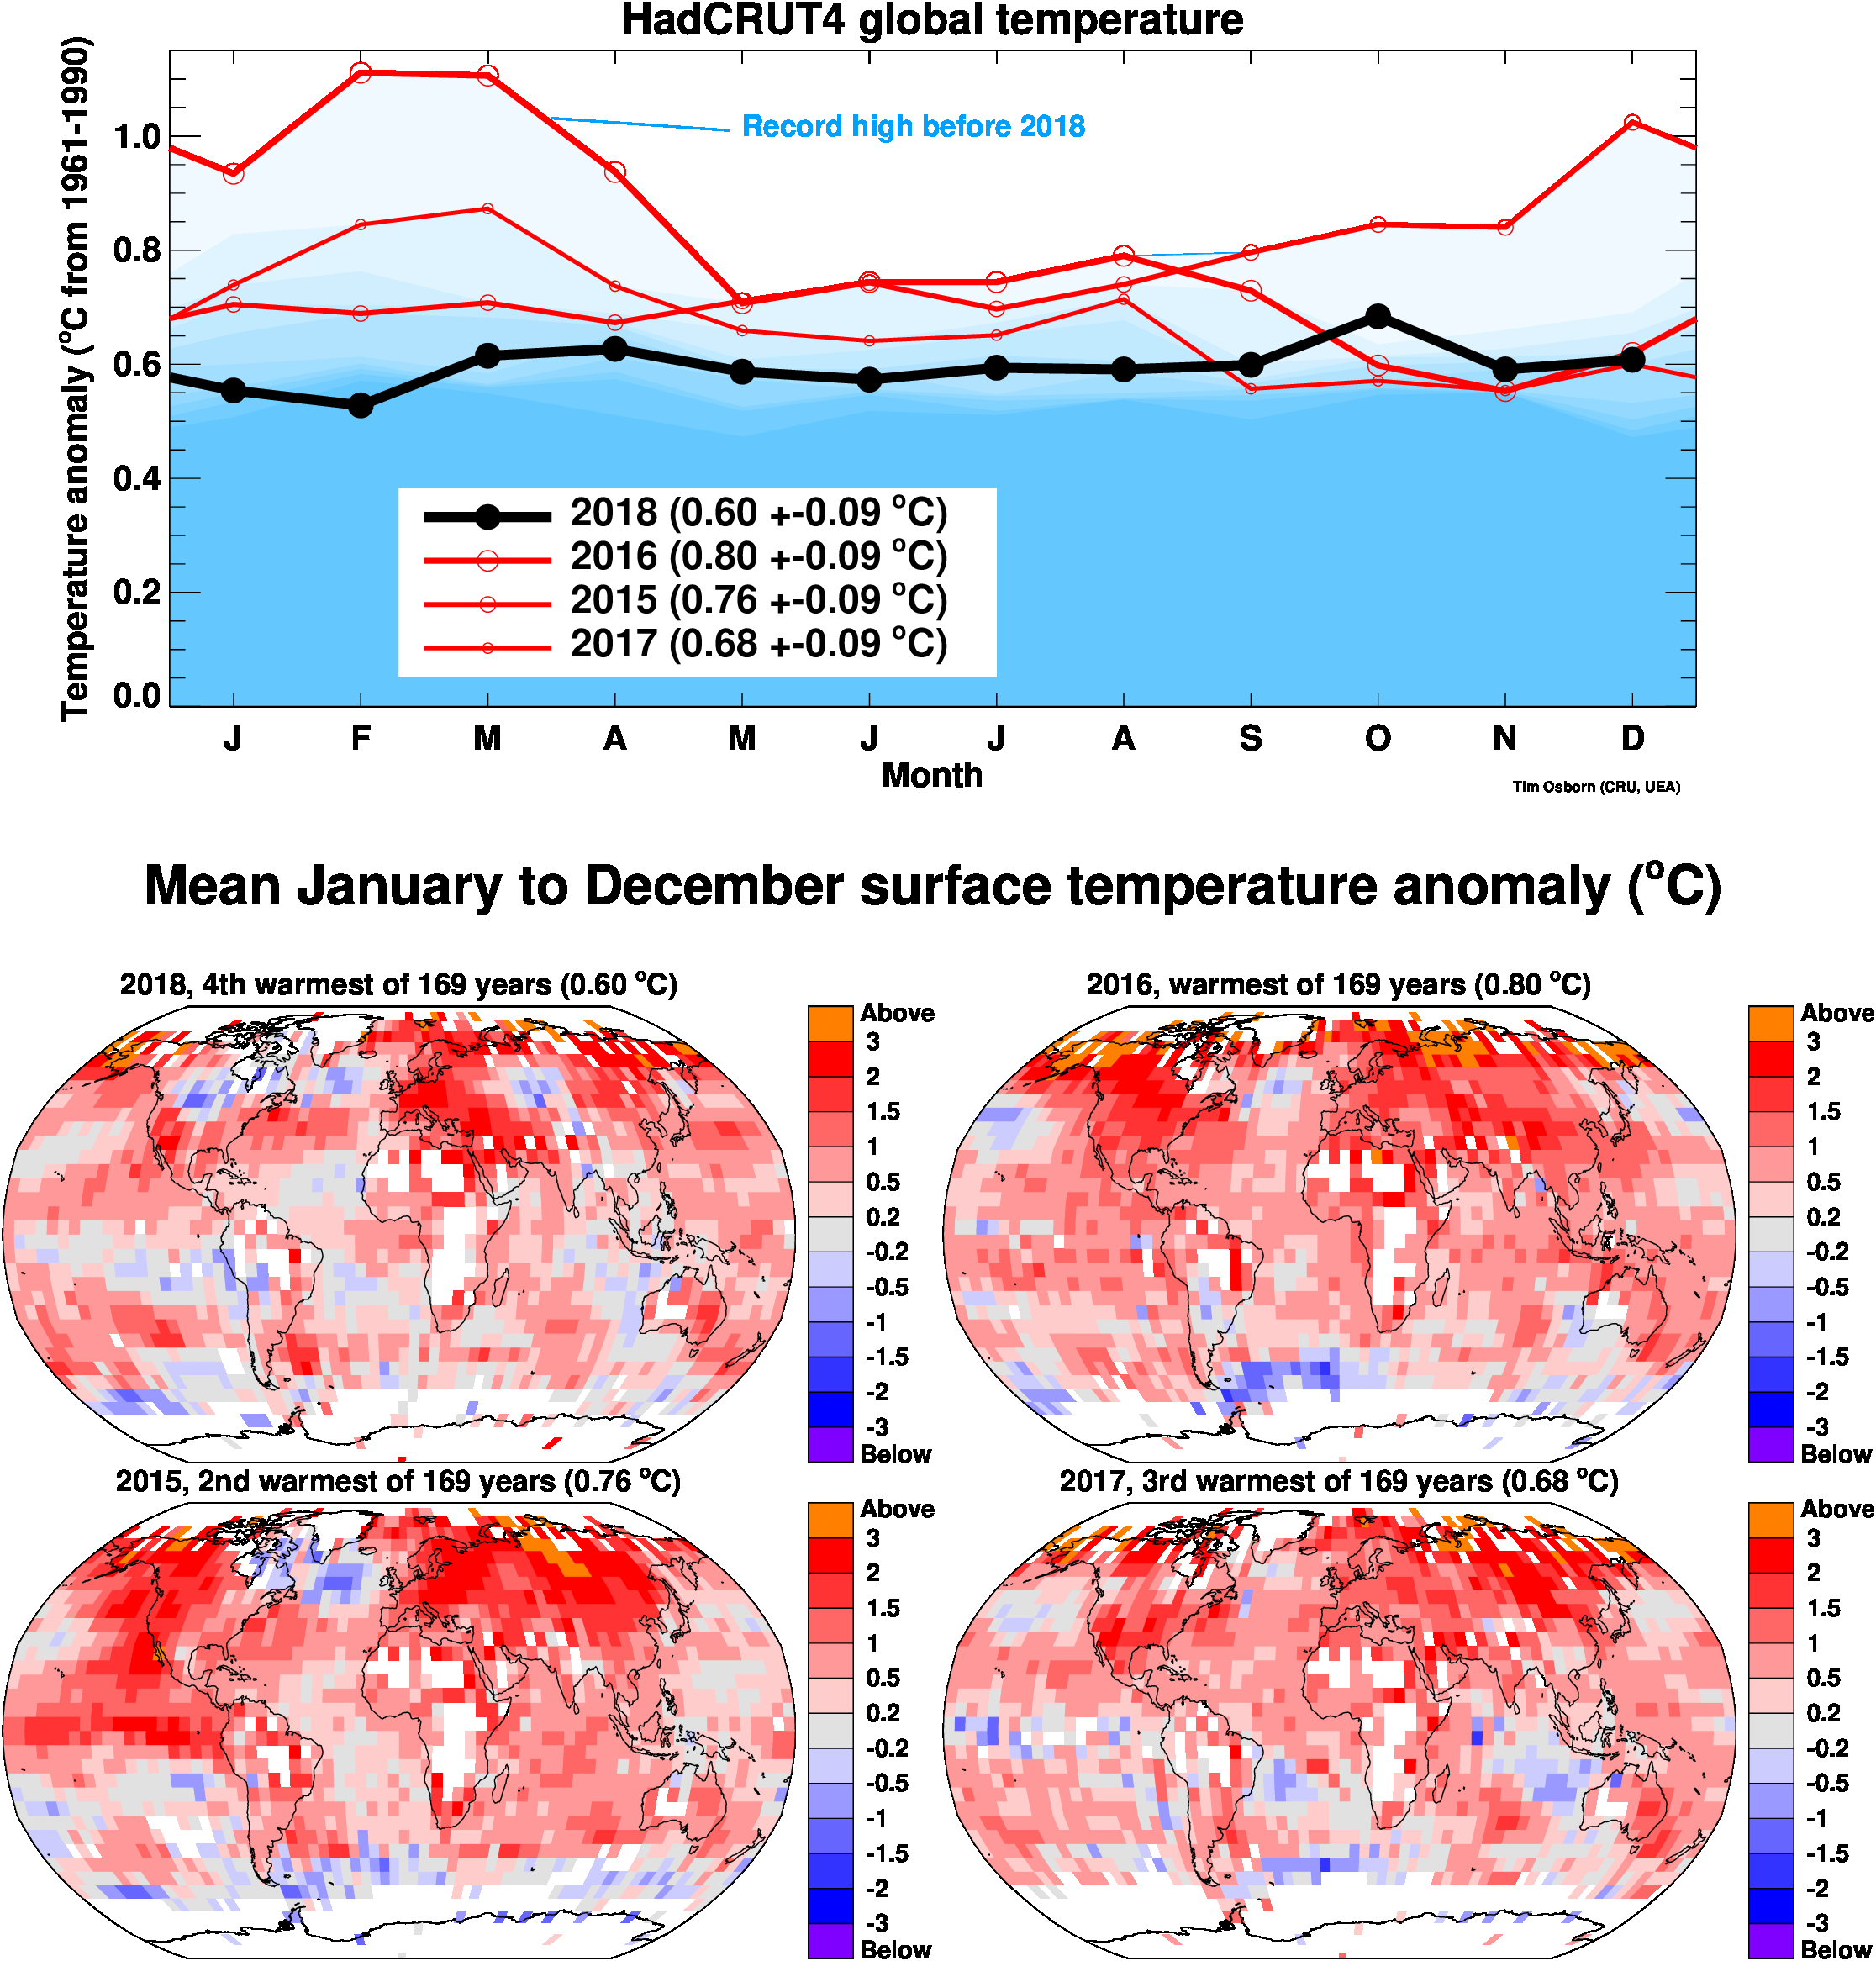
Some archived end-of-year graphs are based on the earlier (now superseded) versions.
Click the "more info" links for details about each visualisation, or click the images to obtain a larger image. You are free to use these images provided you attribute them to Tim Osborn (CRU, UEA) and cite the HadCRUT5 or CRUTEM5 references listed below.
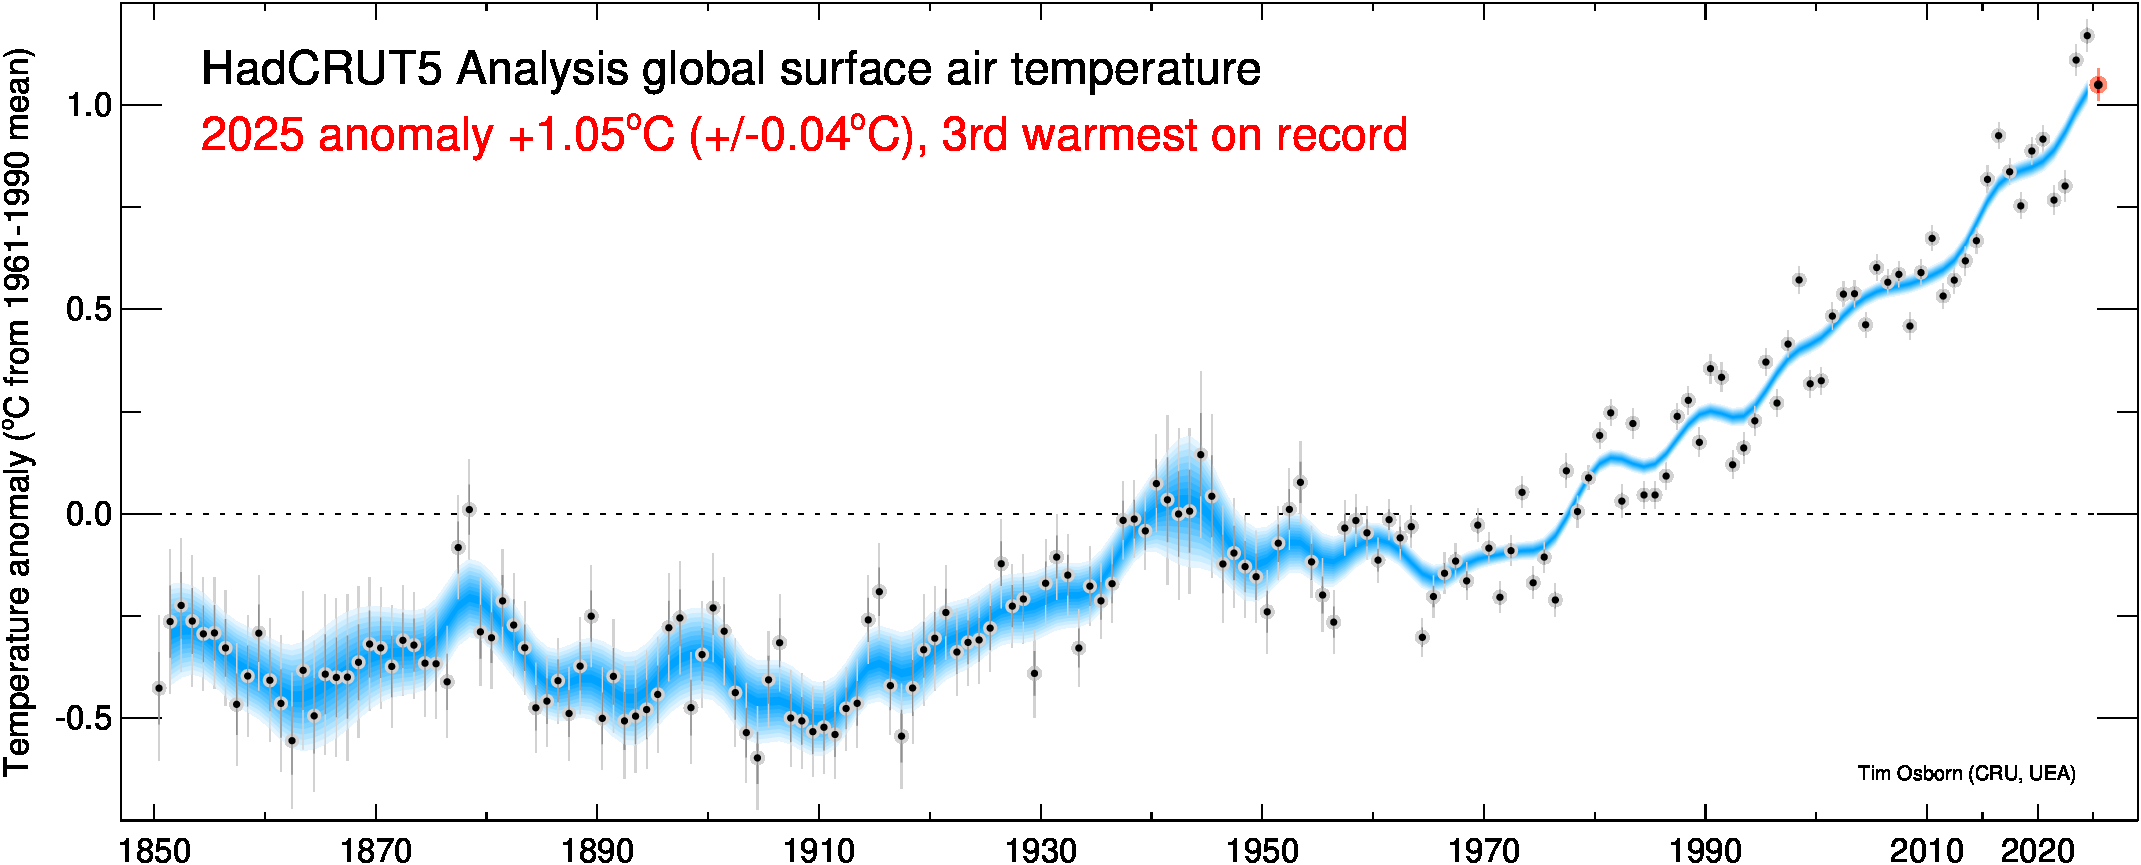
| Temperature timeseries: yearly and decadally smoothed, with uncertainties (more info) | ||
| Global | Northern Hemisphere | Southern Hemisphere |
Click for larger image |
Click for larger image |
Click for larger image |
| Temperature timeseries: yearly and decadal means, with uncertainties (more info) | ||
| Global | Northern Hemisphere | Southern Hemisphere |
Click for larger image |
Click for larger image |
Click for larger image |
| Temperature timeseries: 12-month running means (more info) | ||
| Global | Northern Hemisphere | Southern Hemisphere |
Click for larger image |
Click for larger image |
Click for larger image |
| Global land | Northern Hemi land | Southern Hemi land |
Click for larger image |
Click for larger image |
Click for larger image |
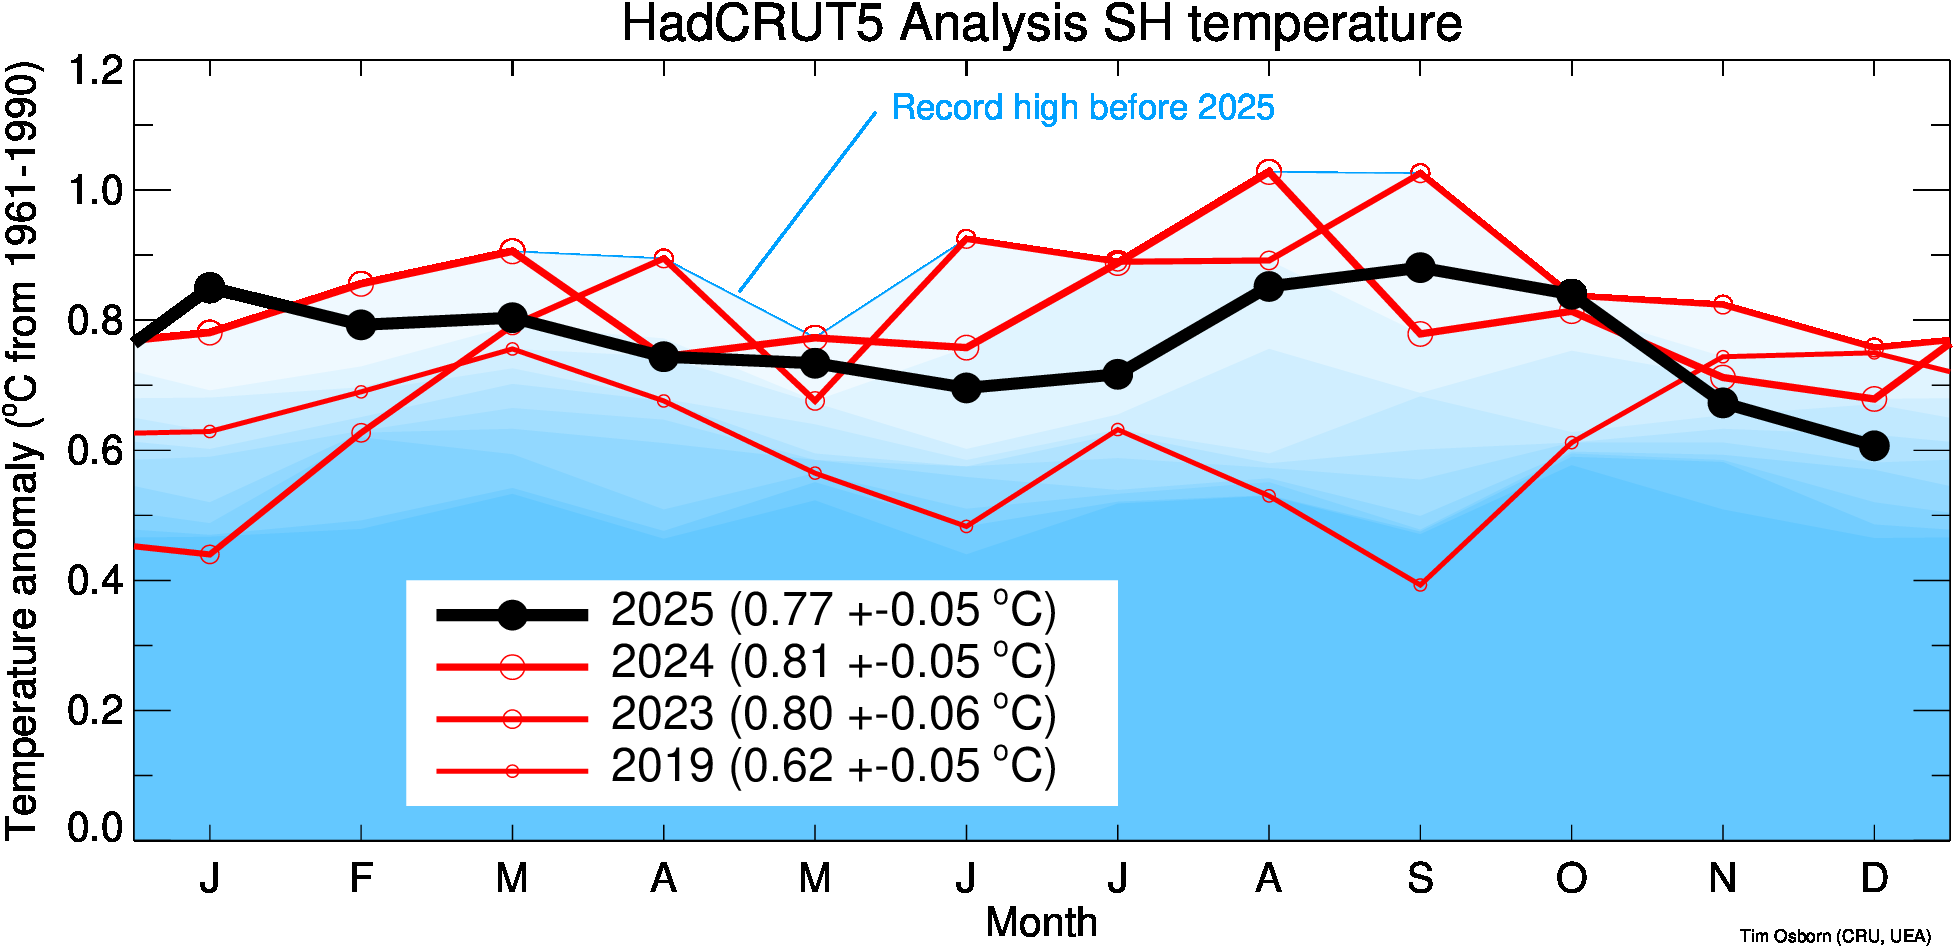
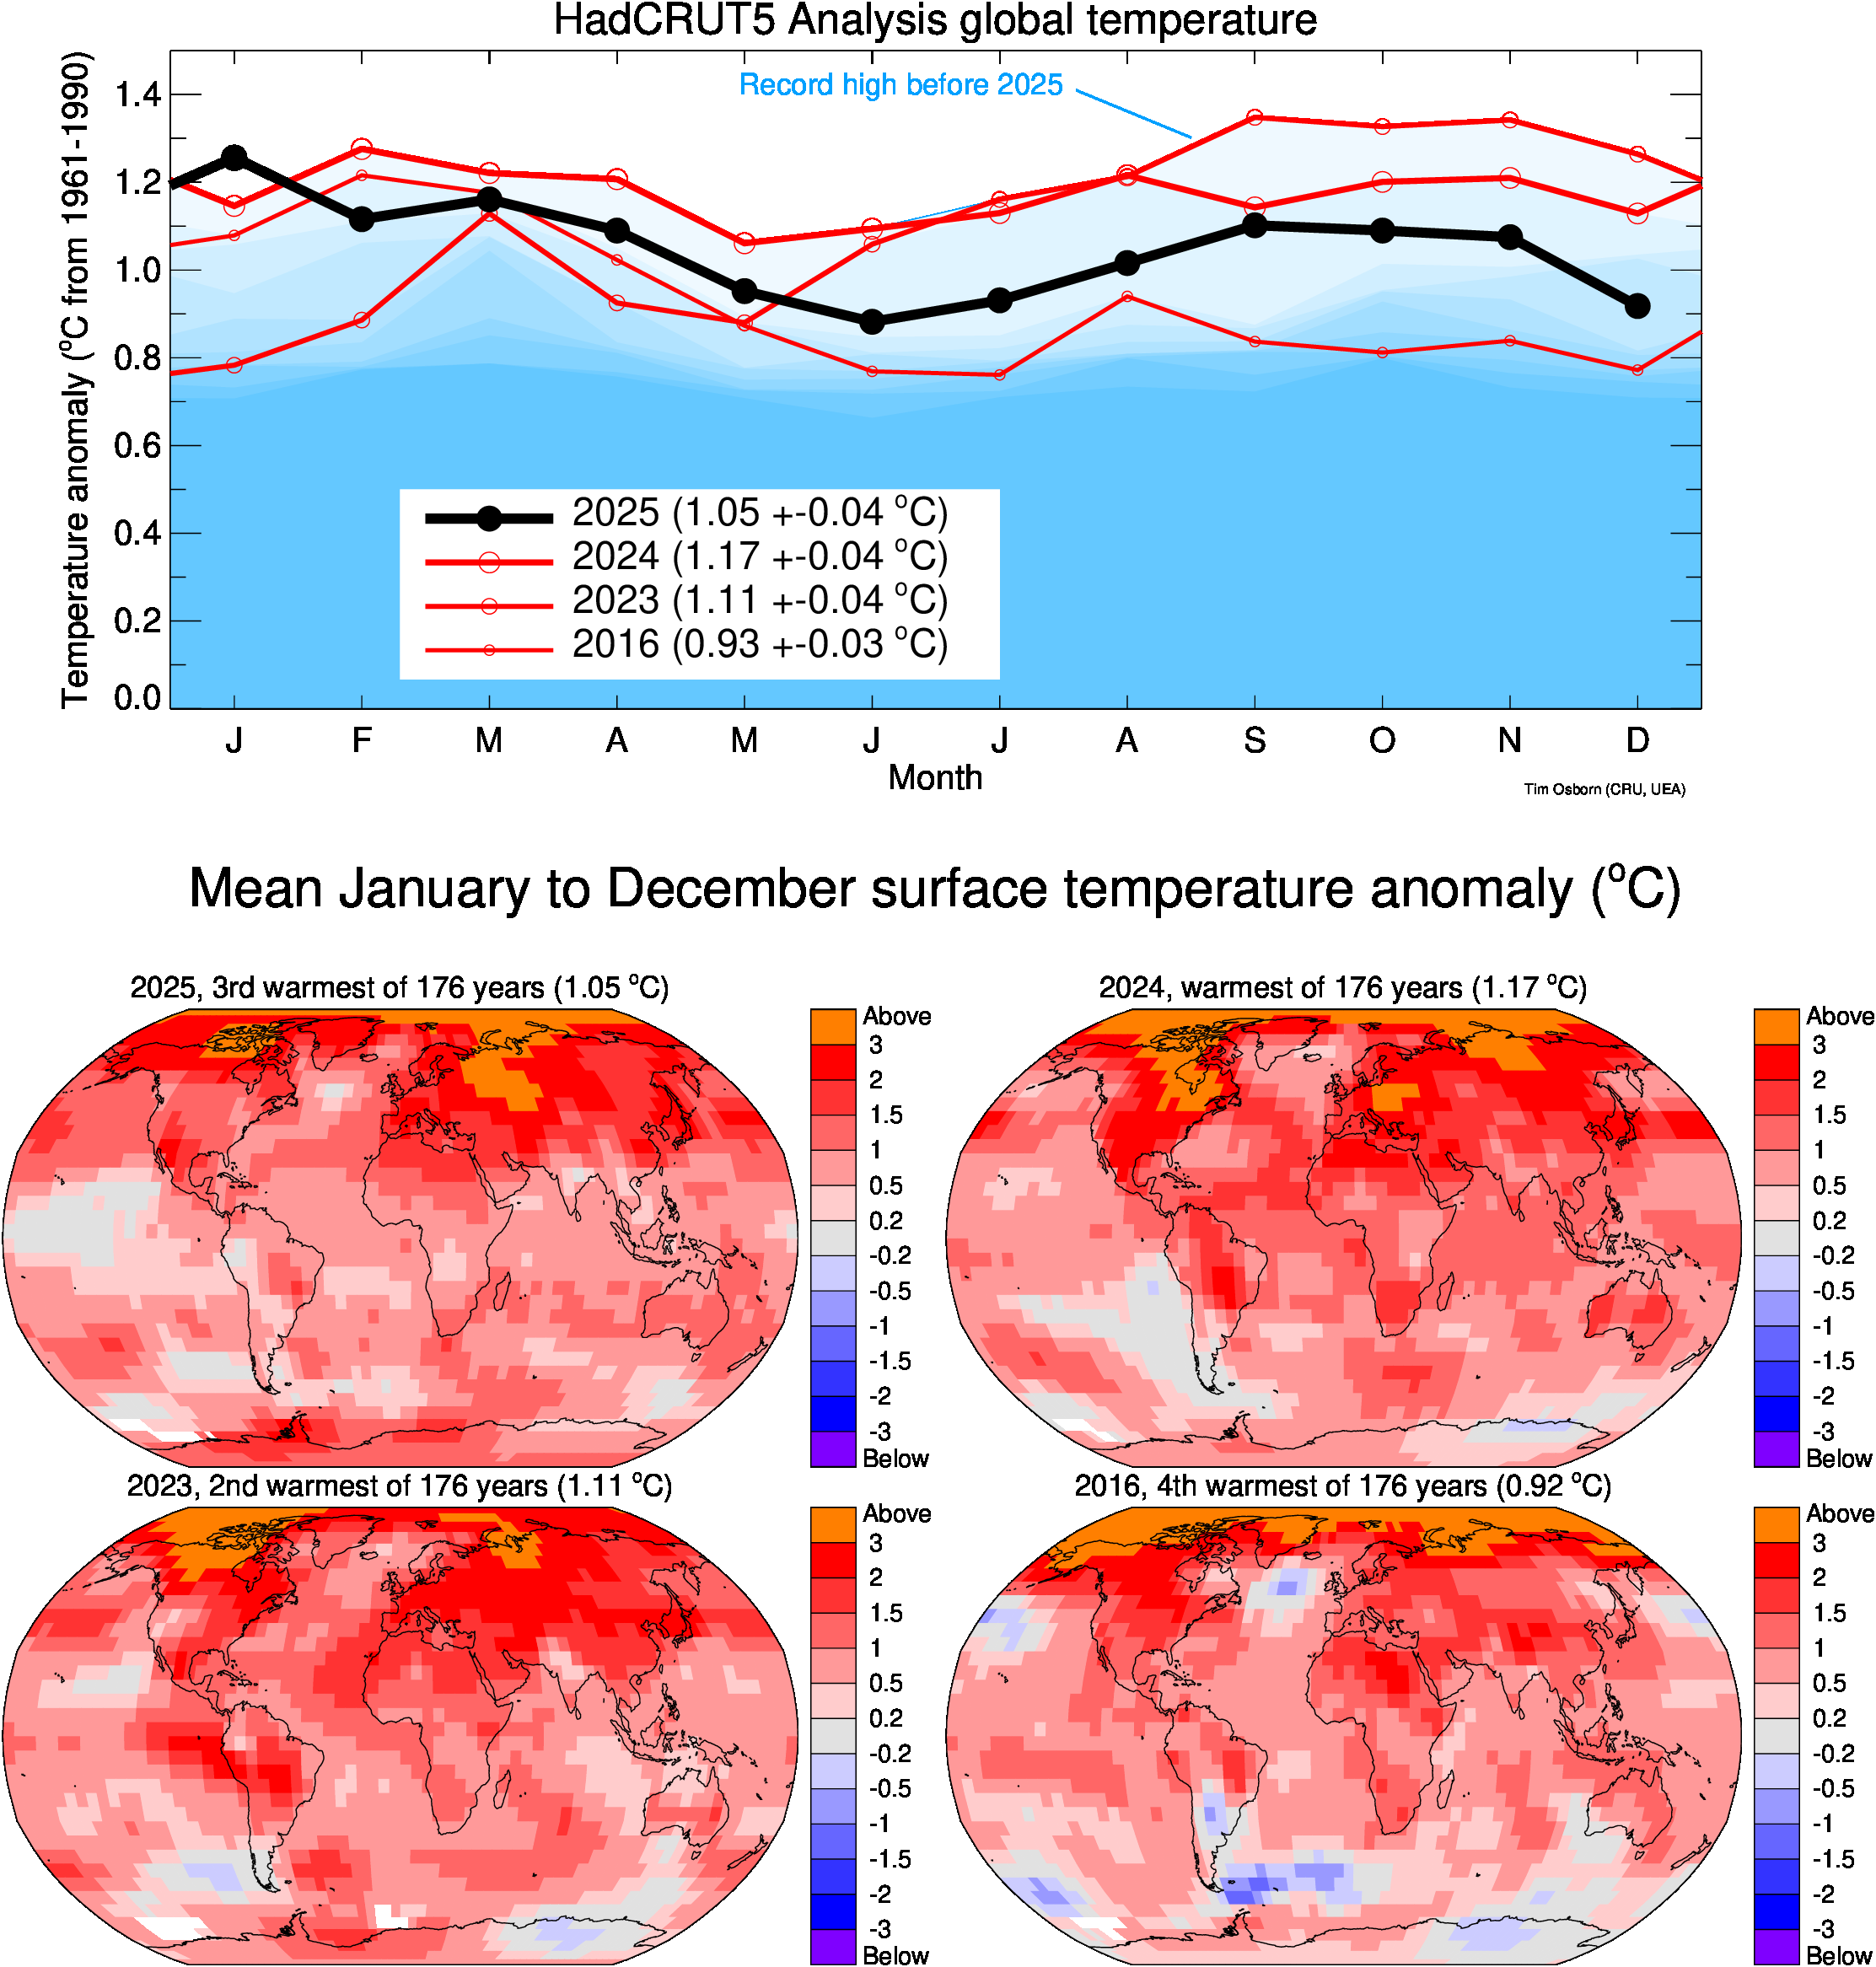
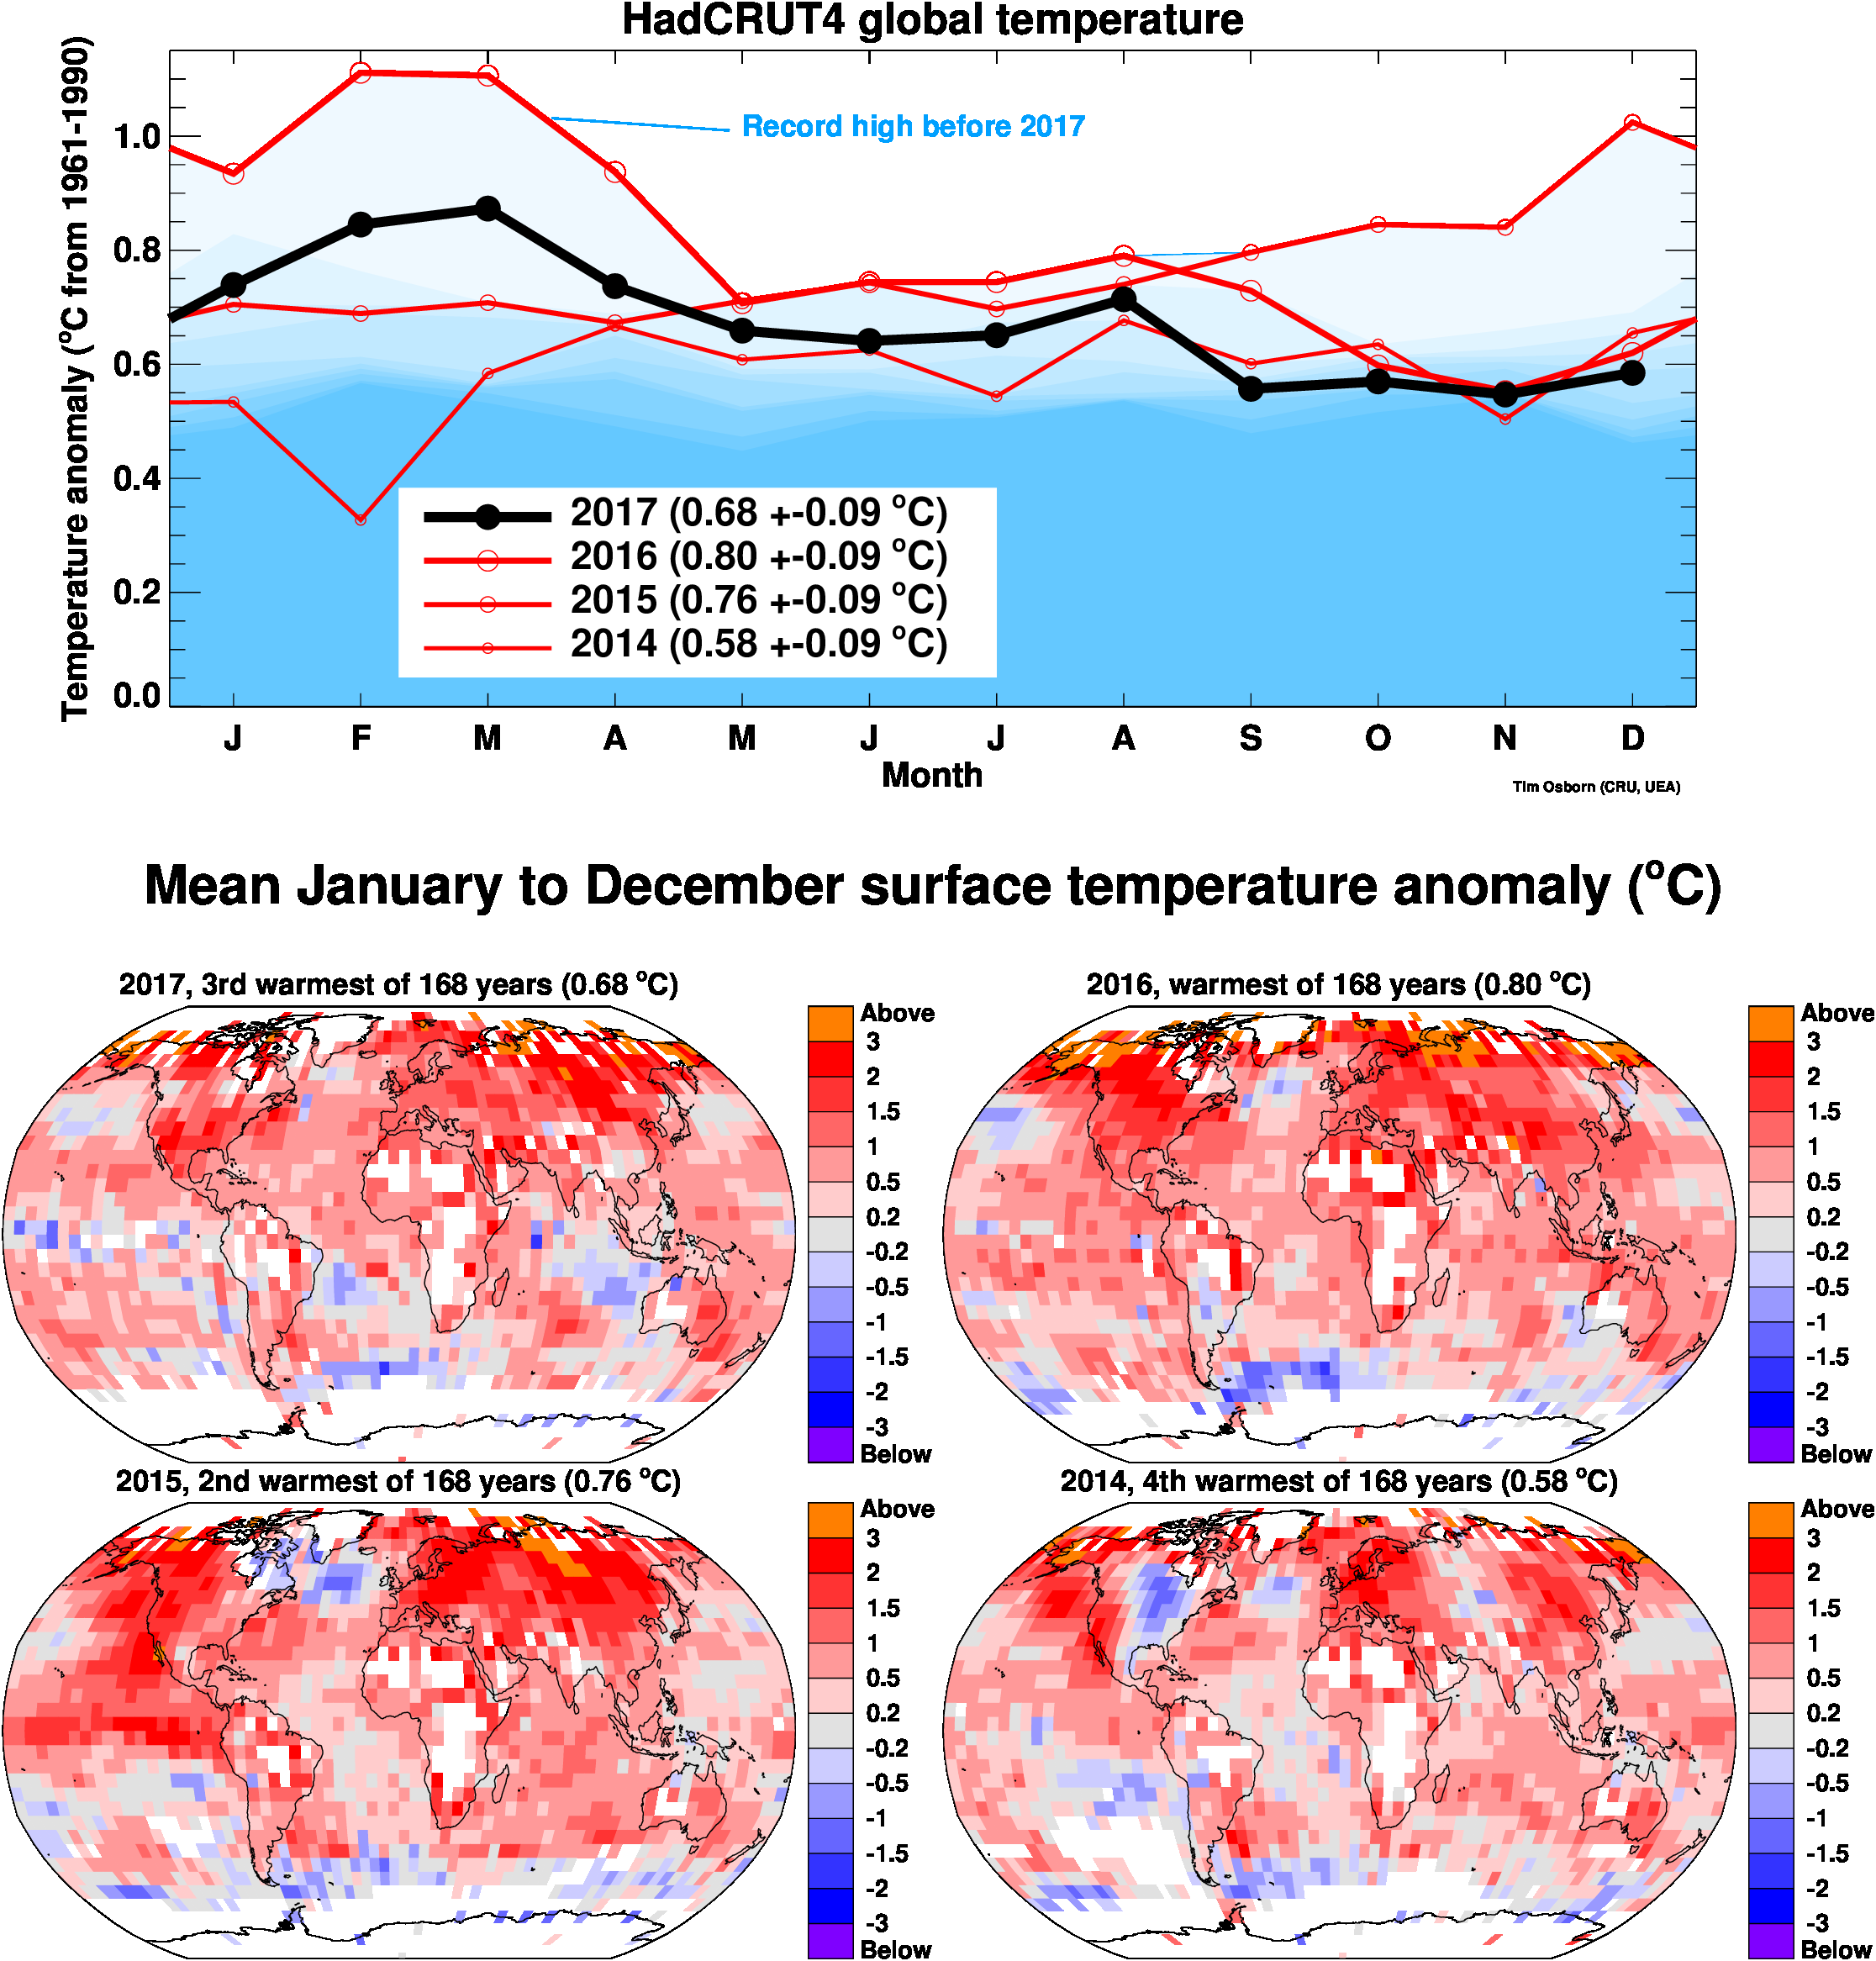
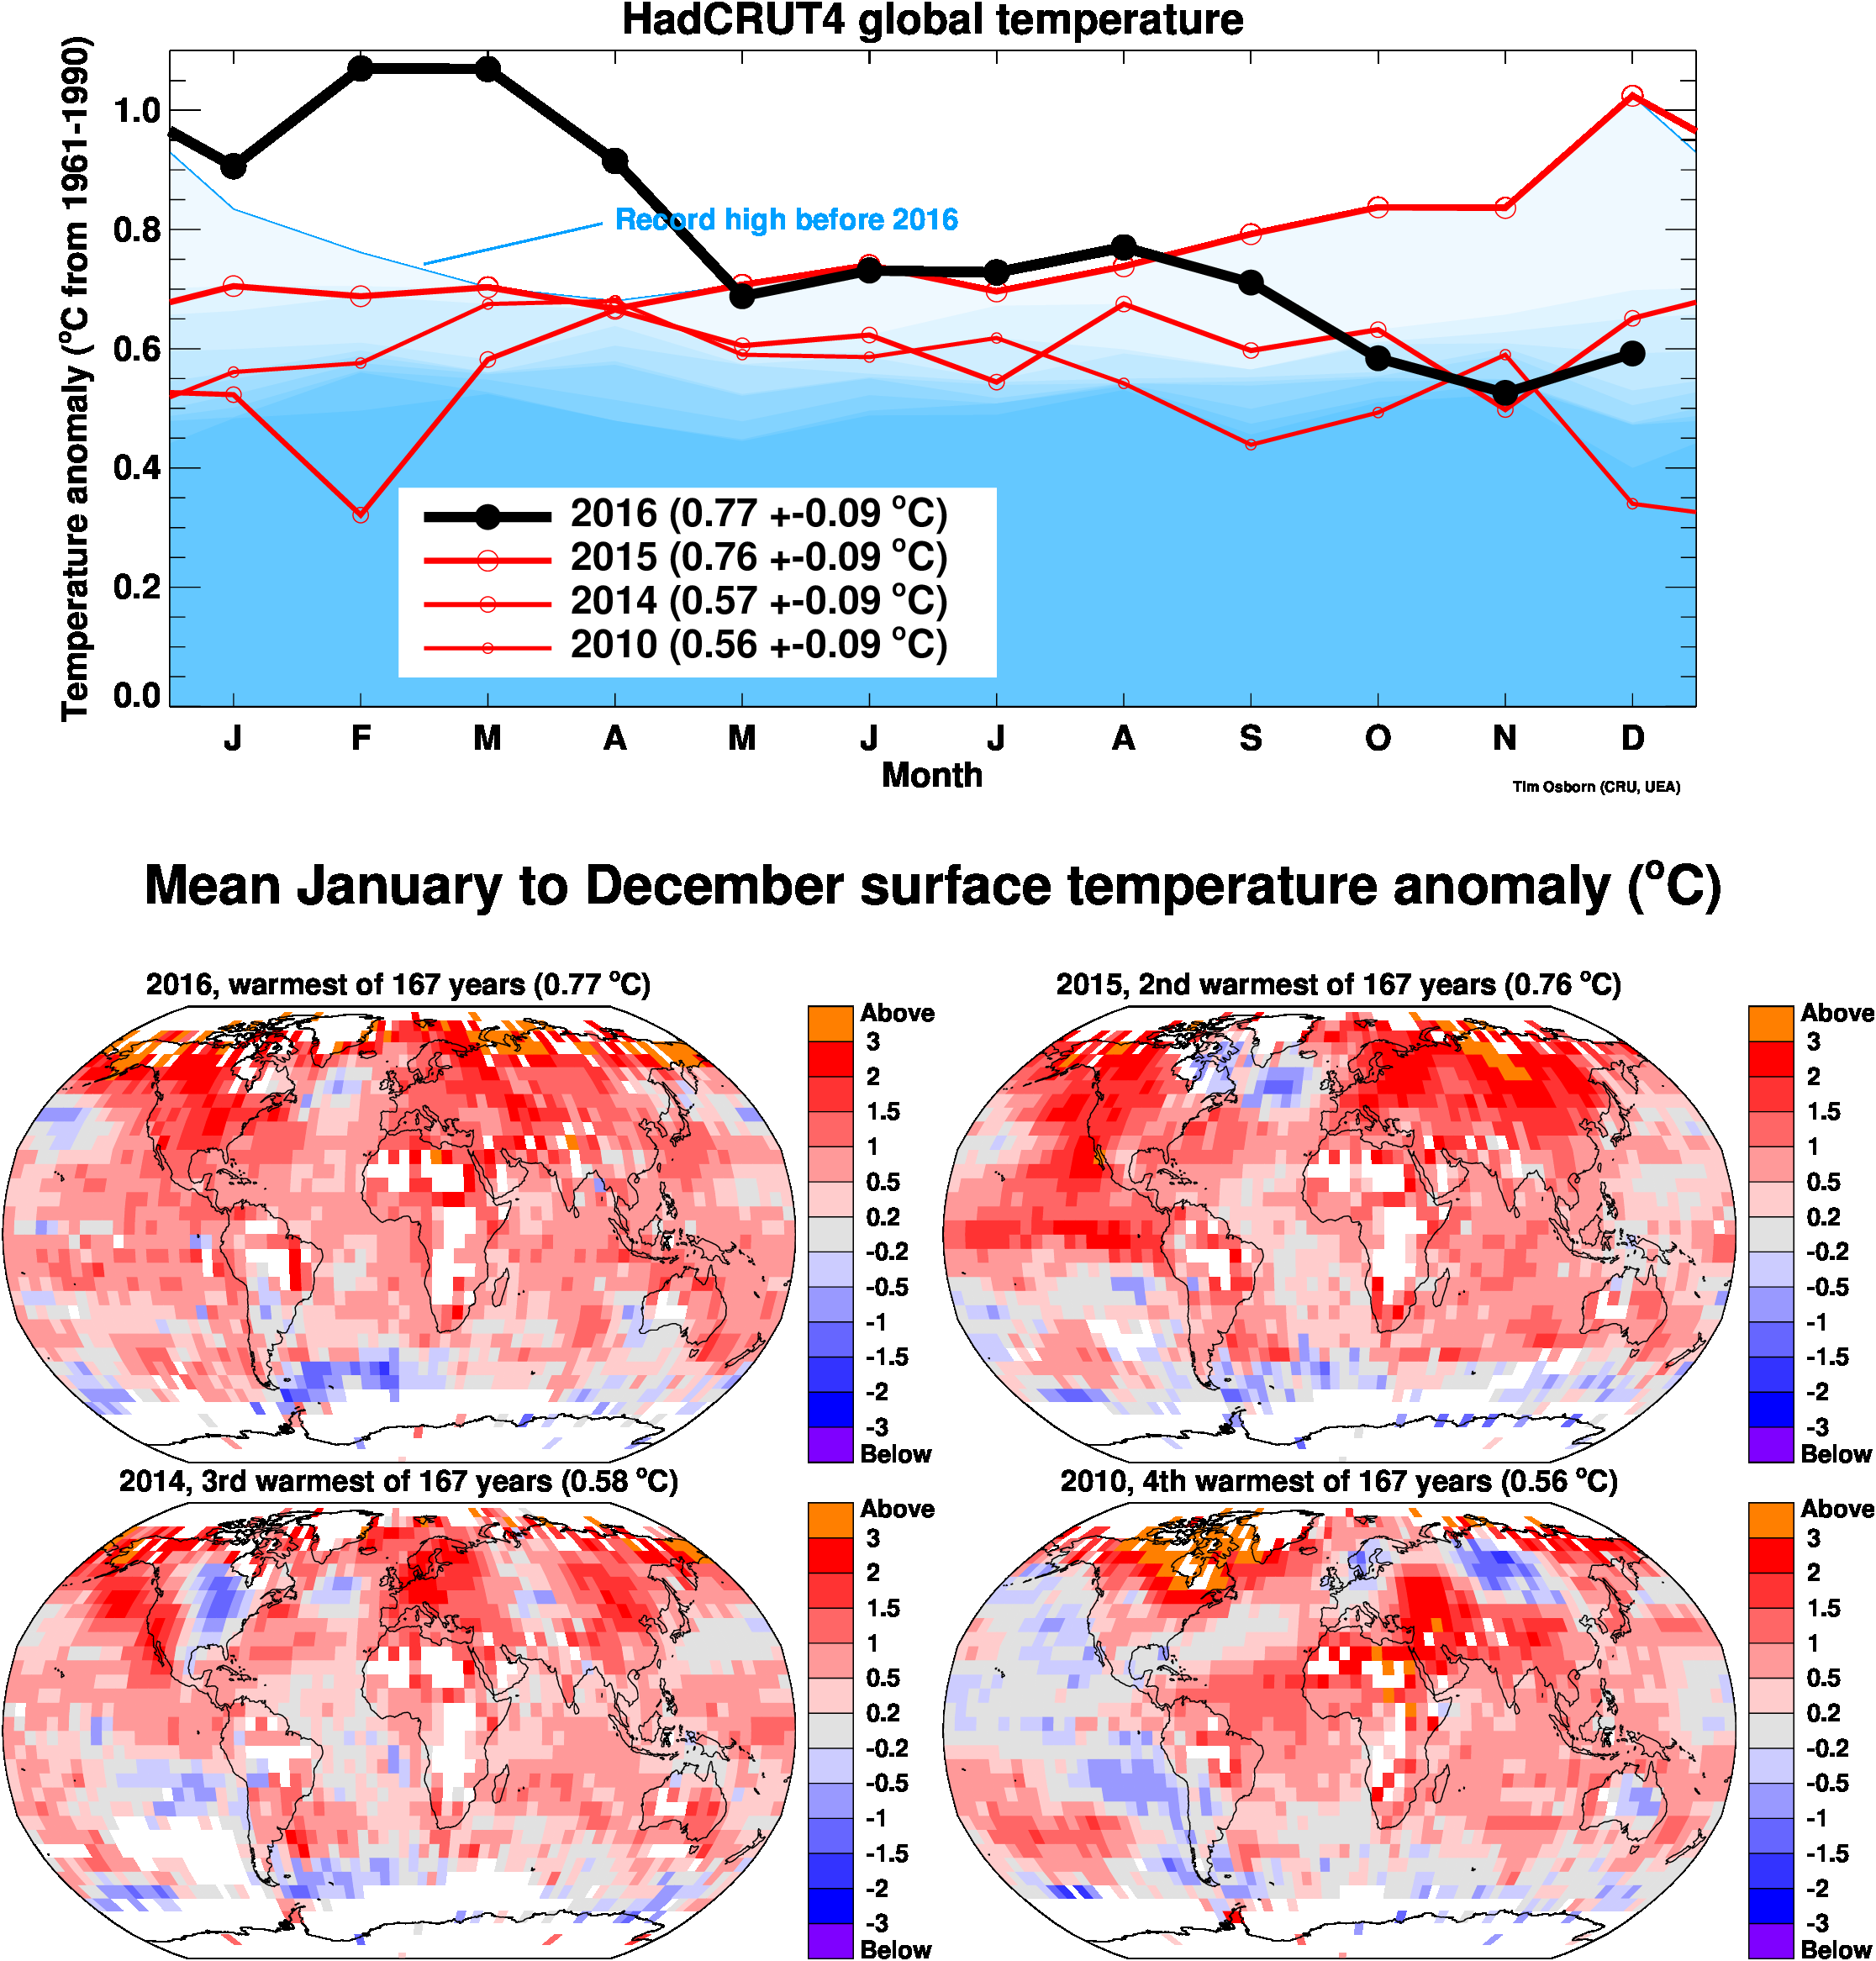
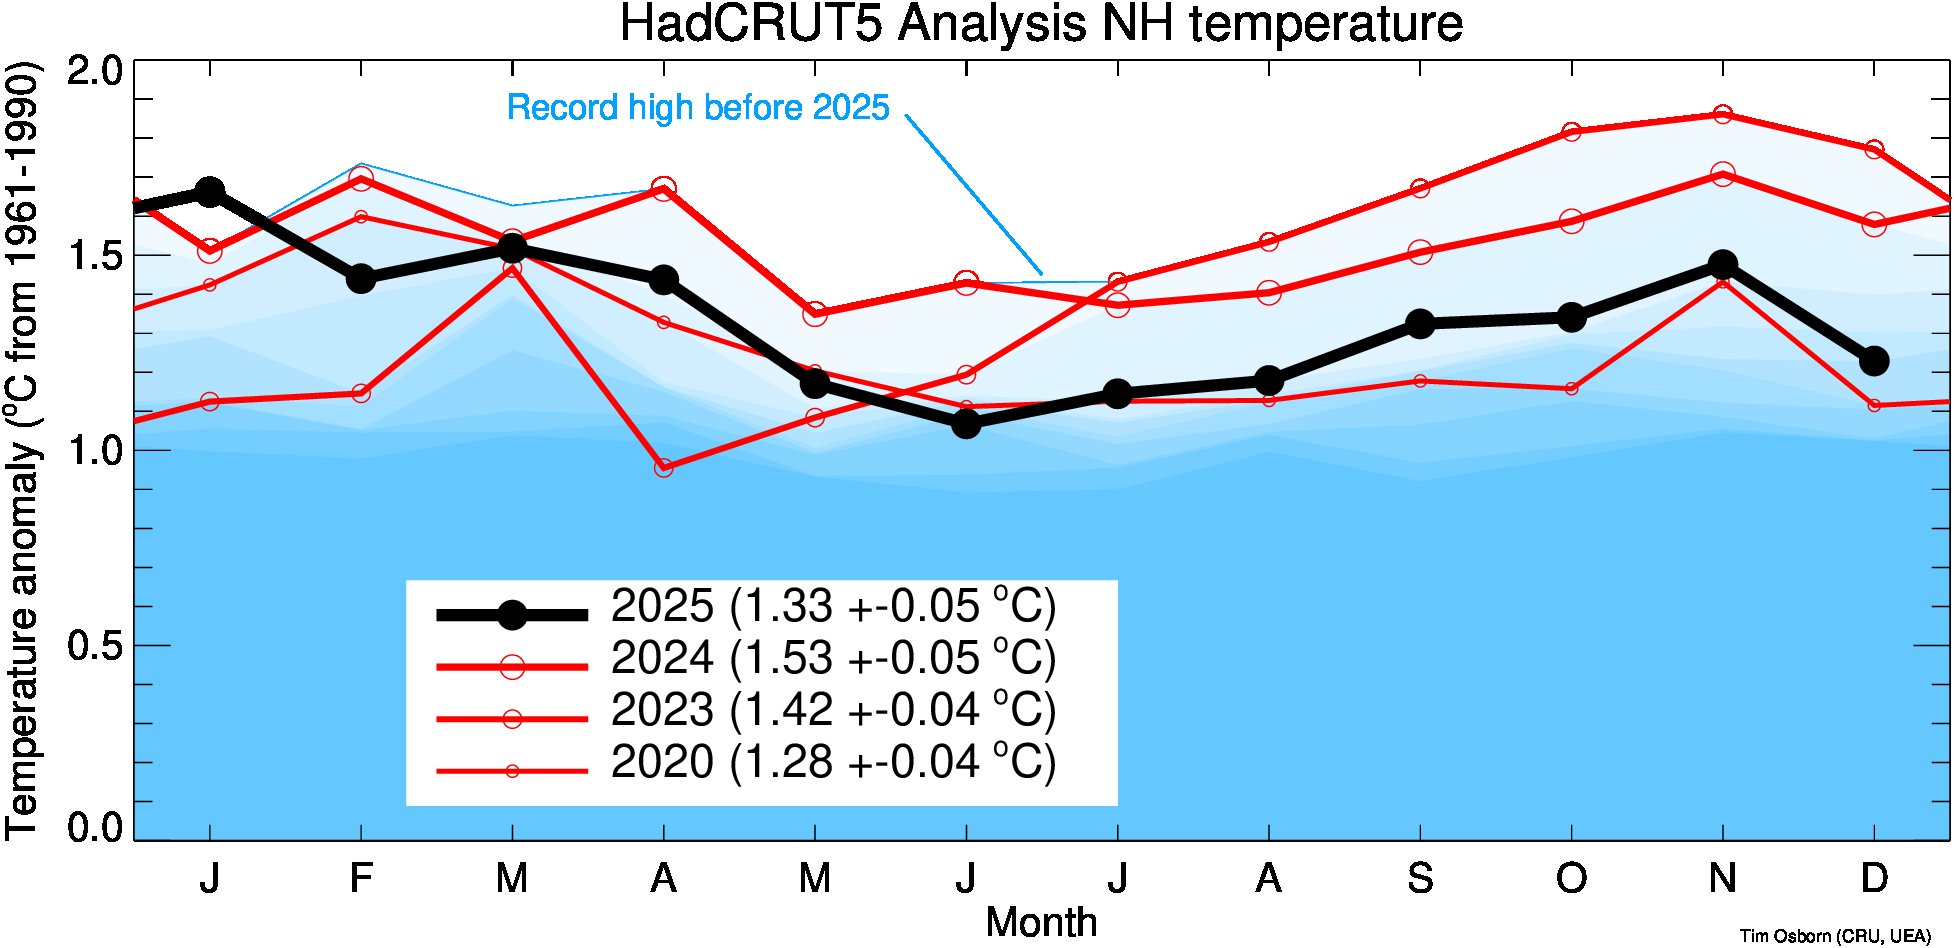
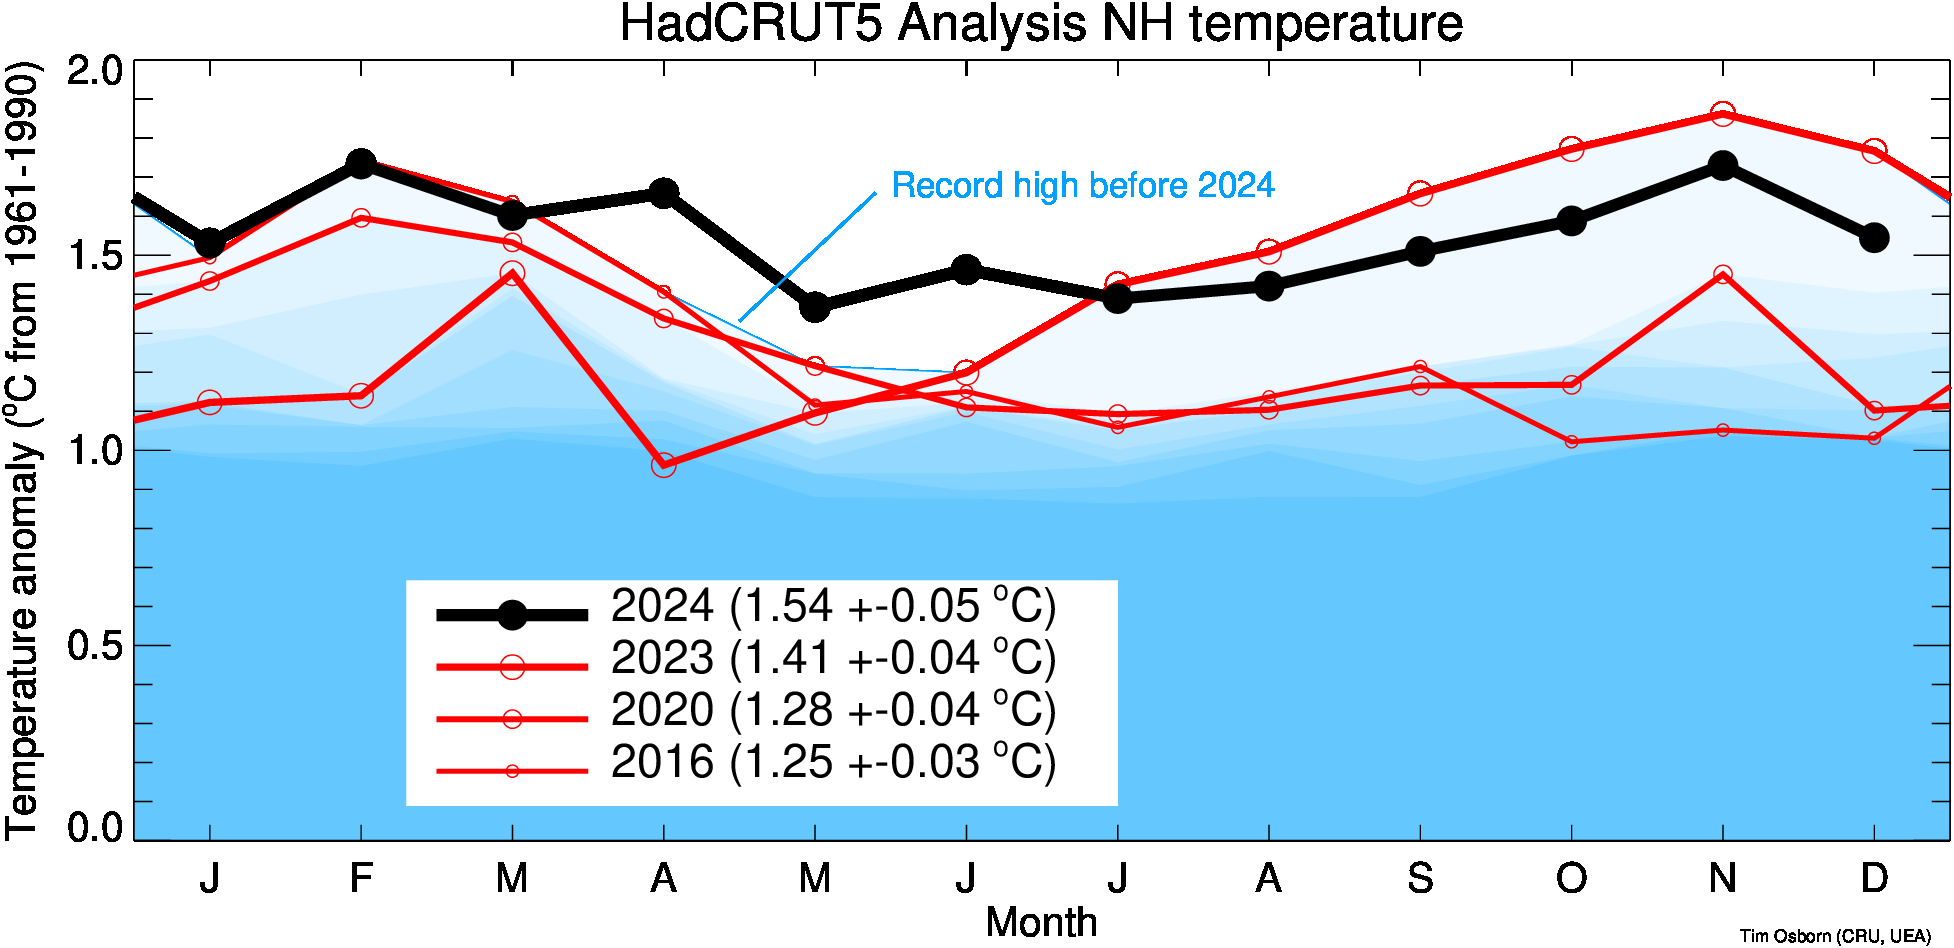
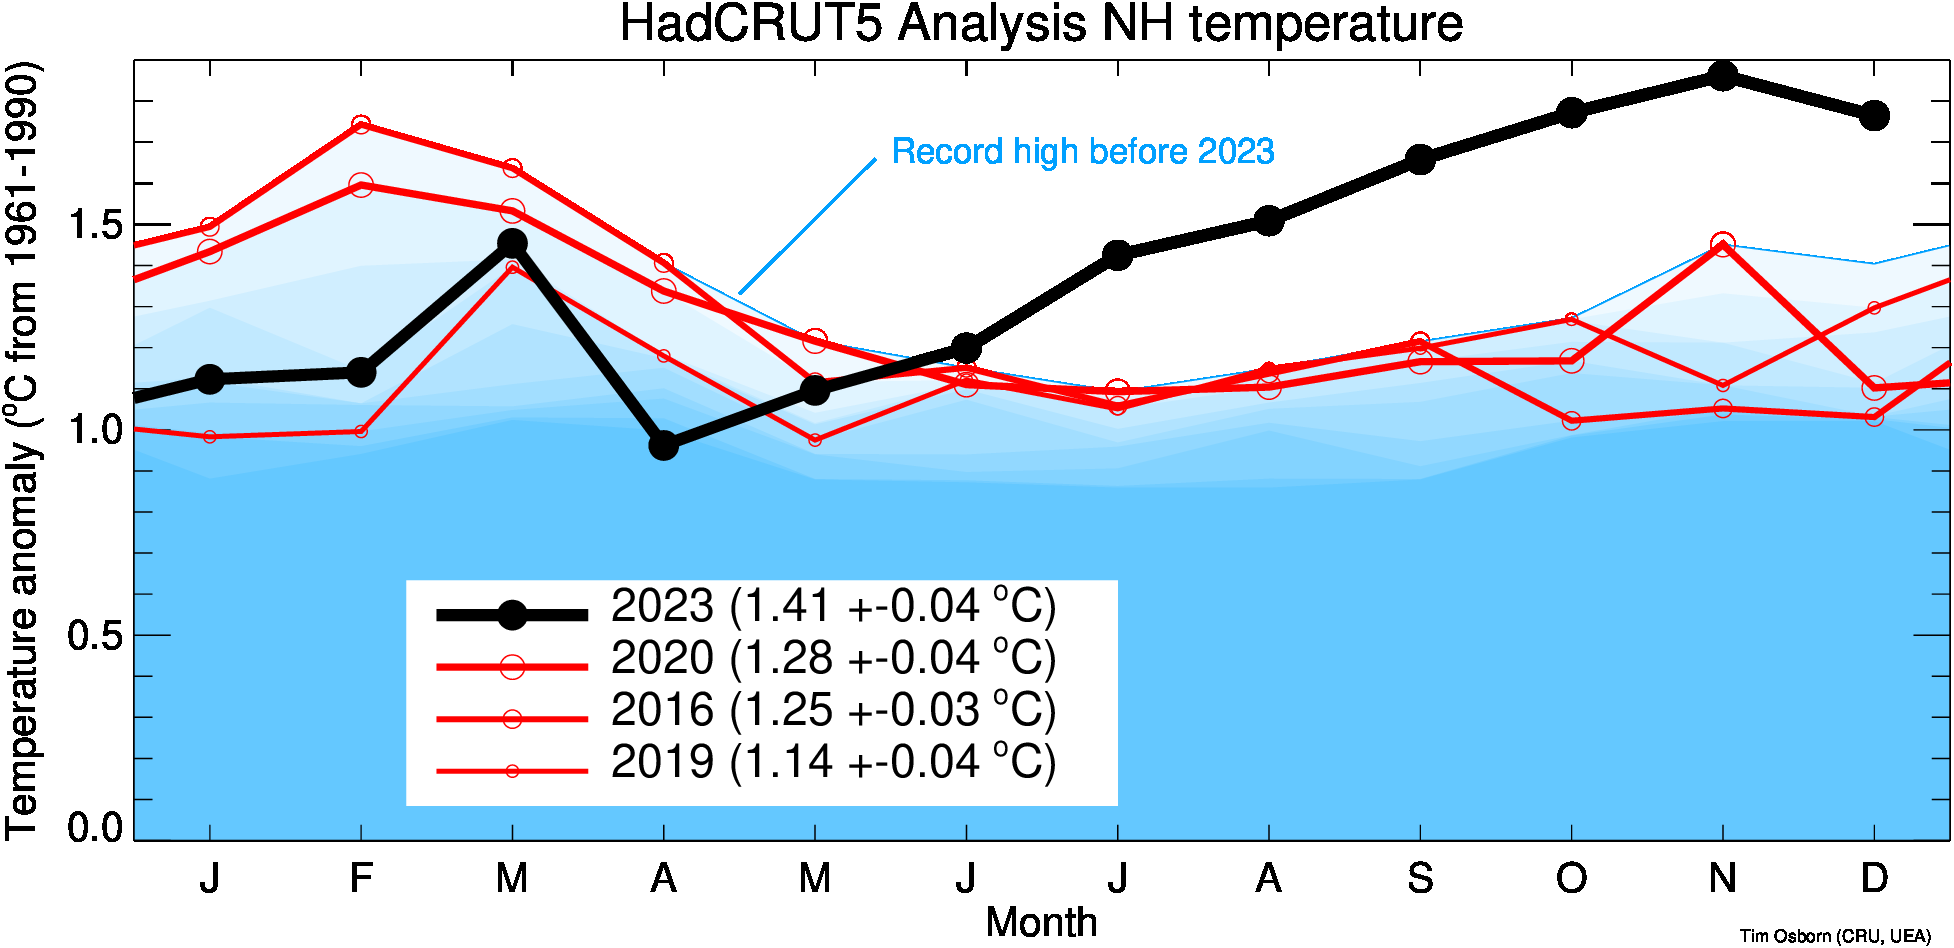
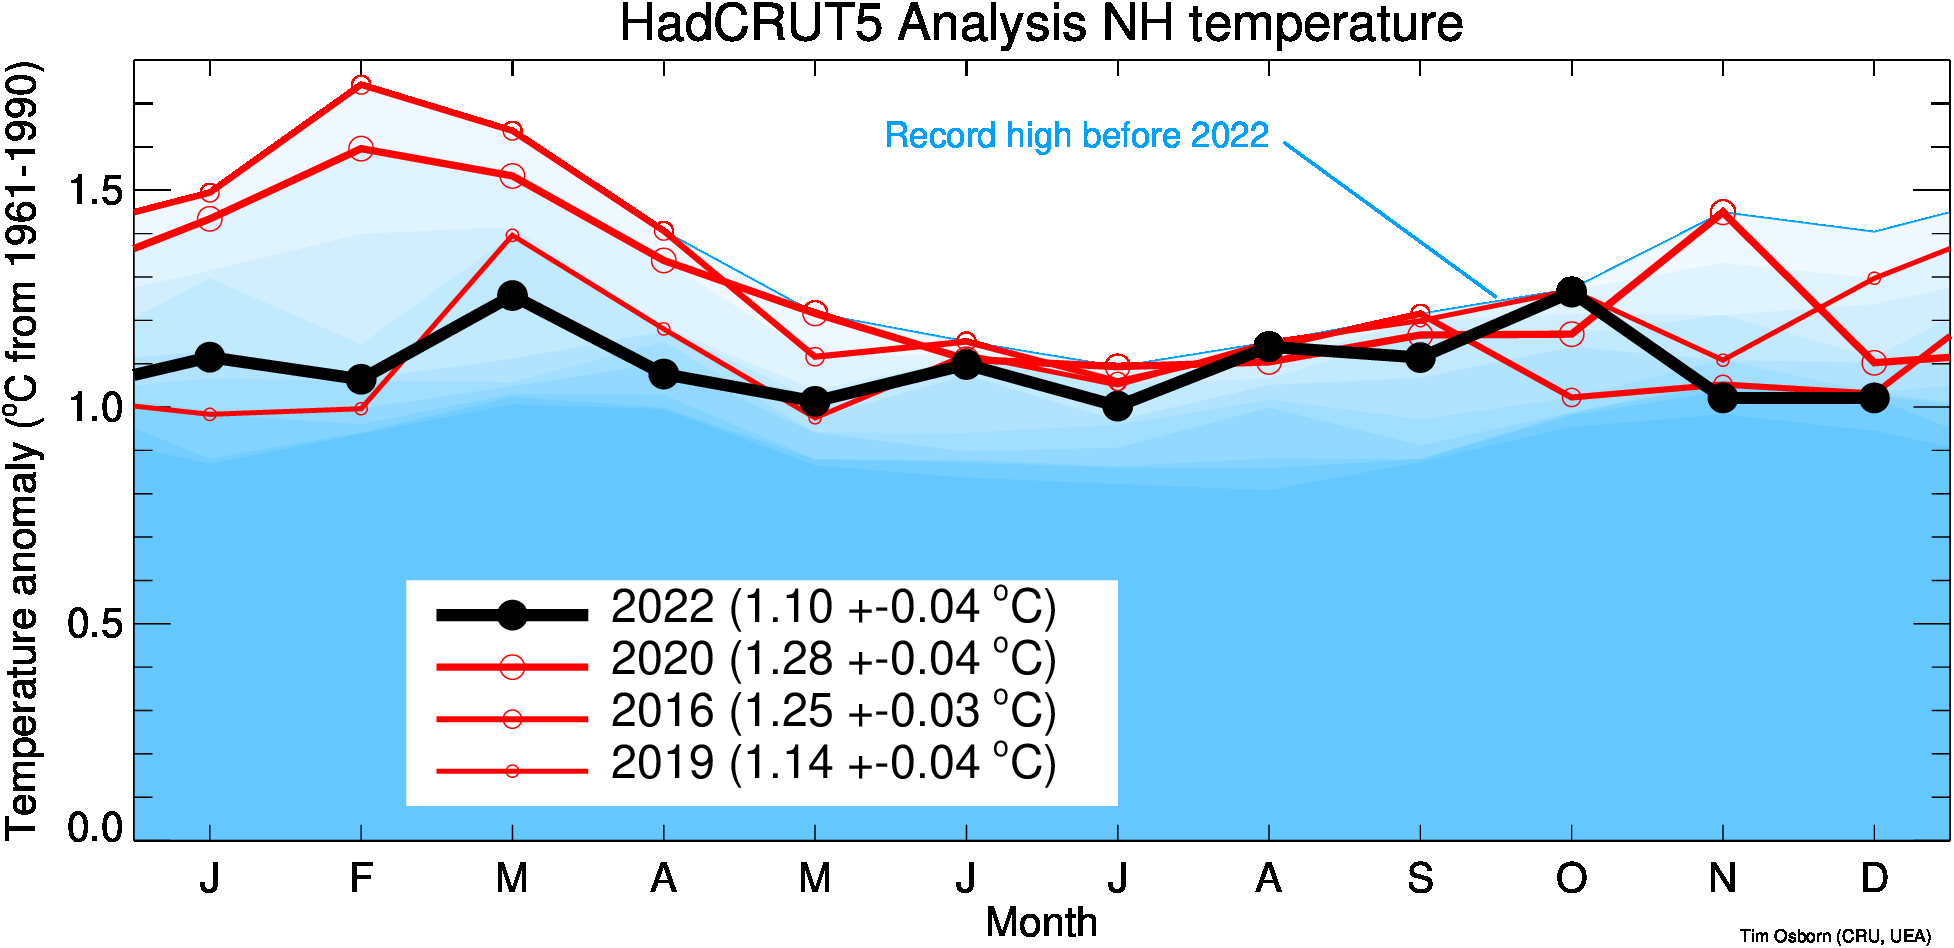
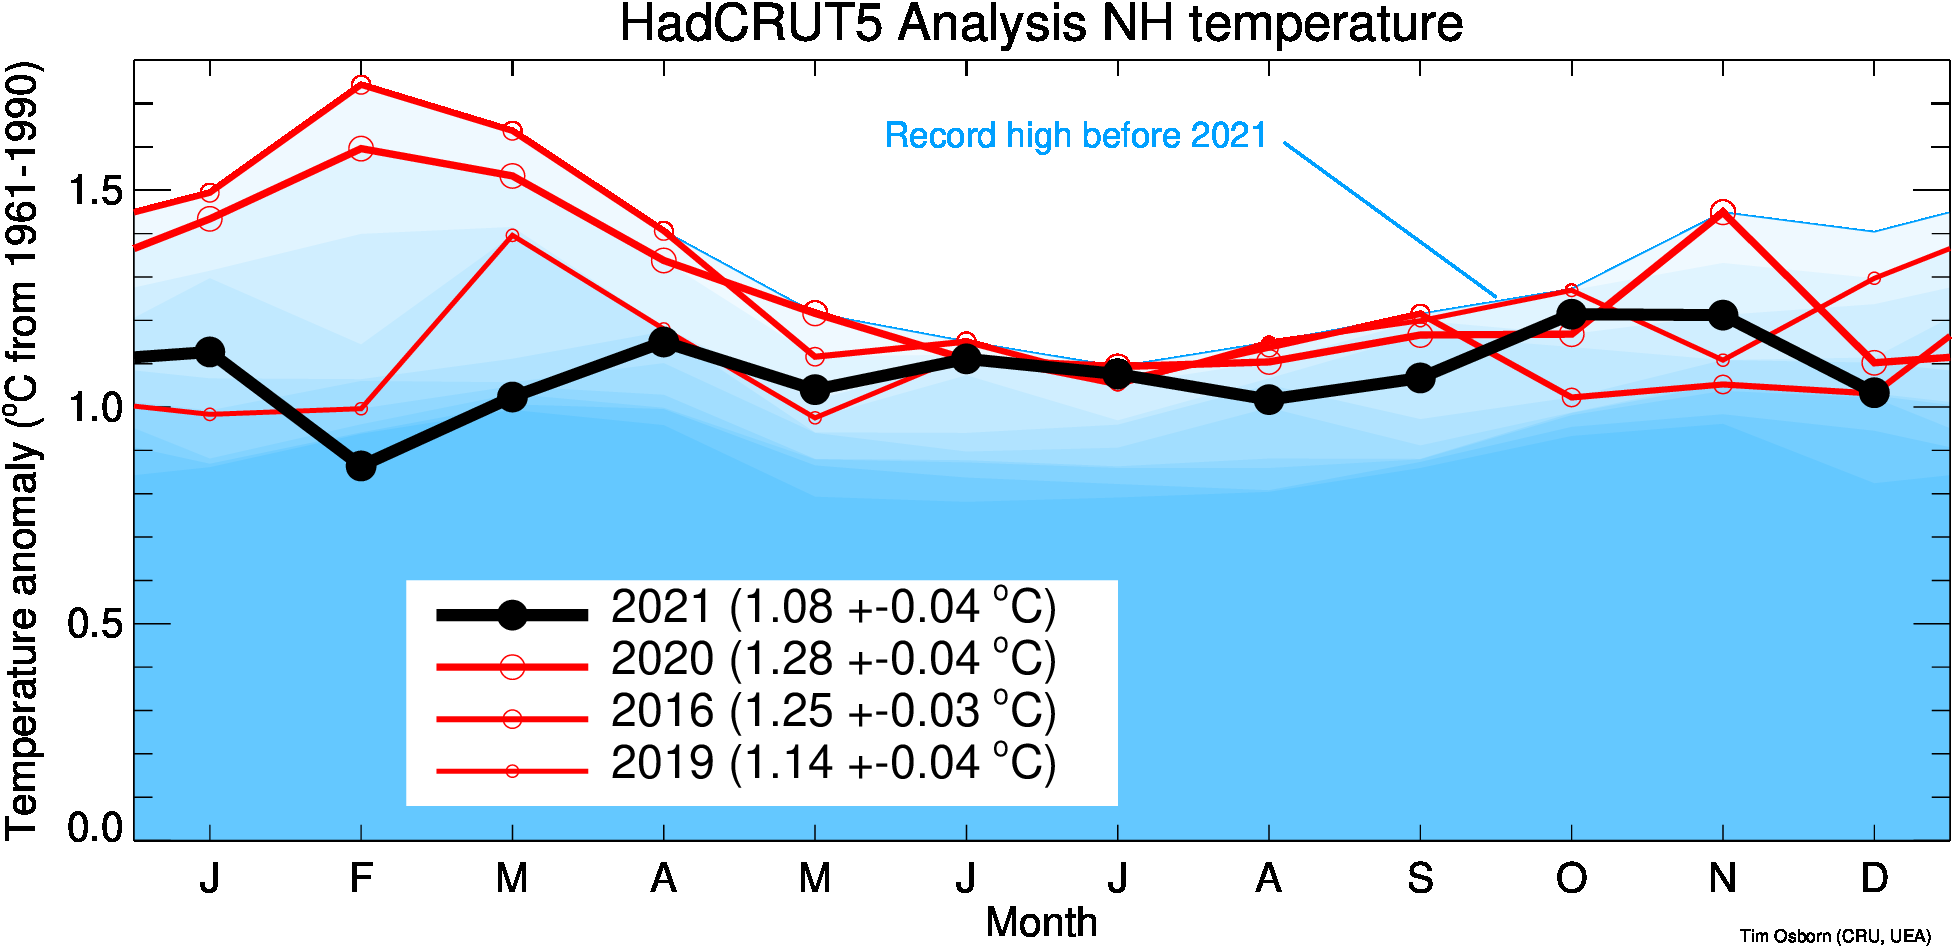
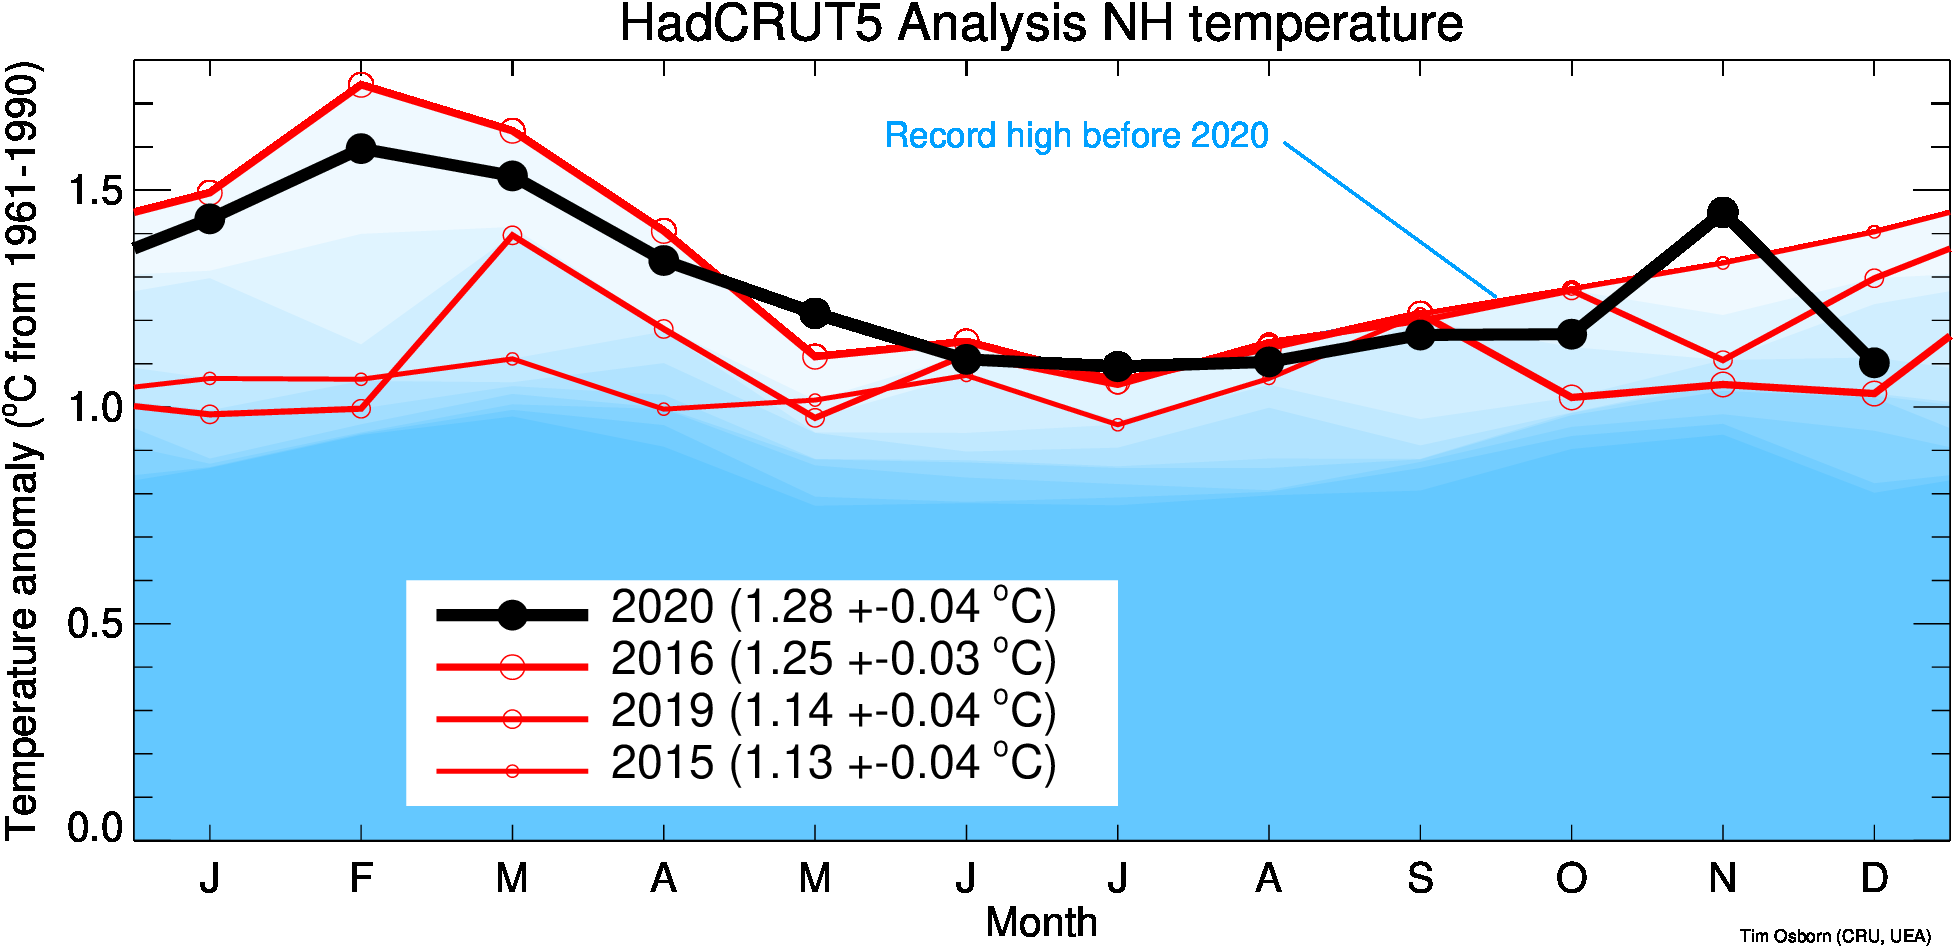
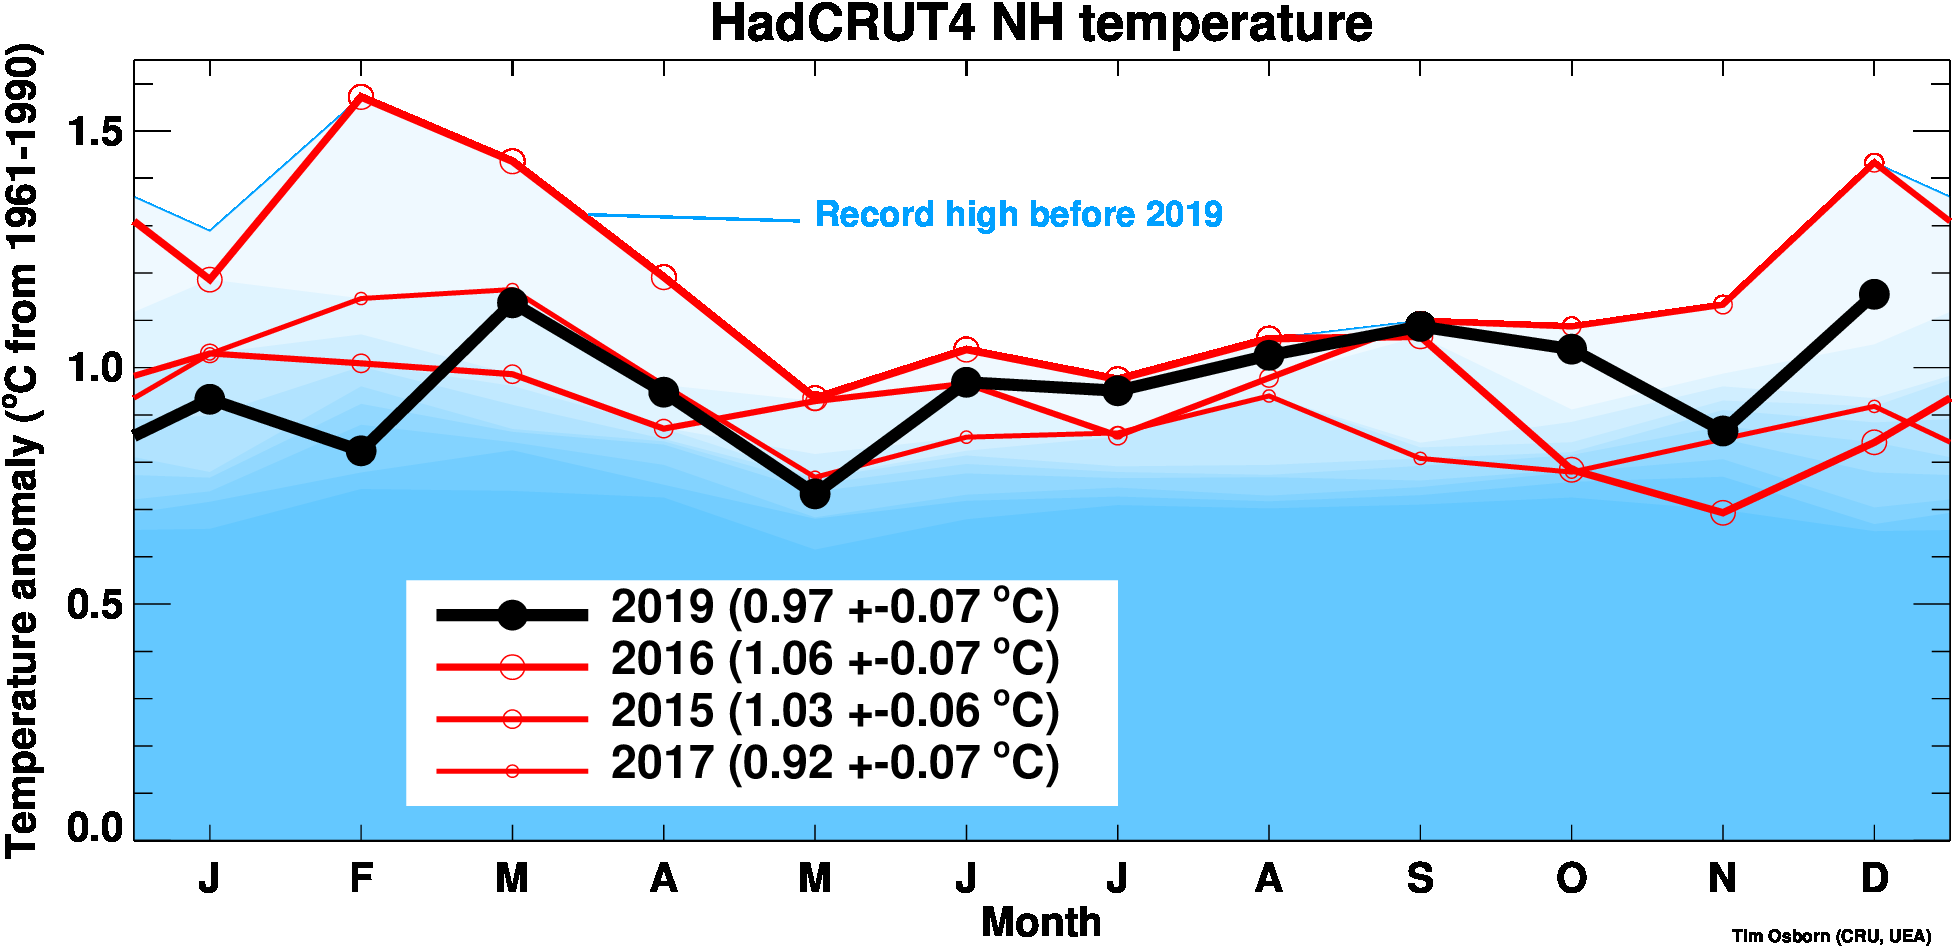
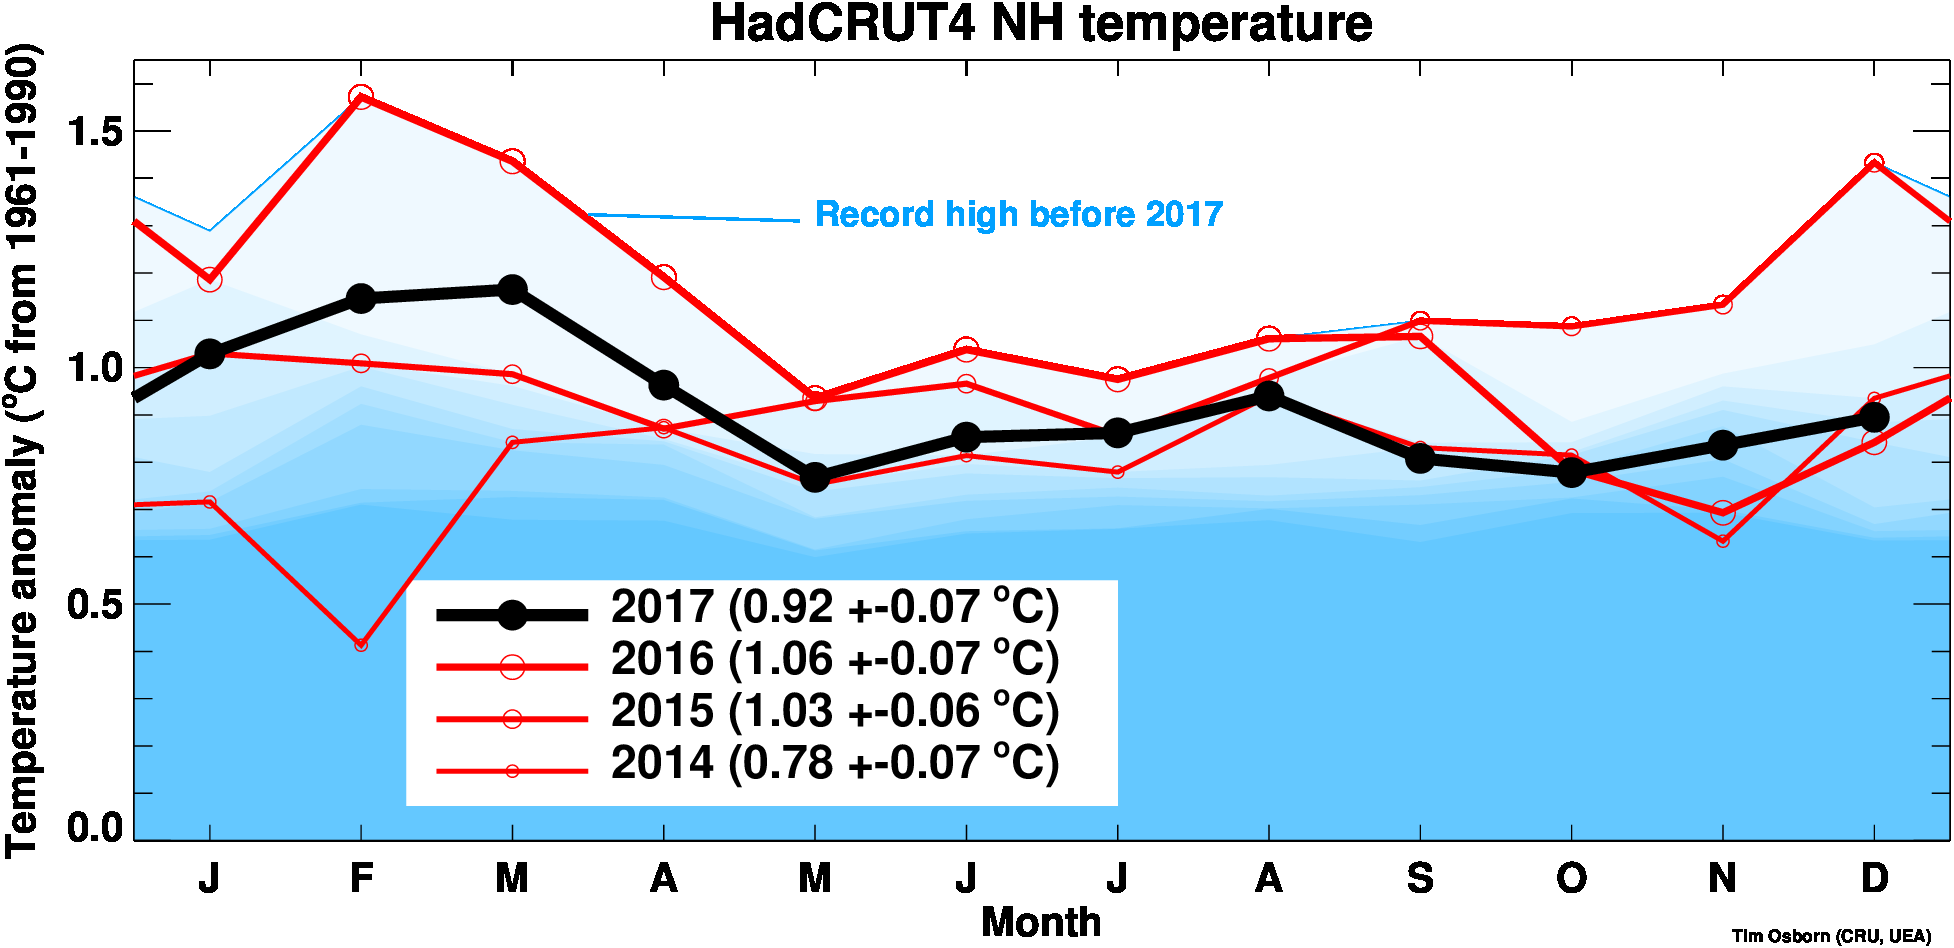
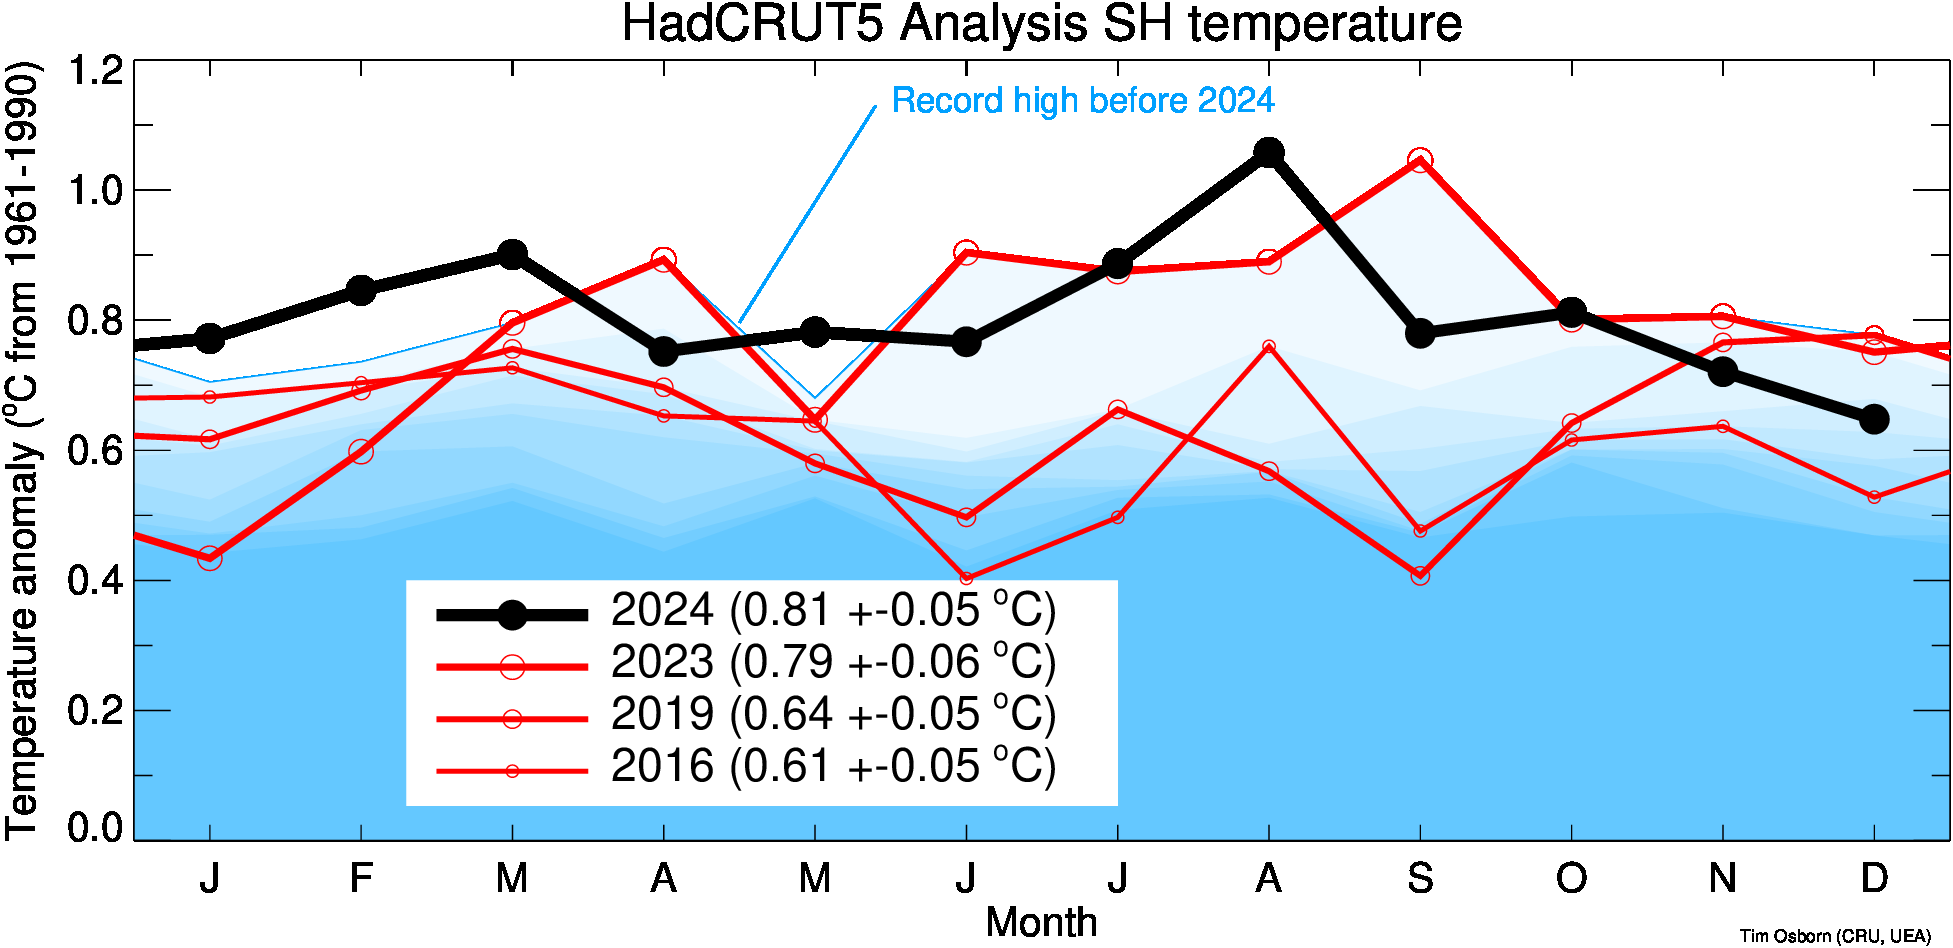
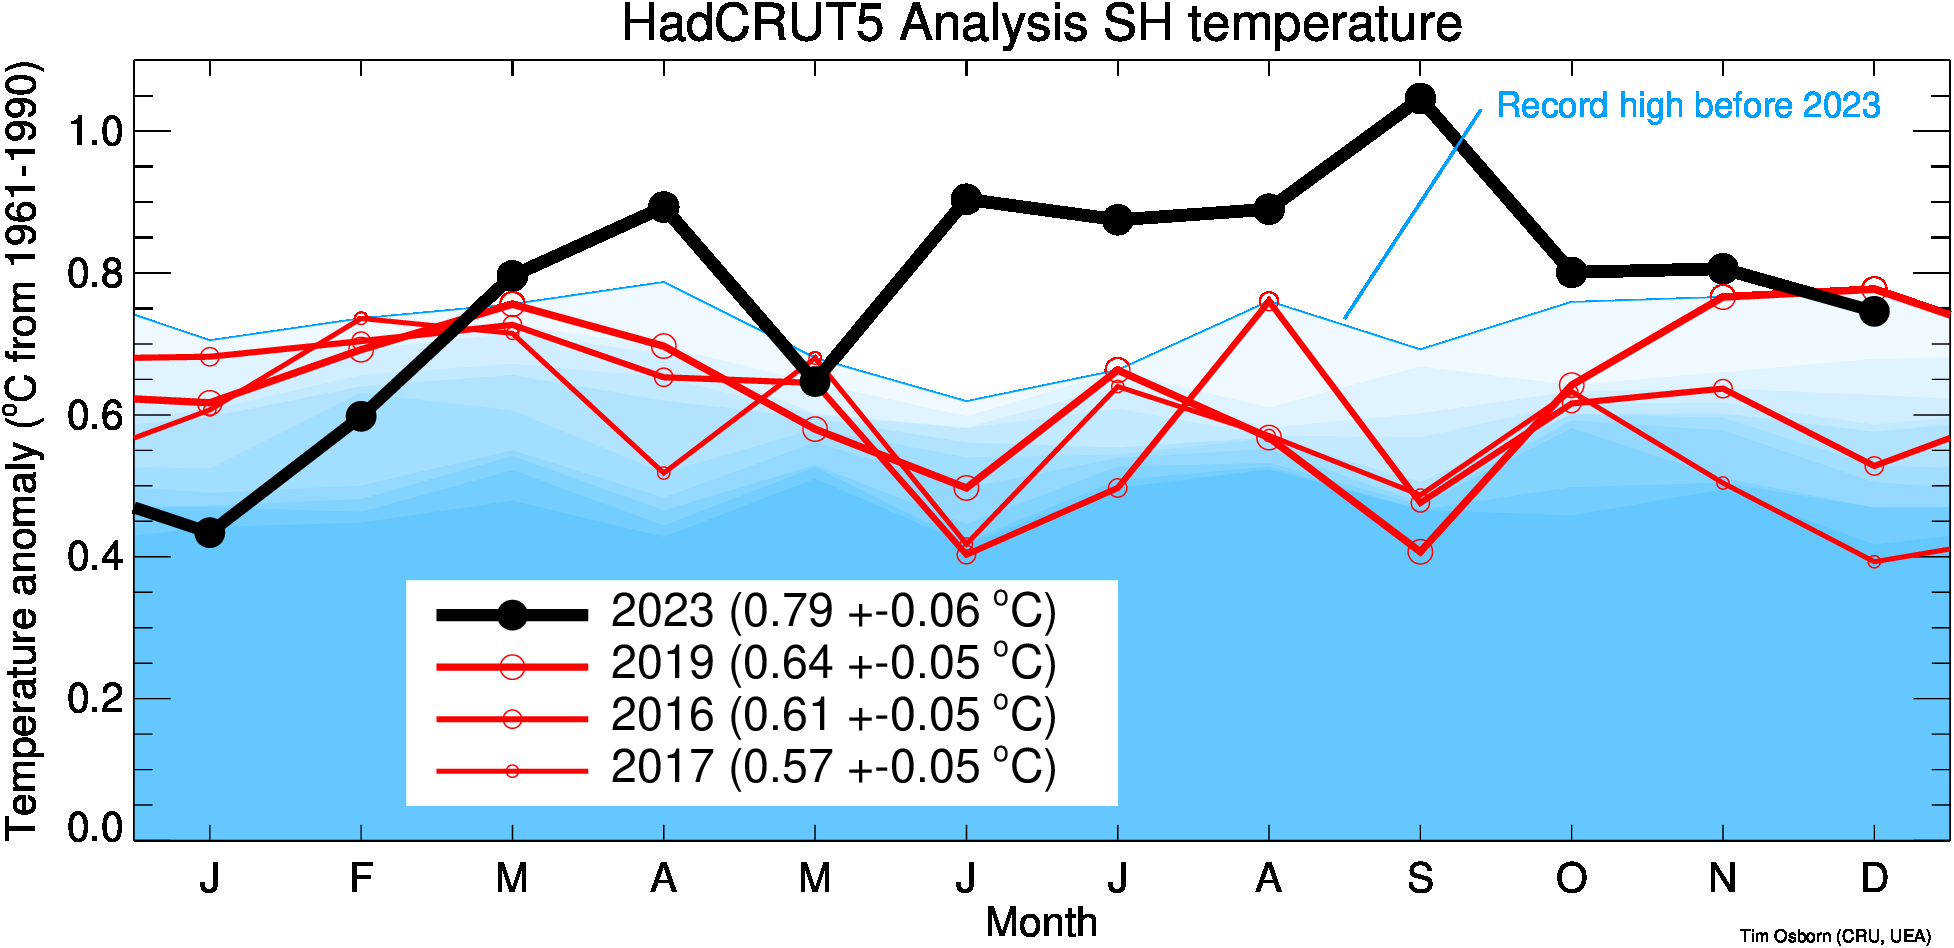
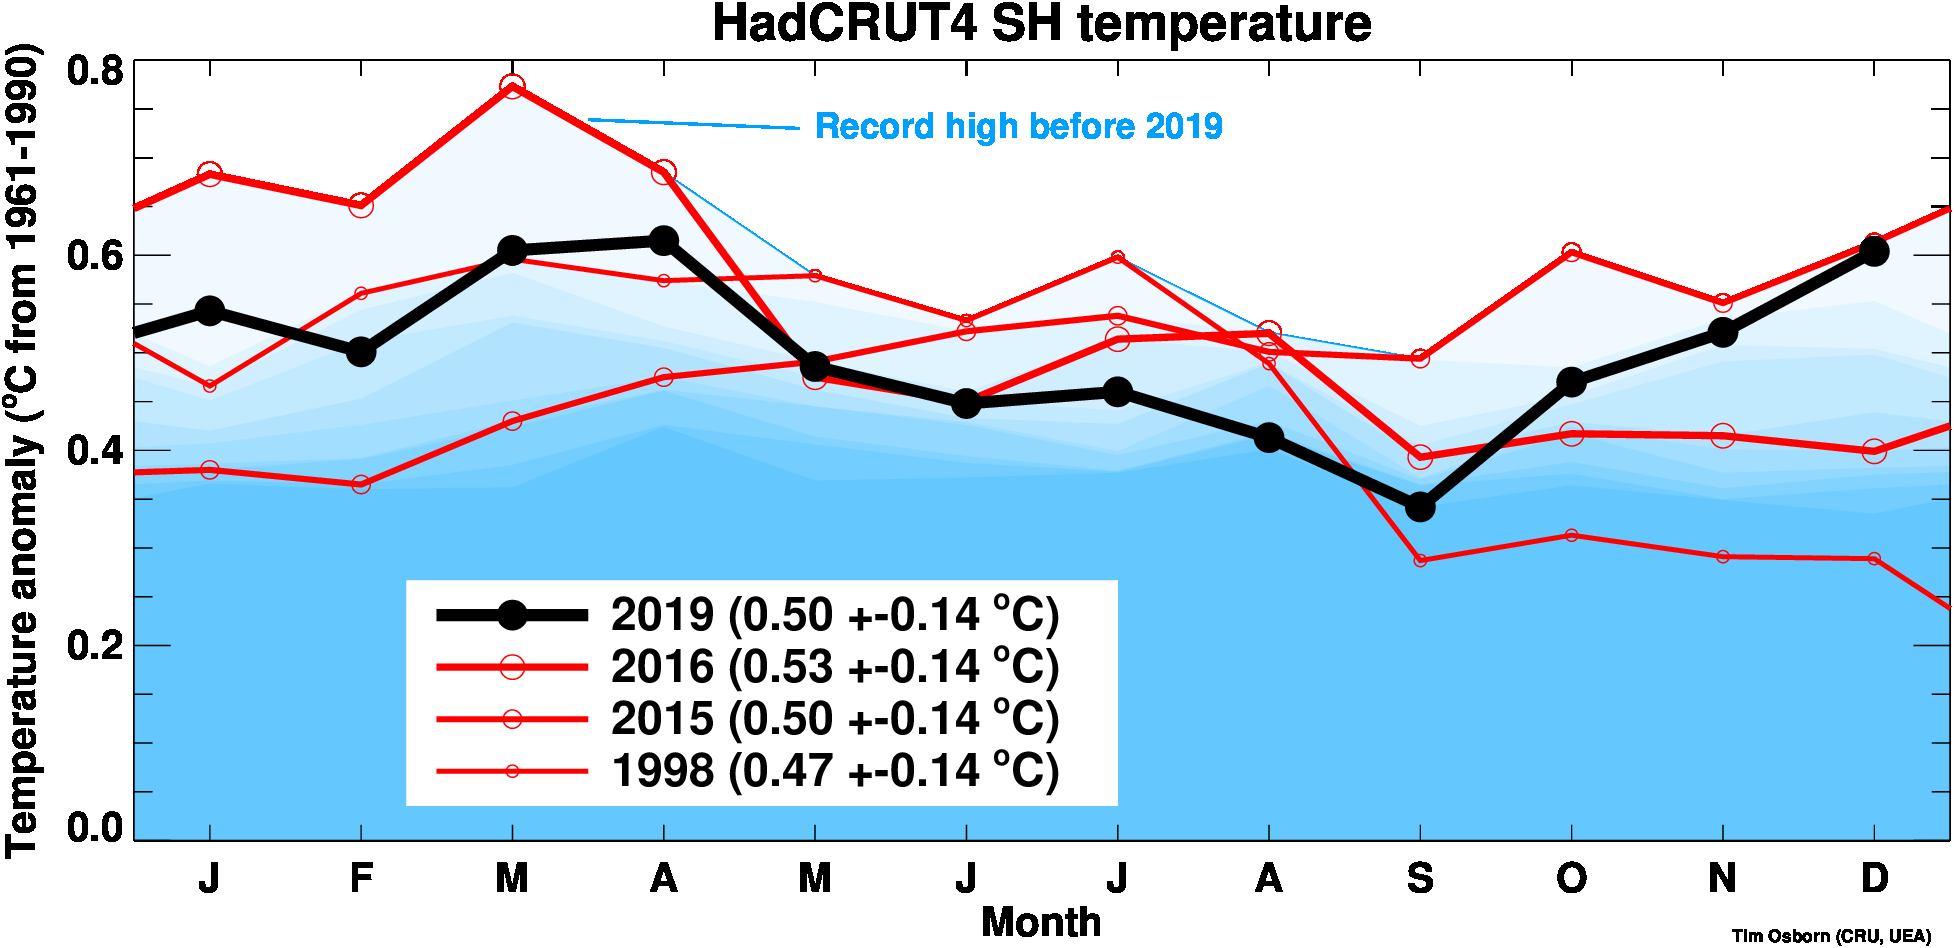
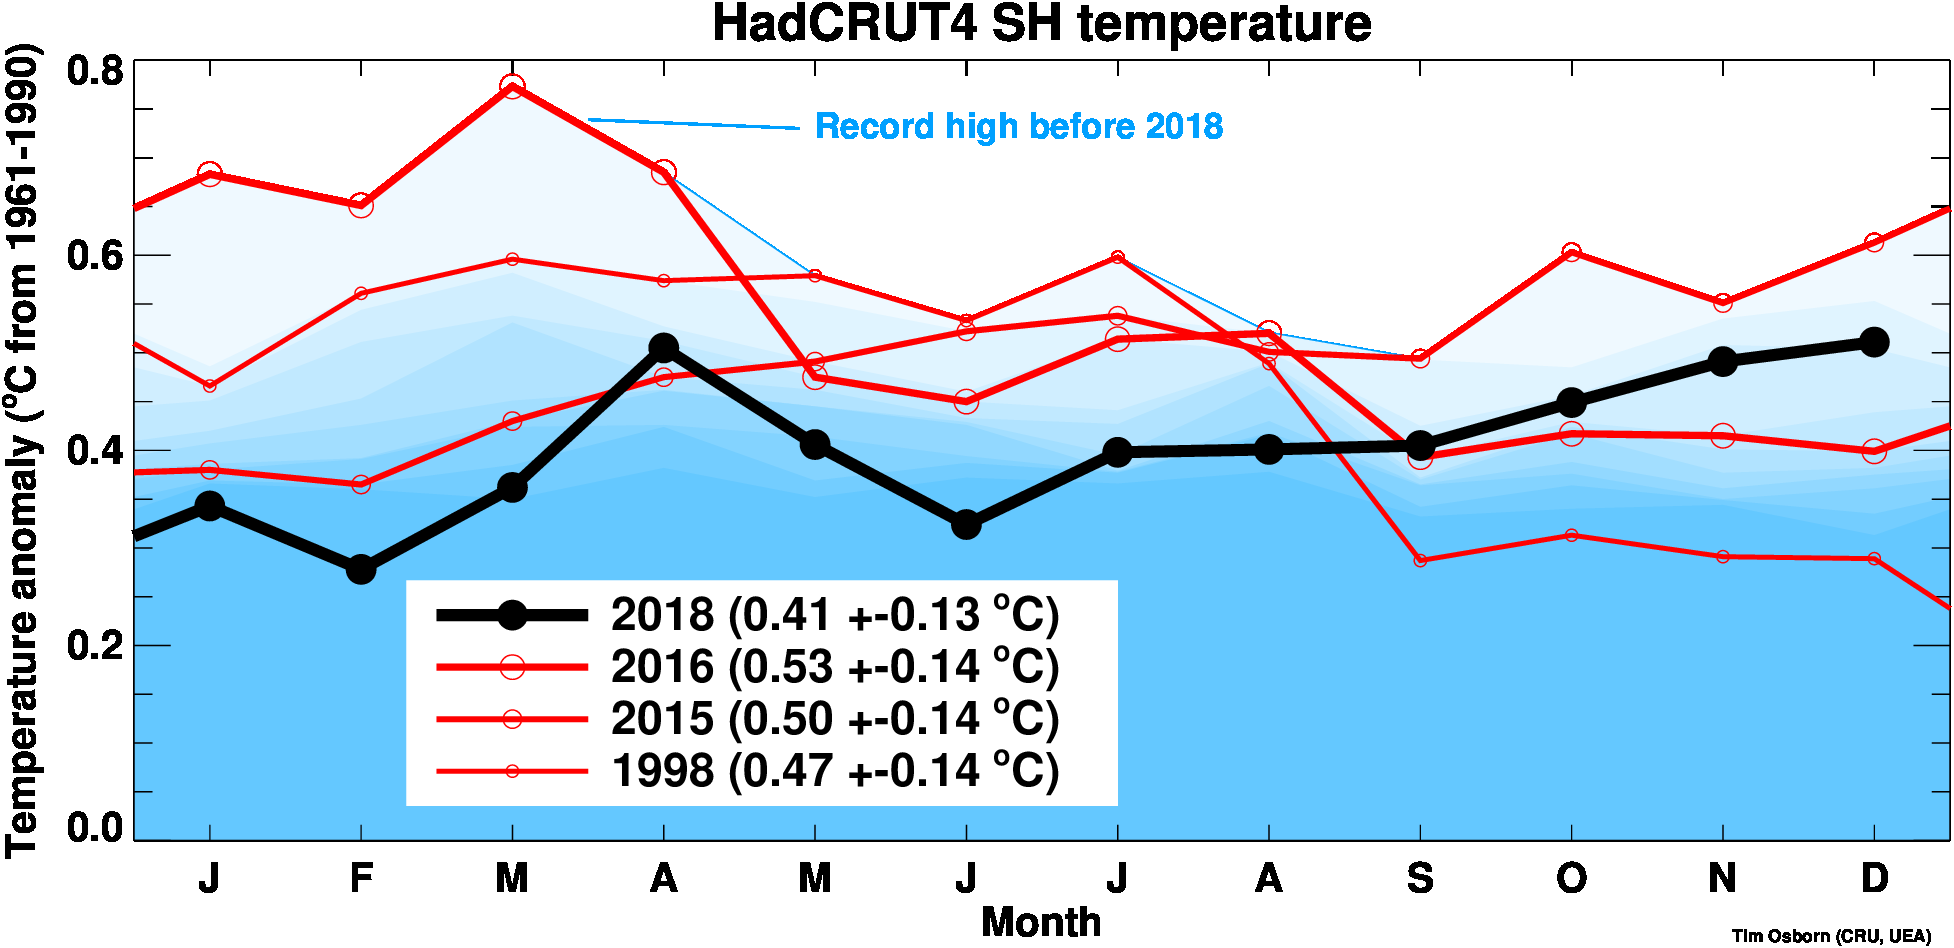
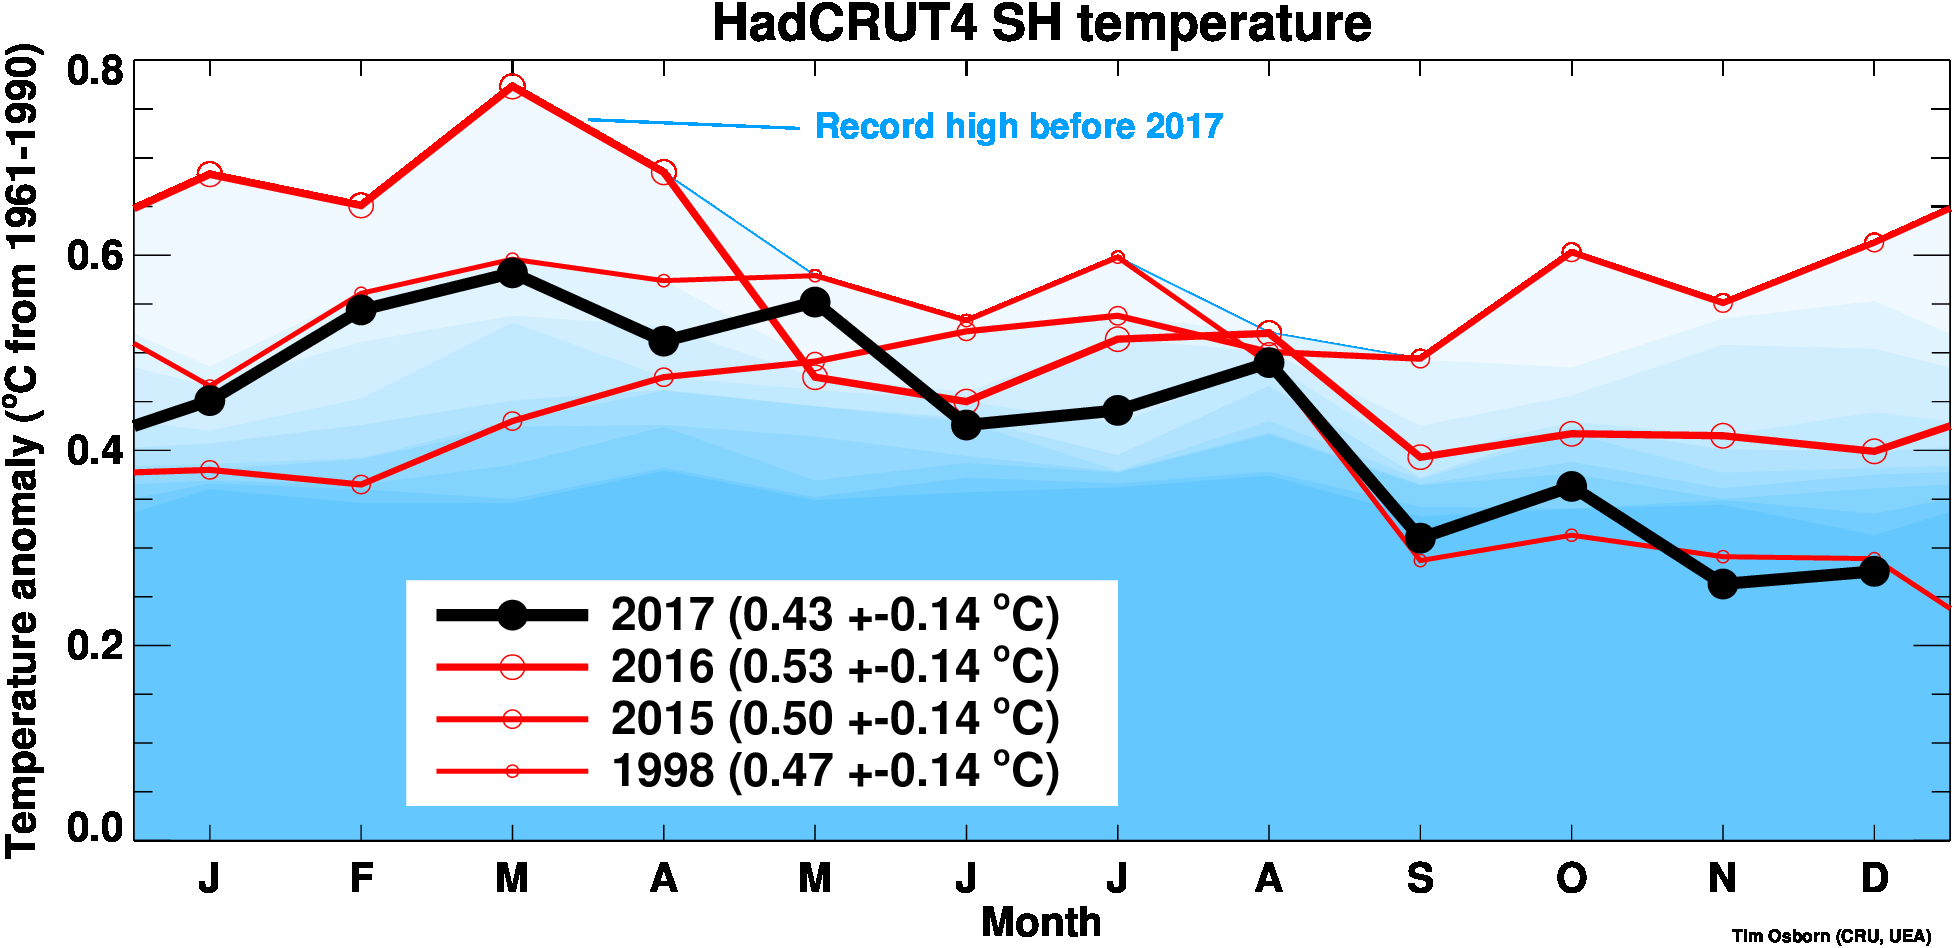
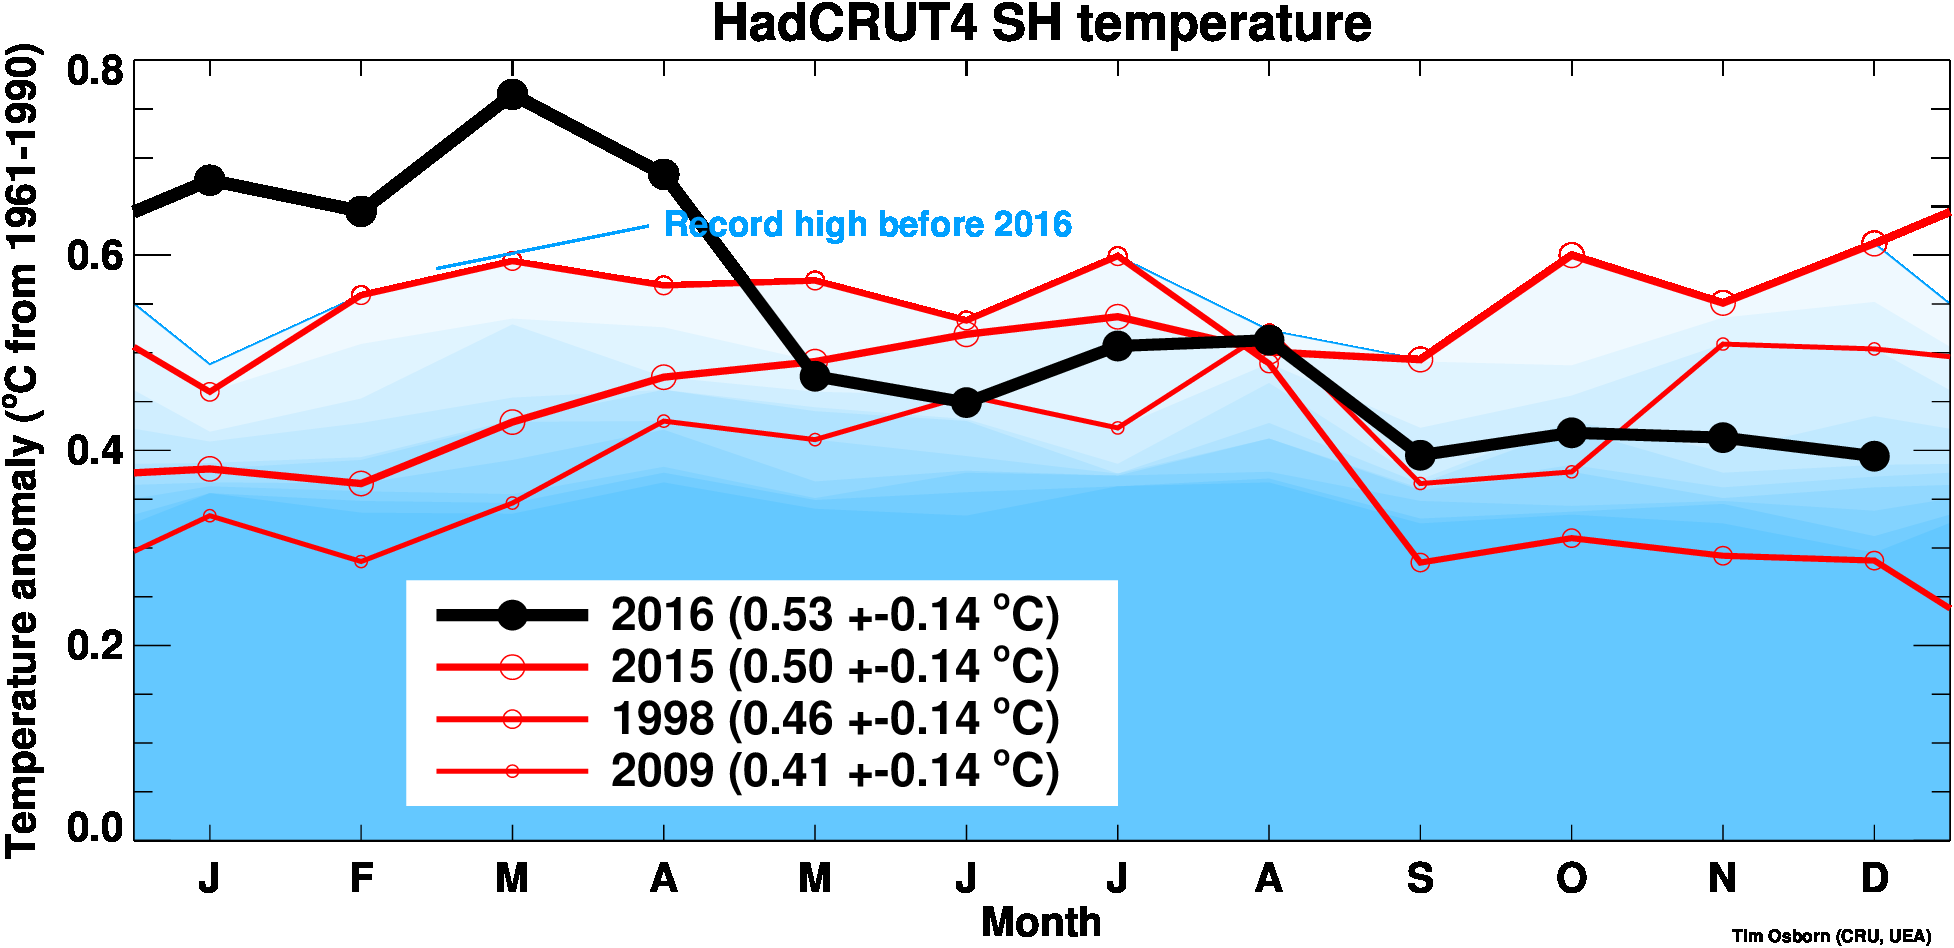
| Temperature: this year so far (more info) | ||
| Global | Northern Hemisphere | Southern Hemisphere |

Click for larger image |

Click for larger image |
Click for larger image |
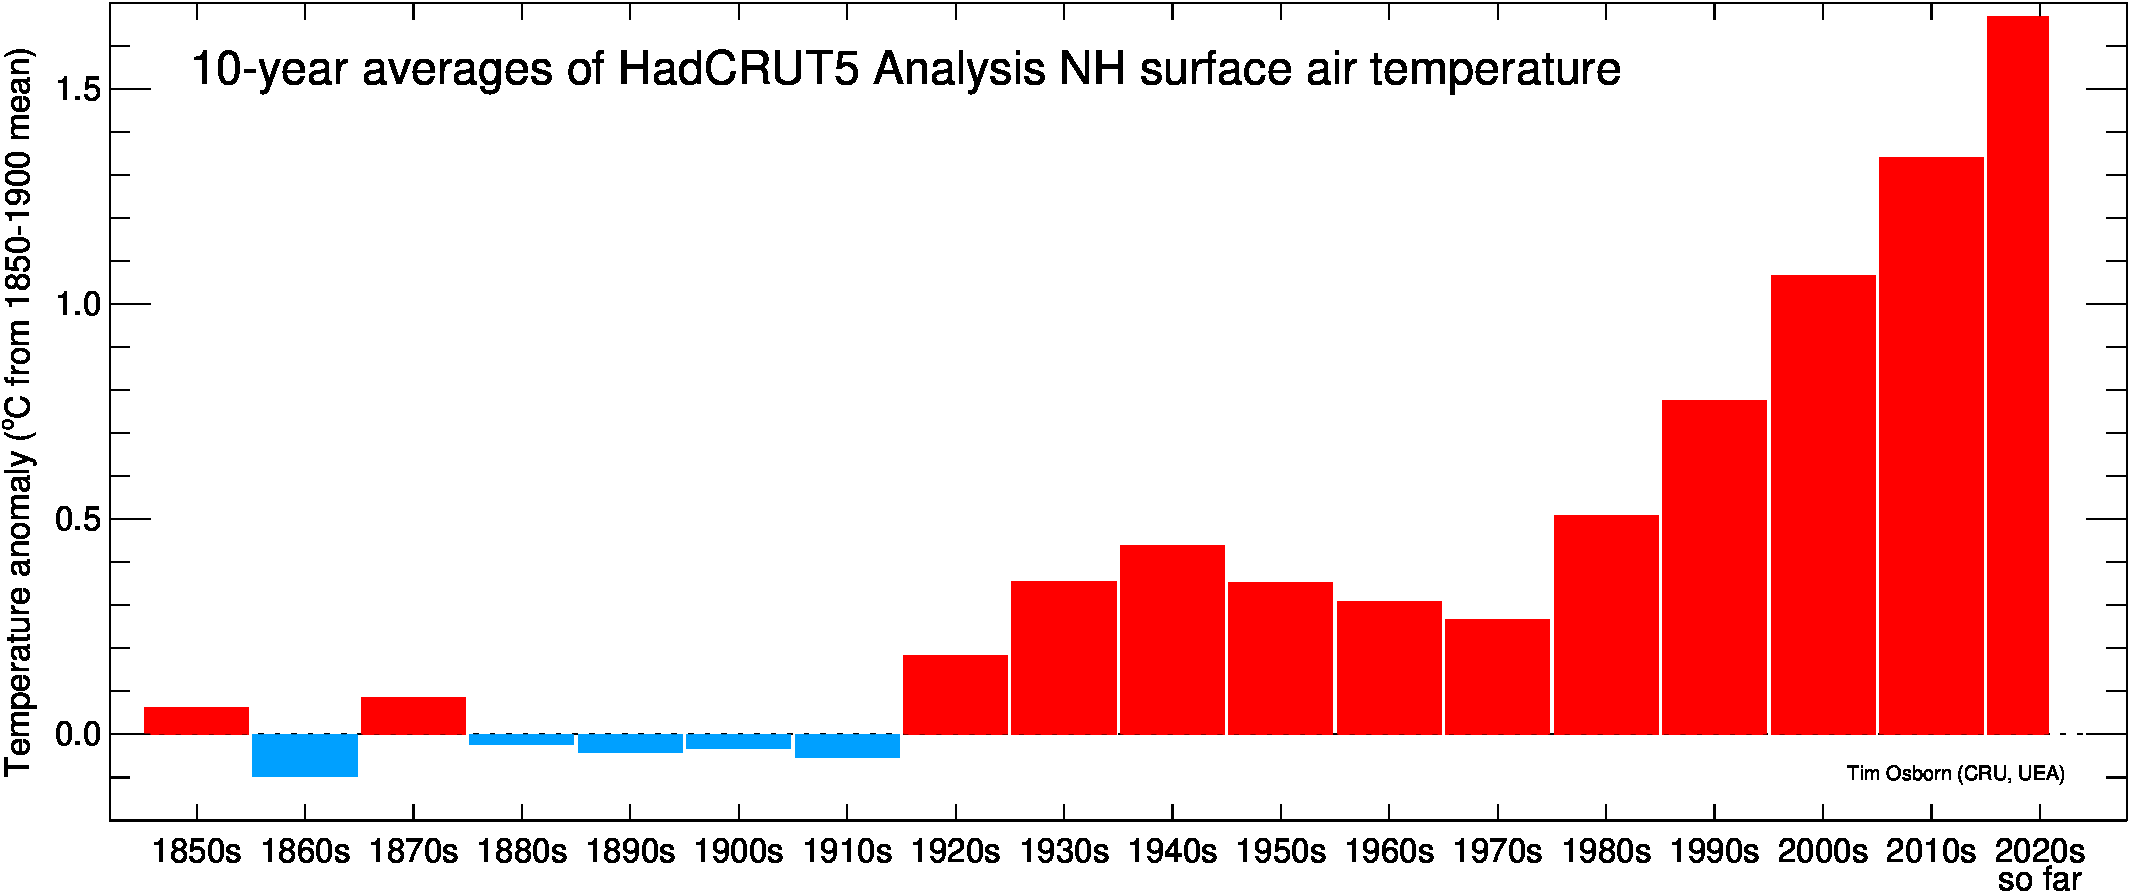
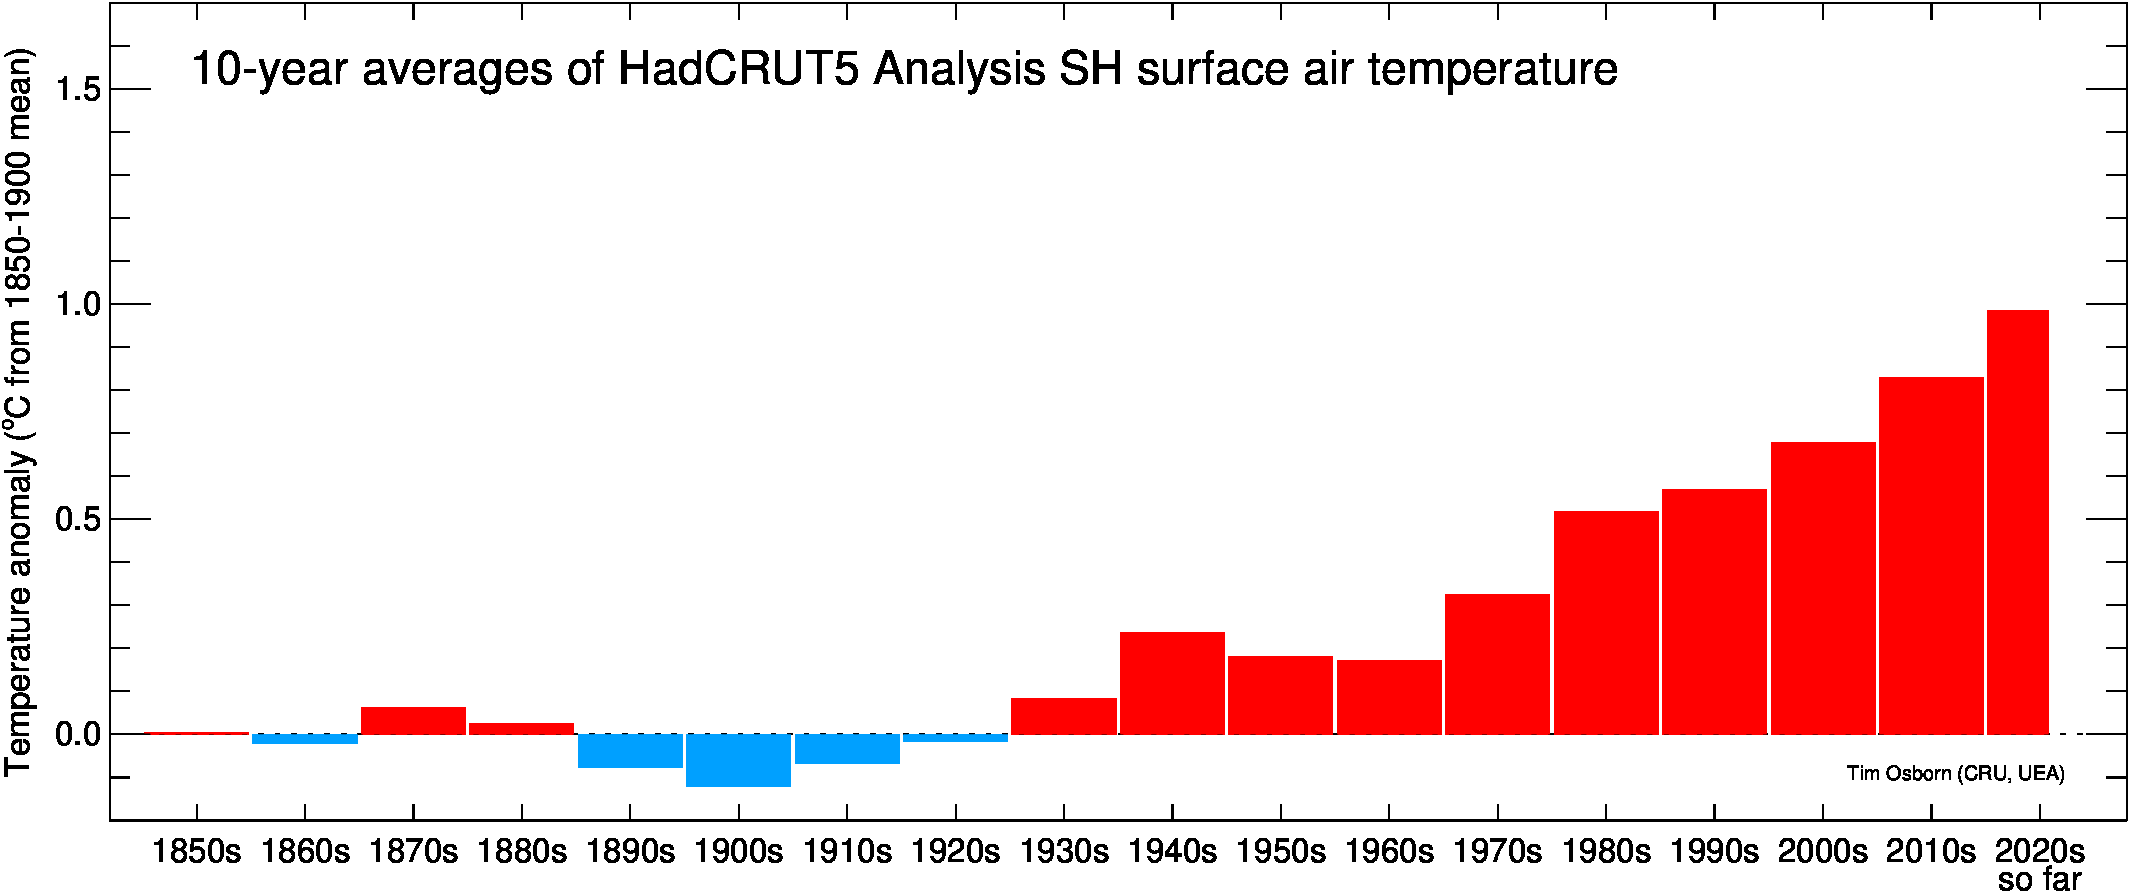
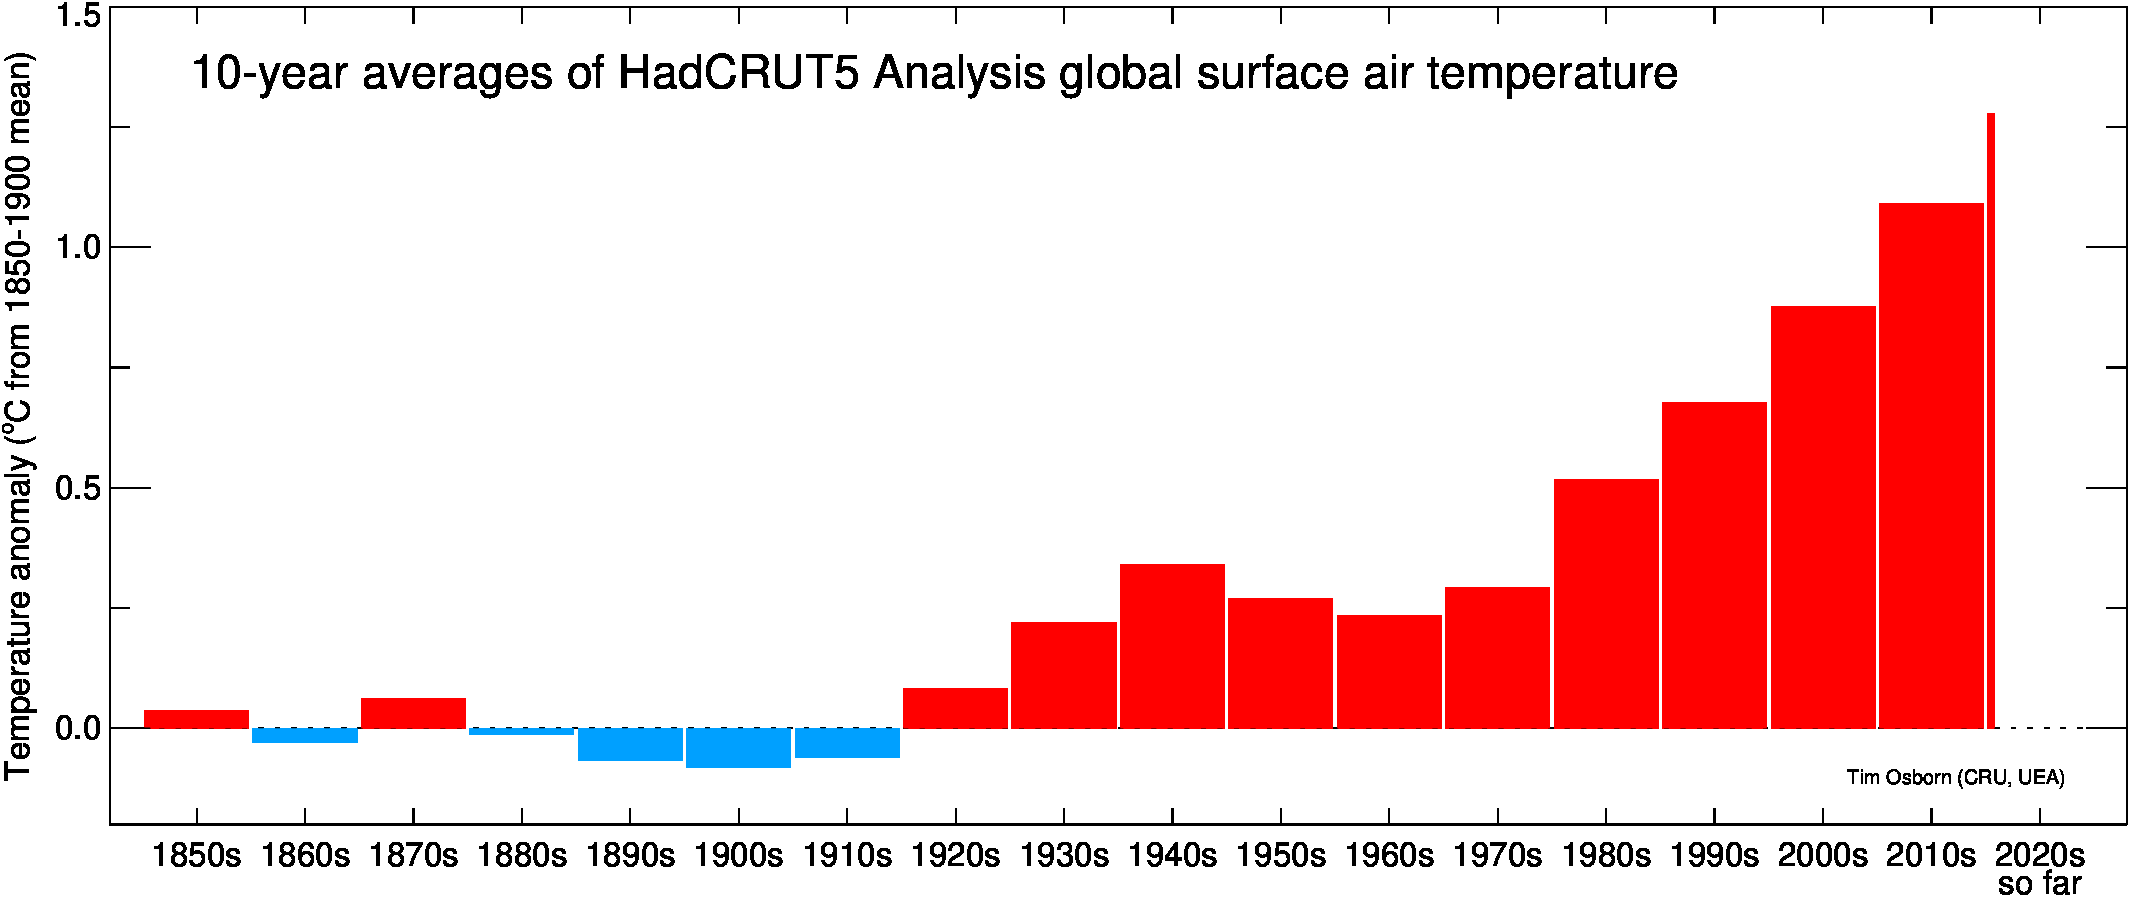
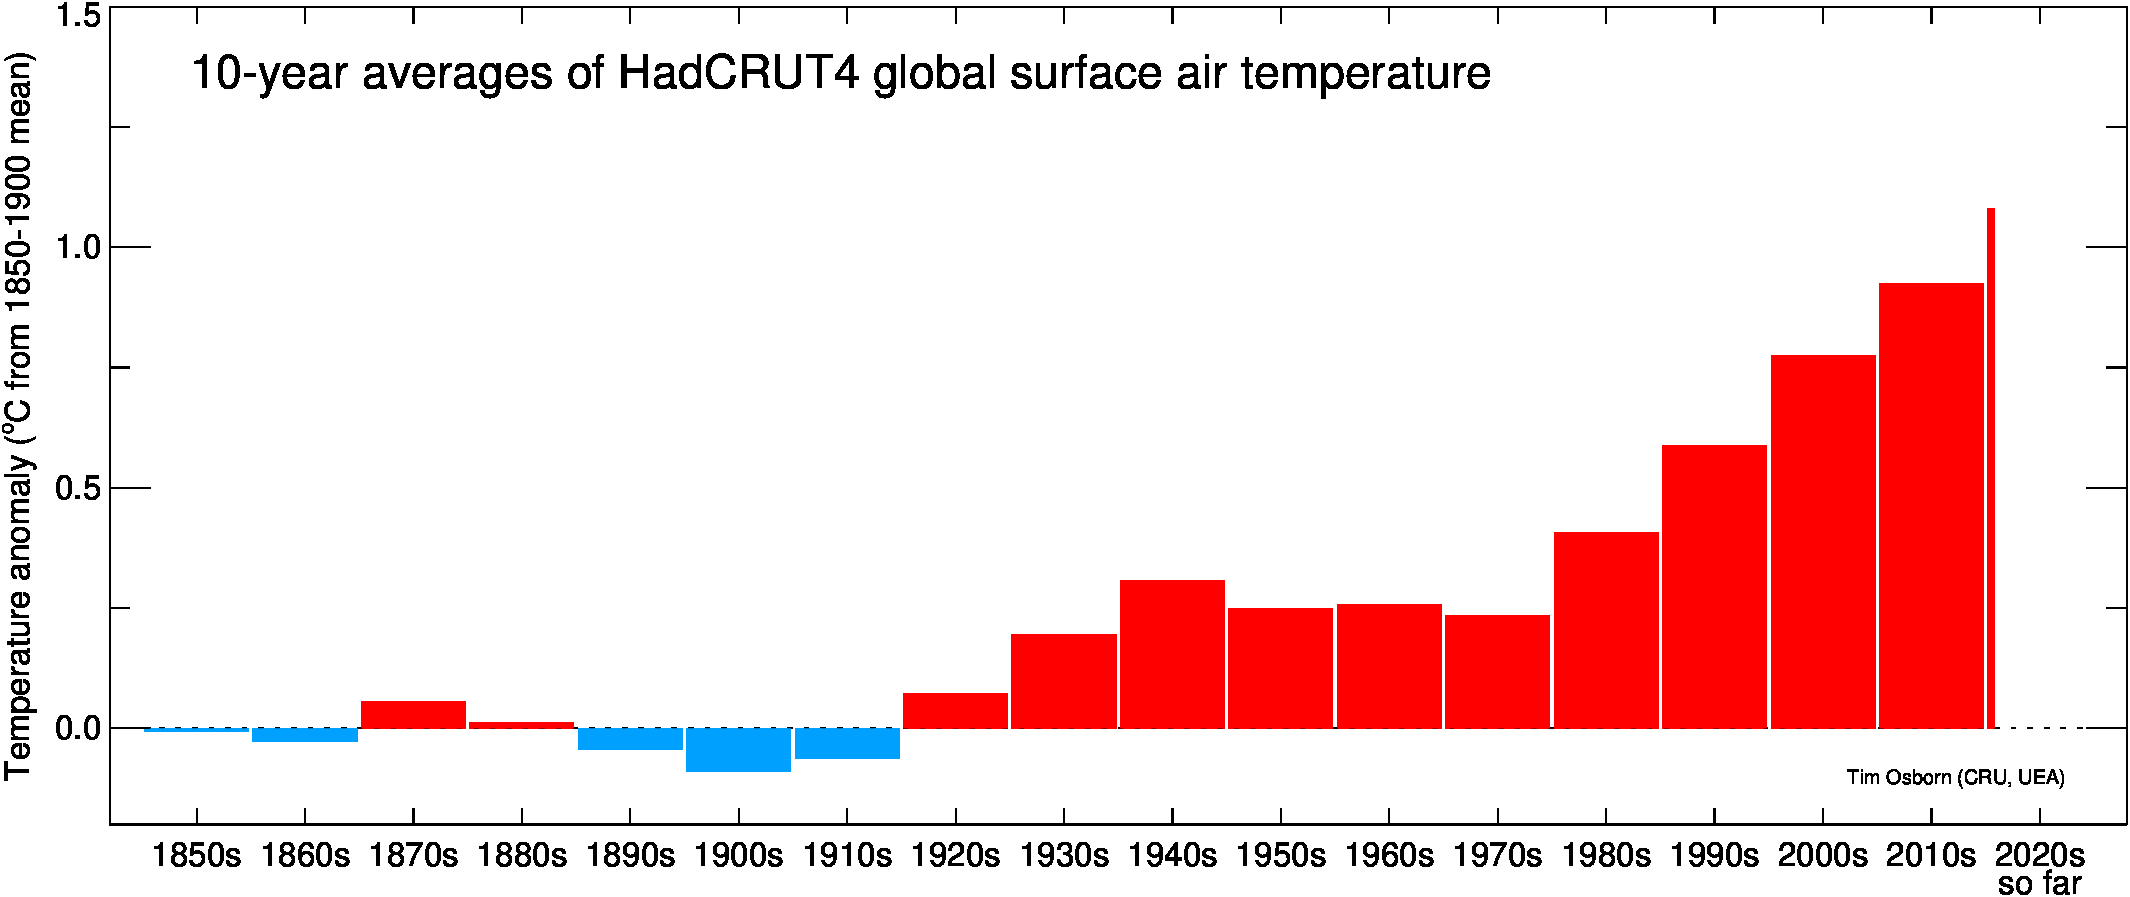
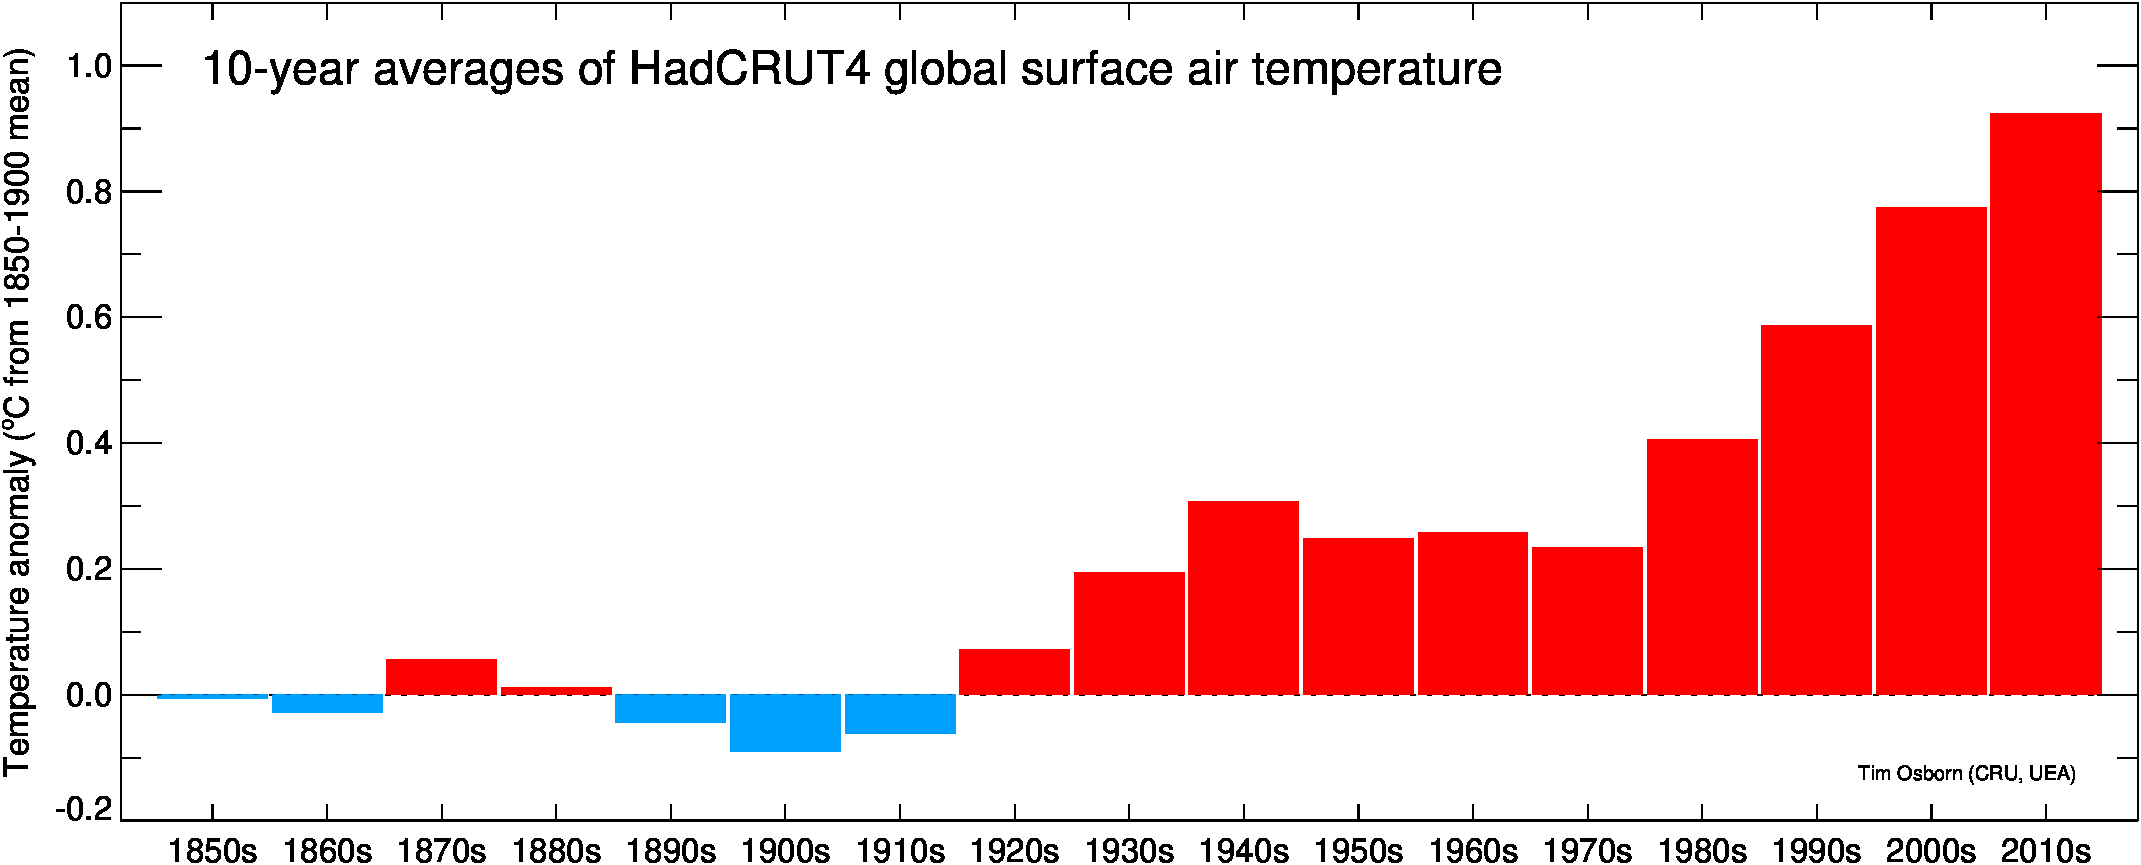
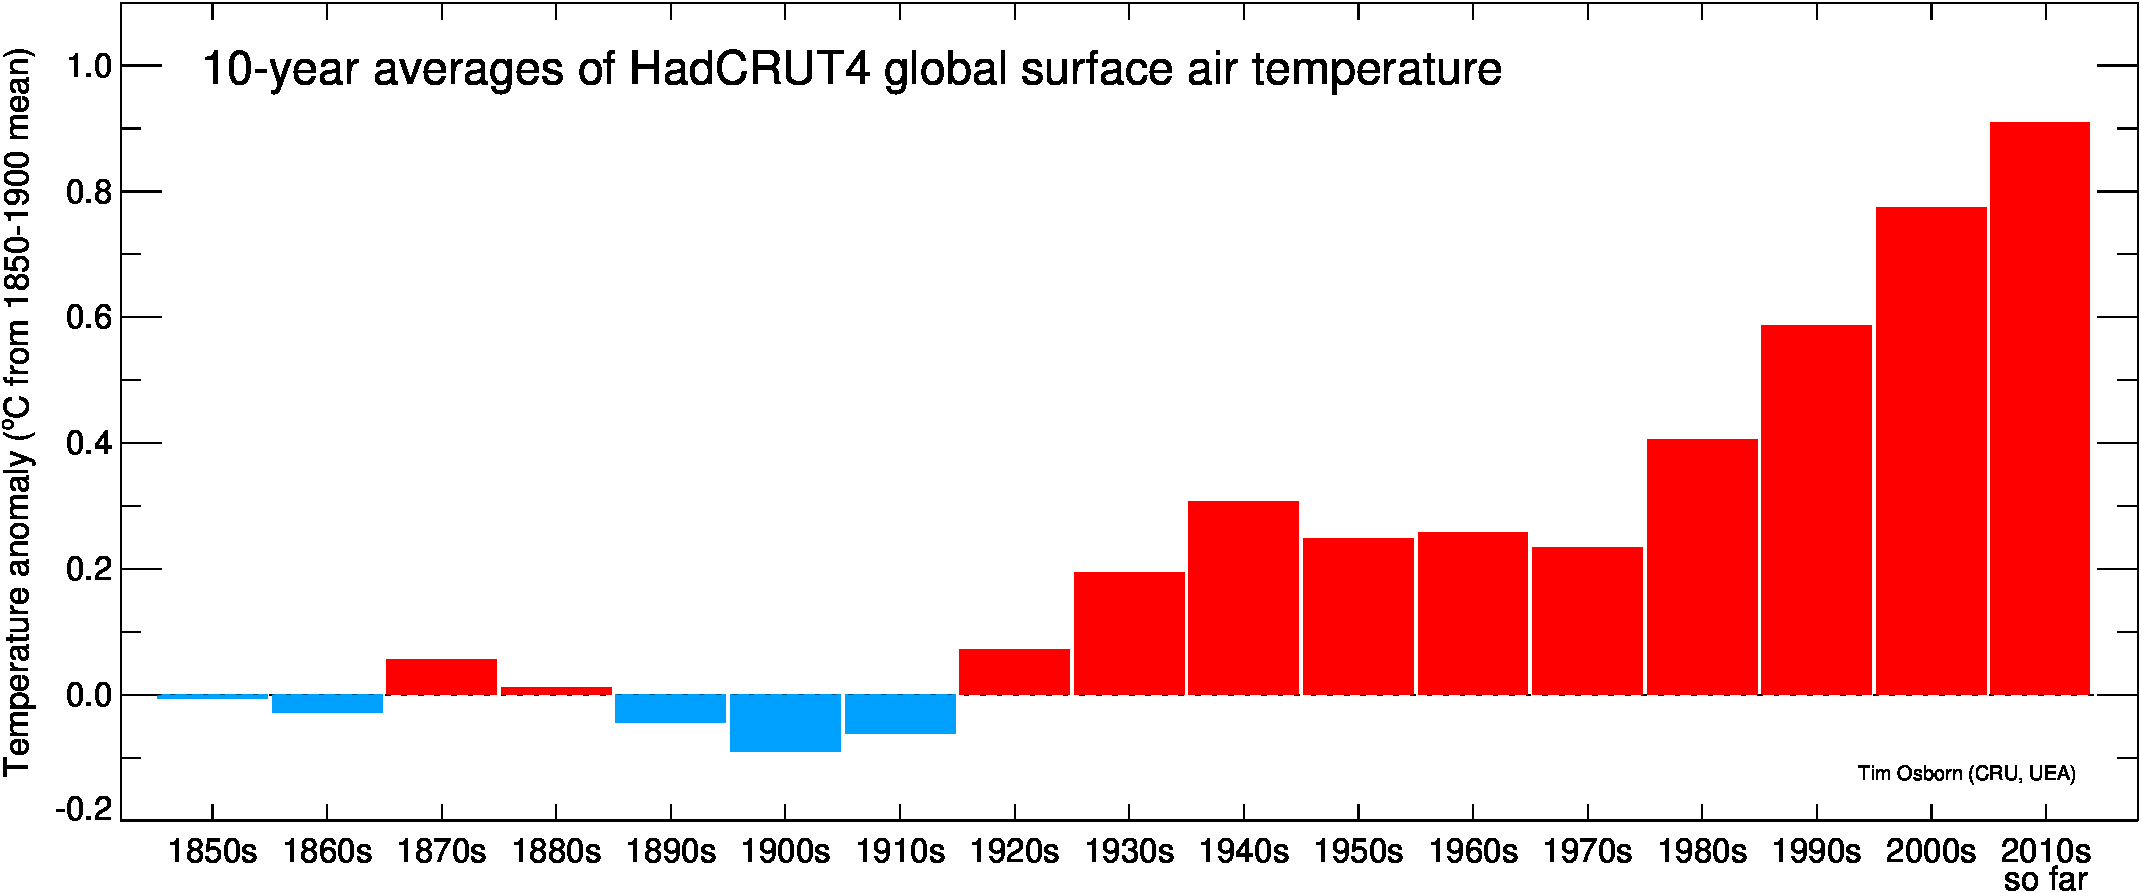
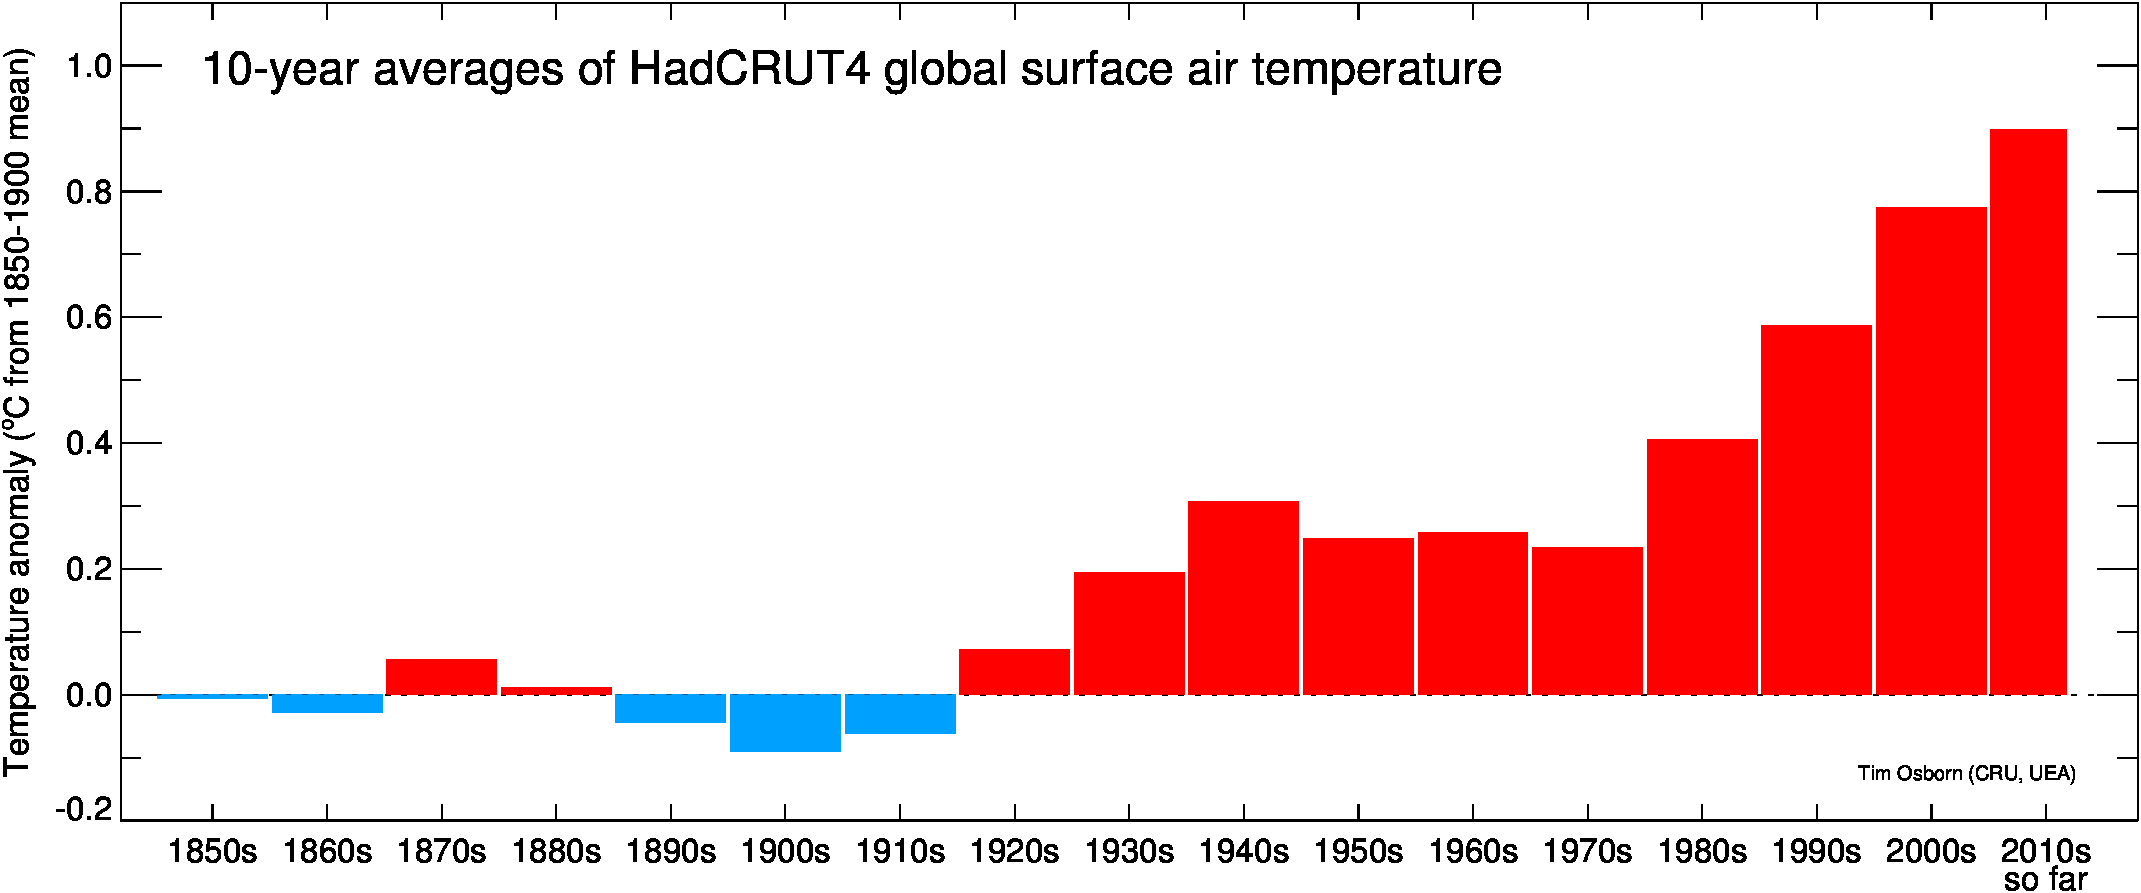
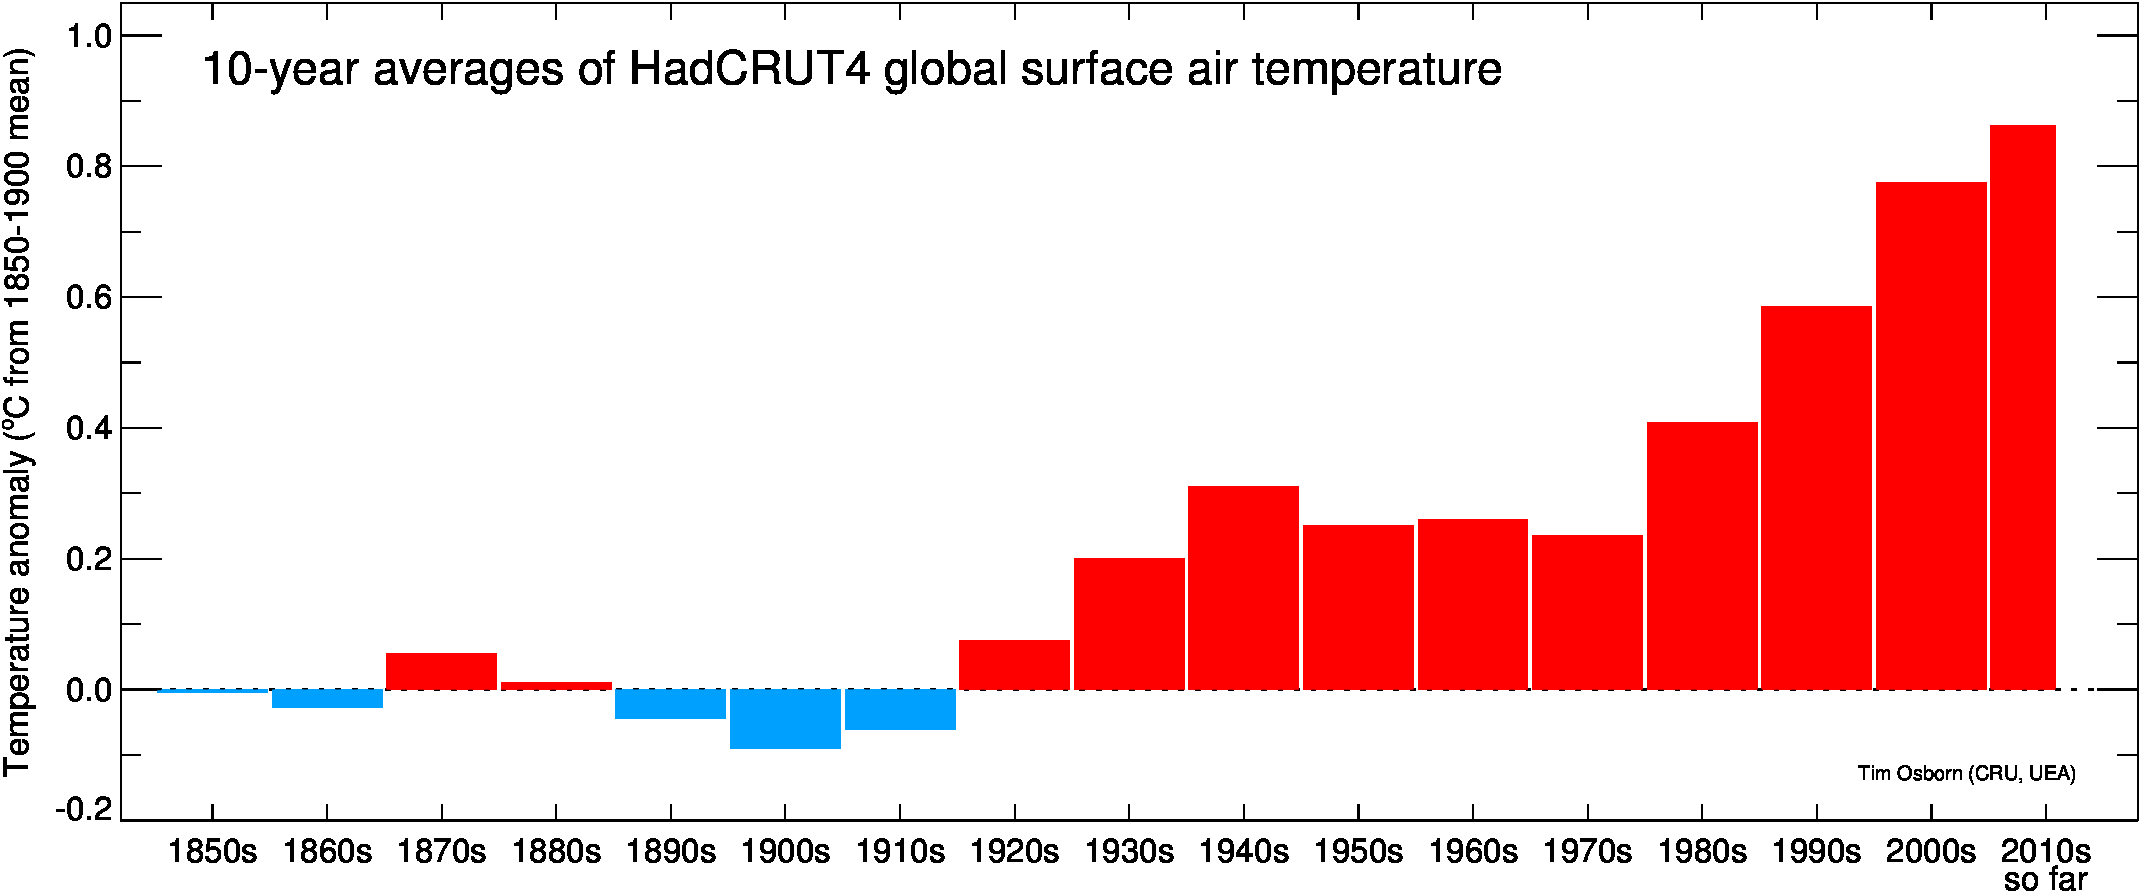
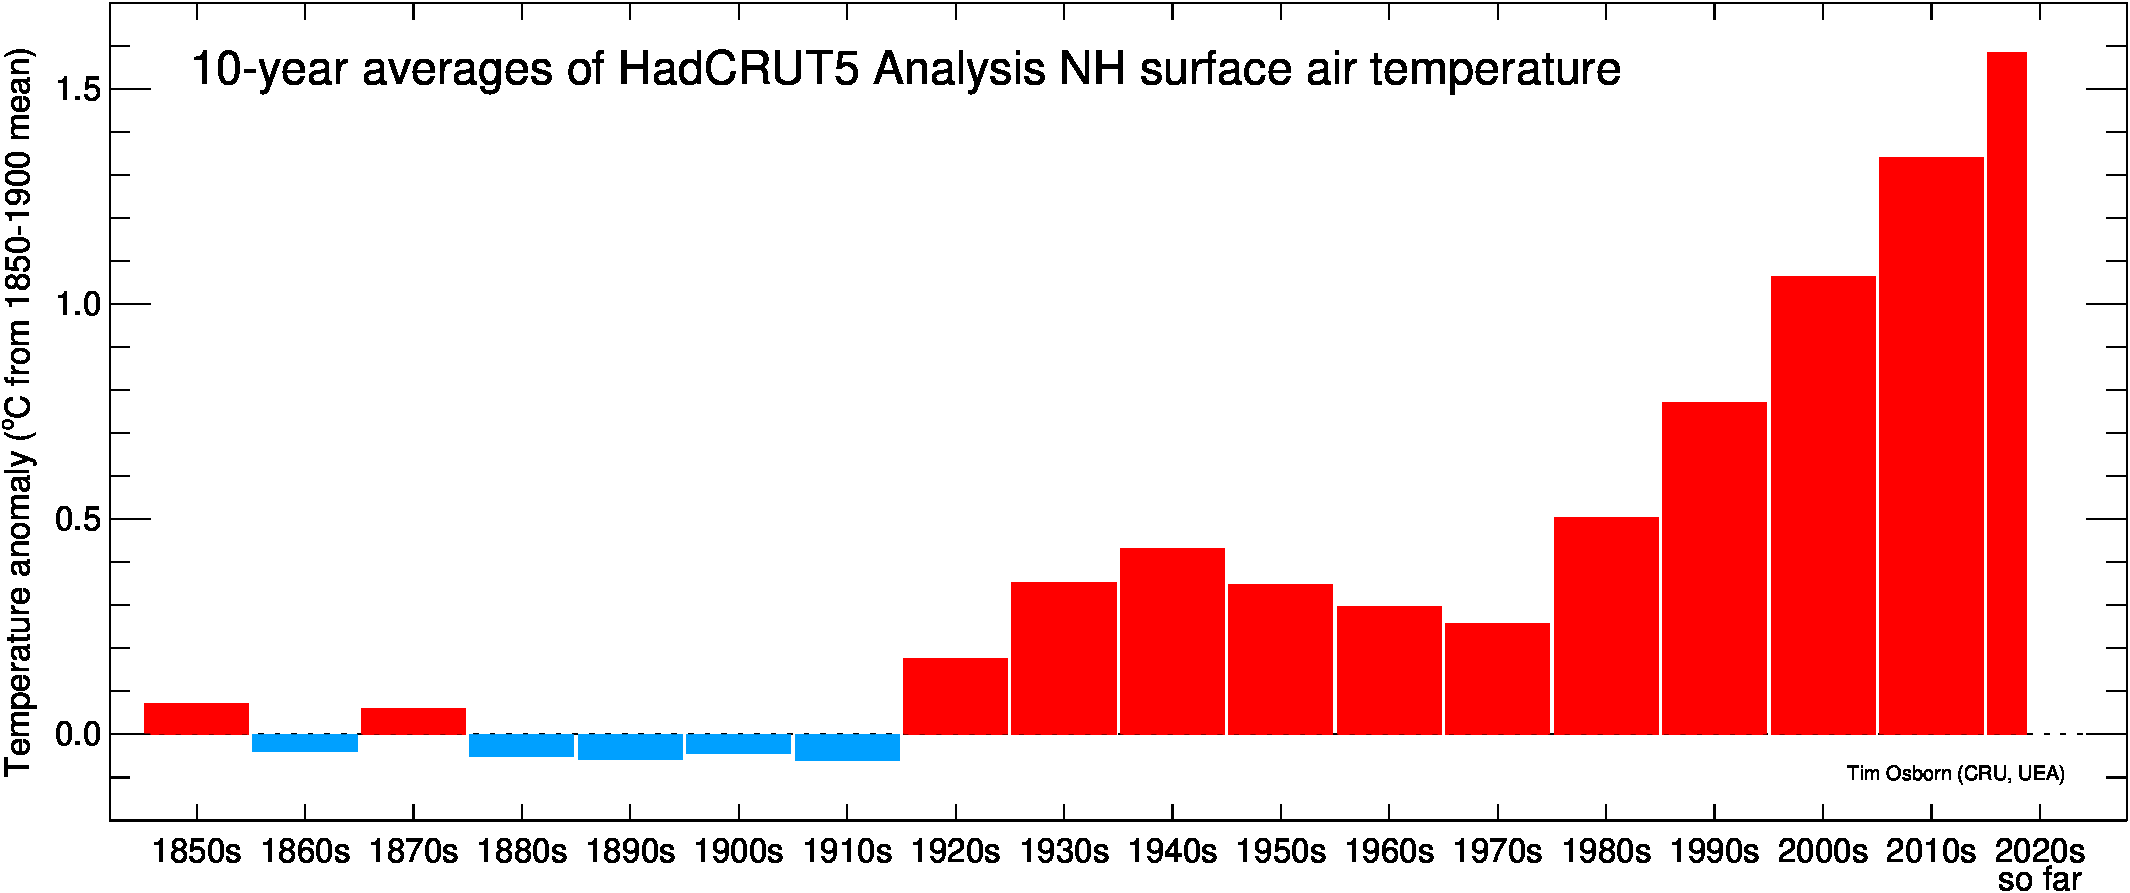
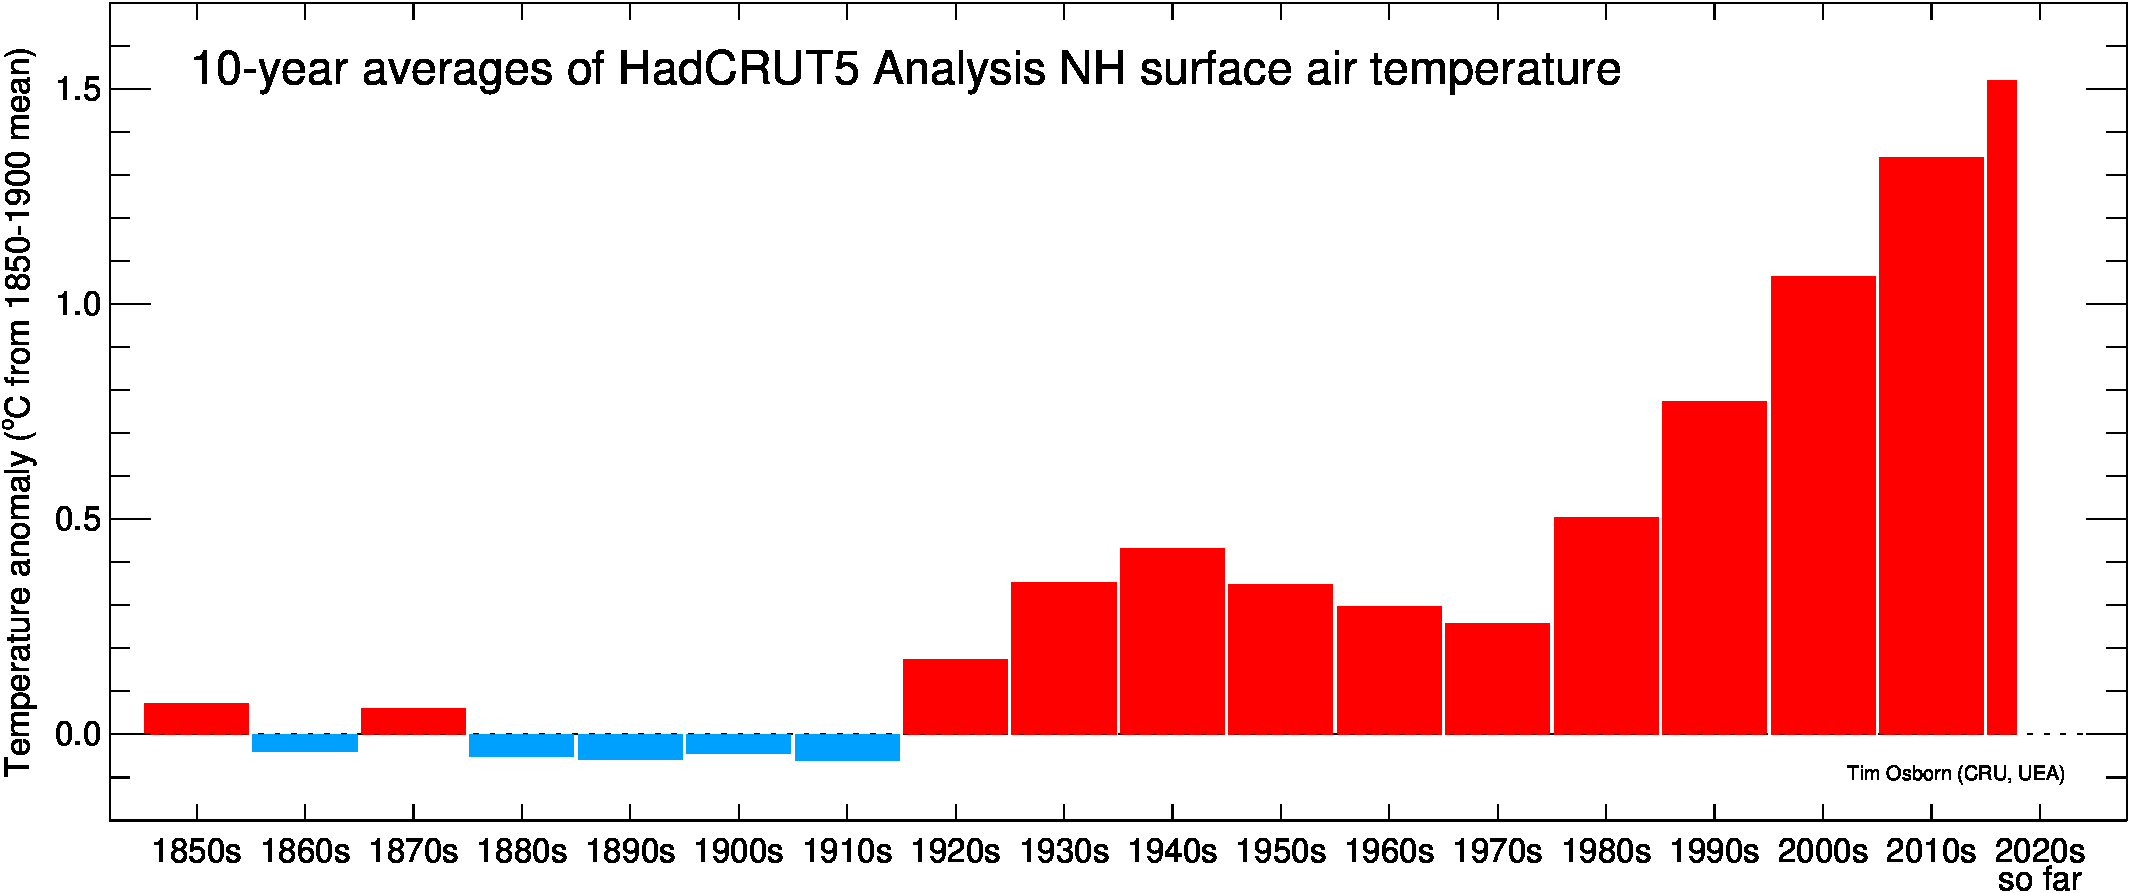
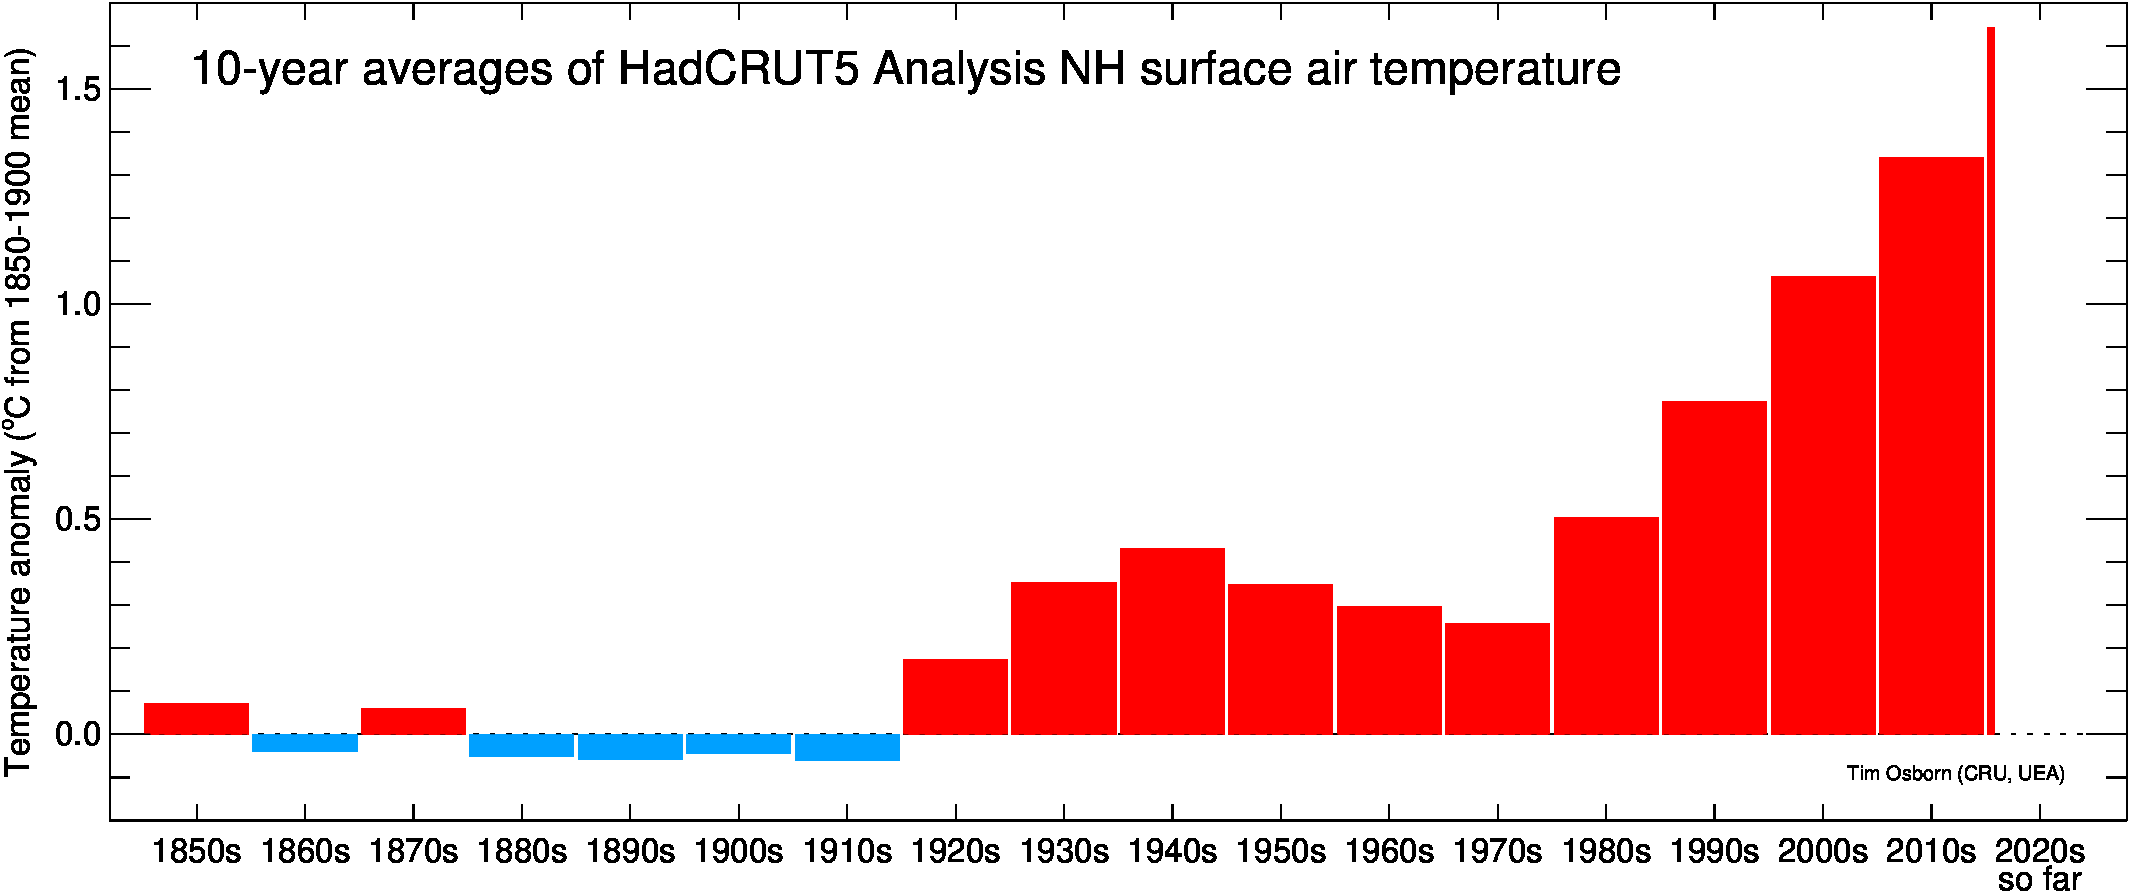
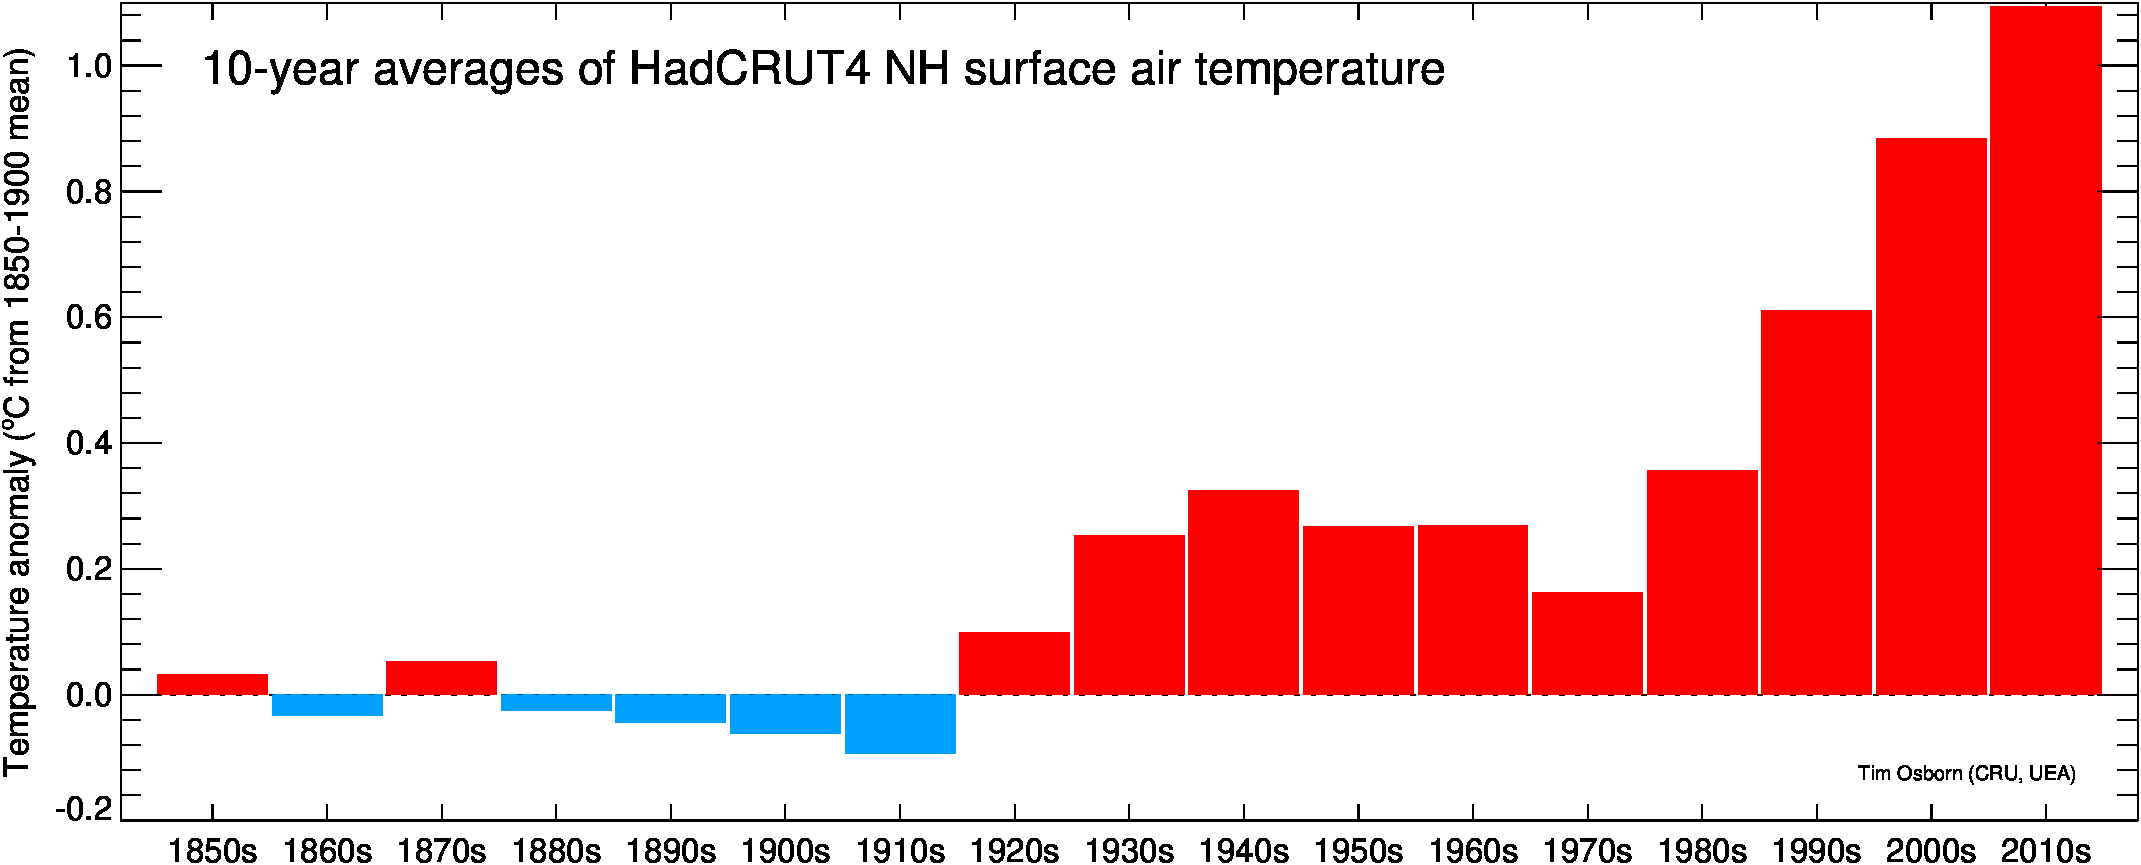
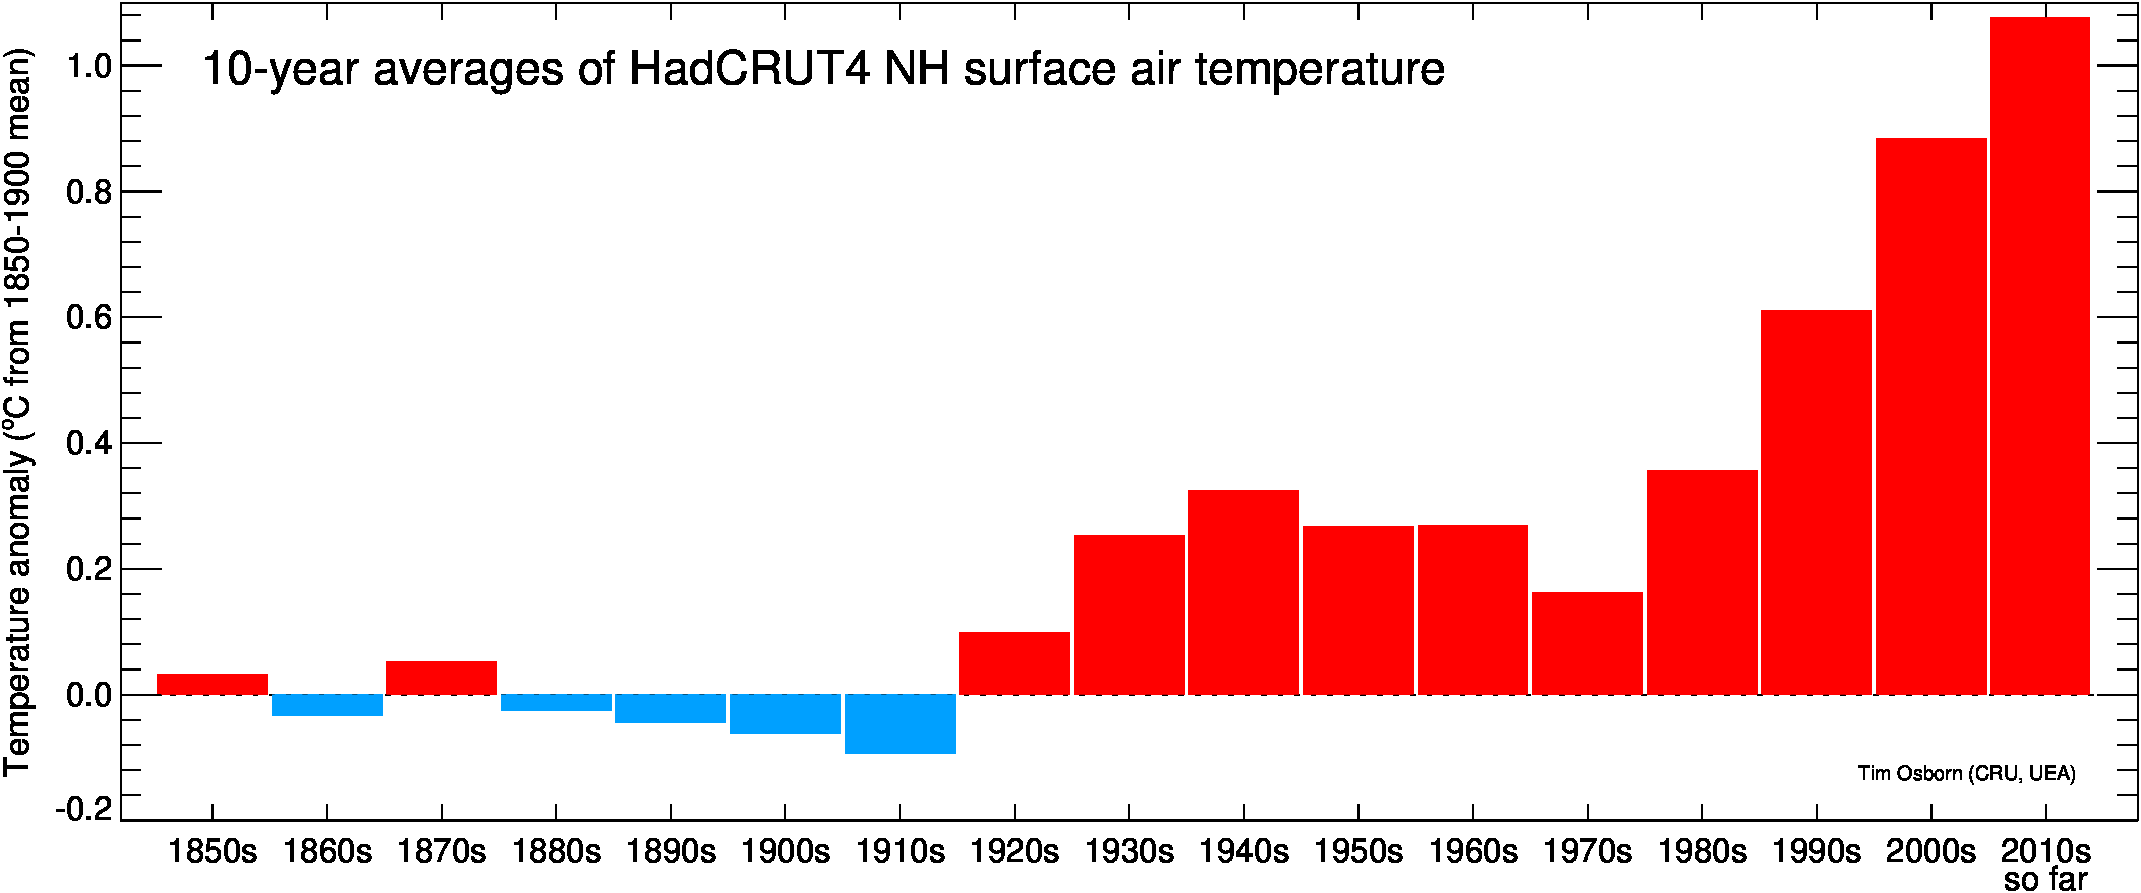
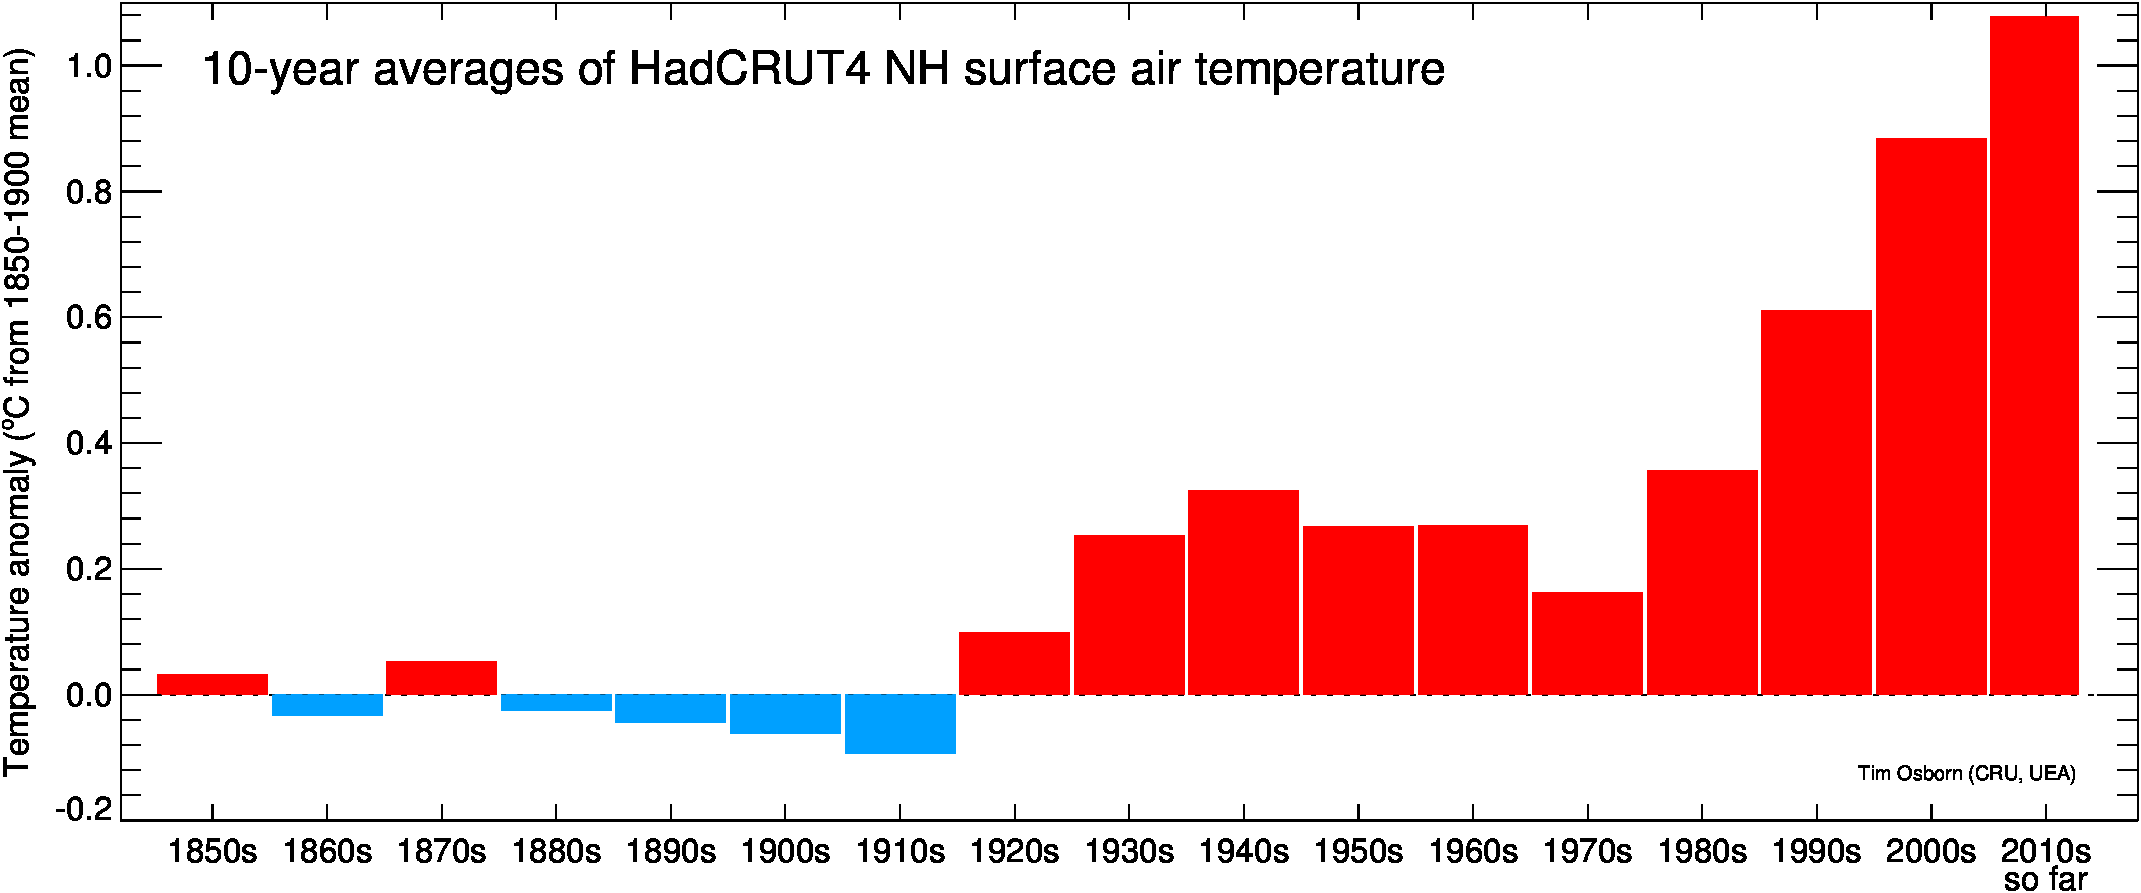
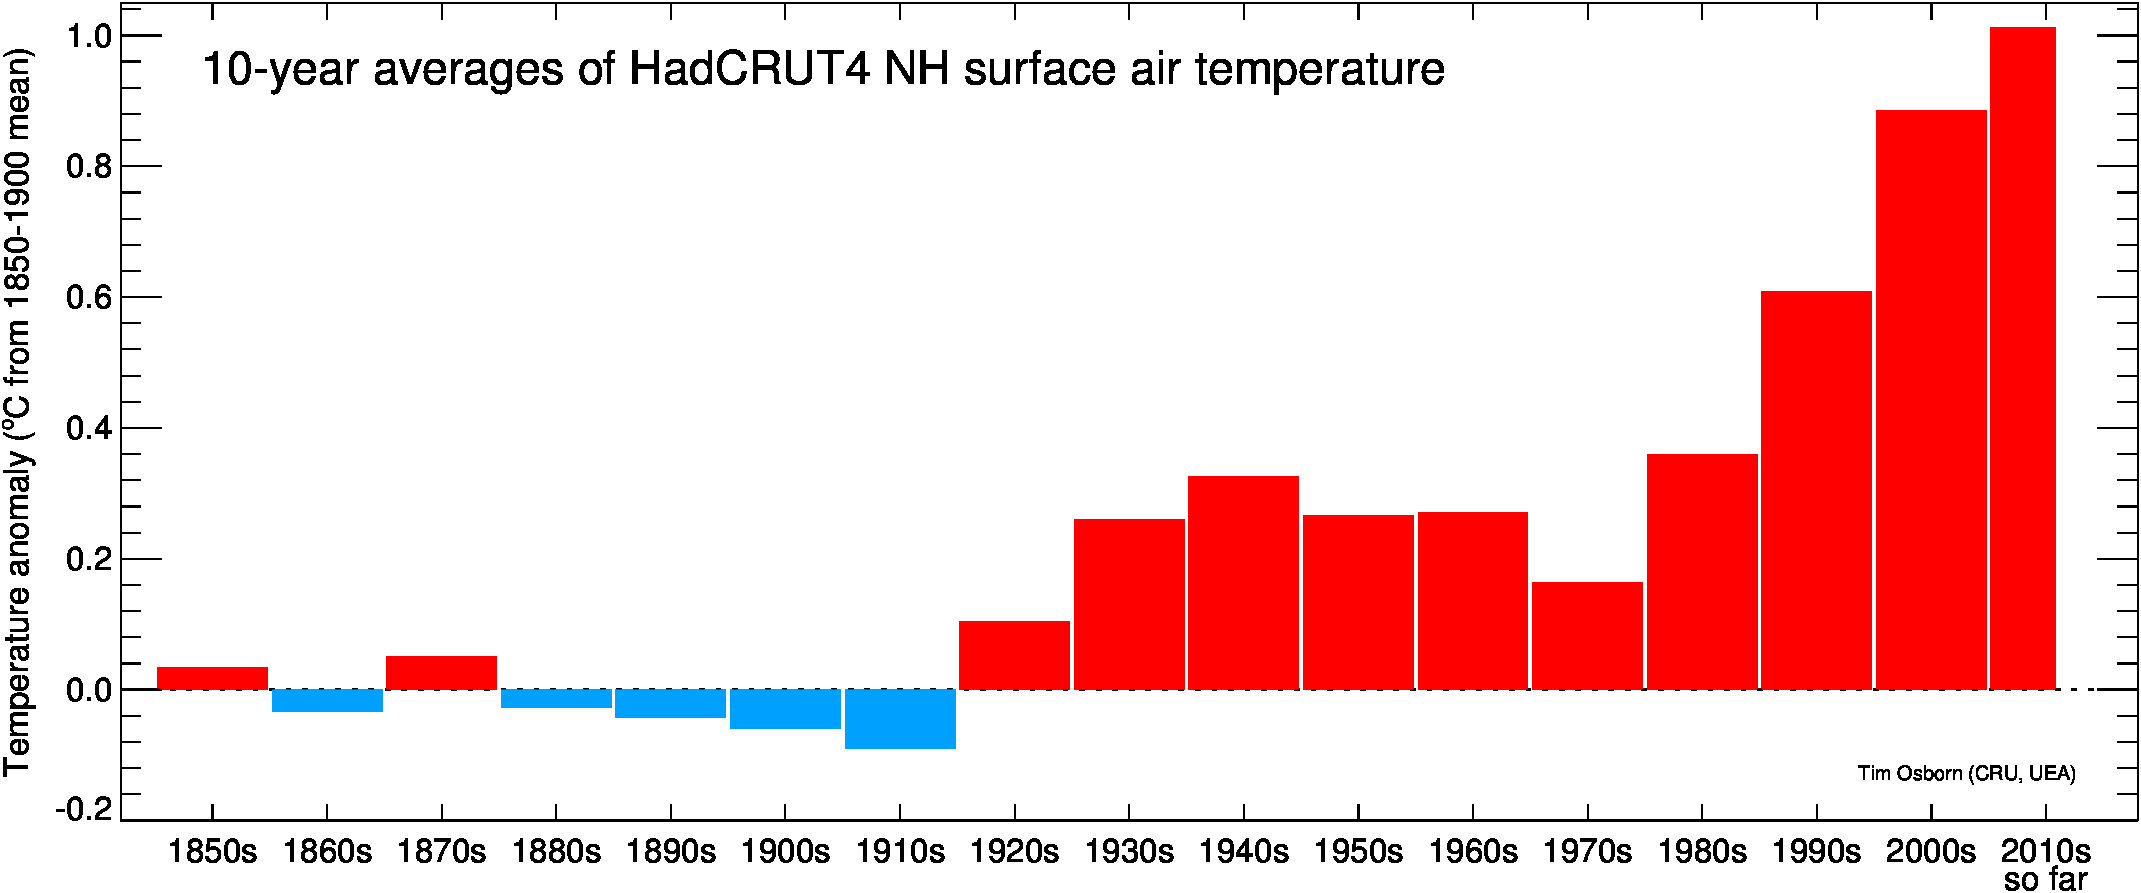
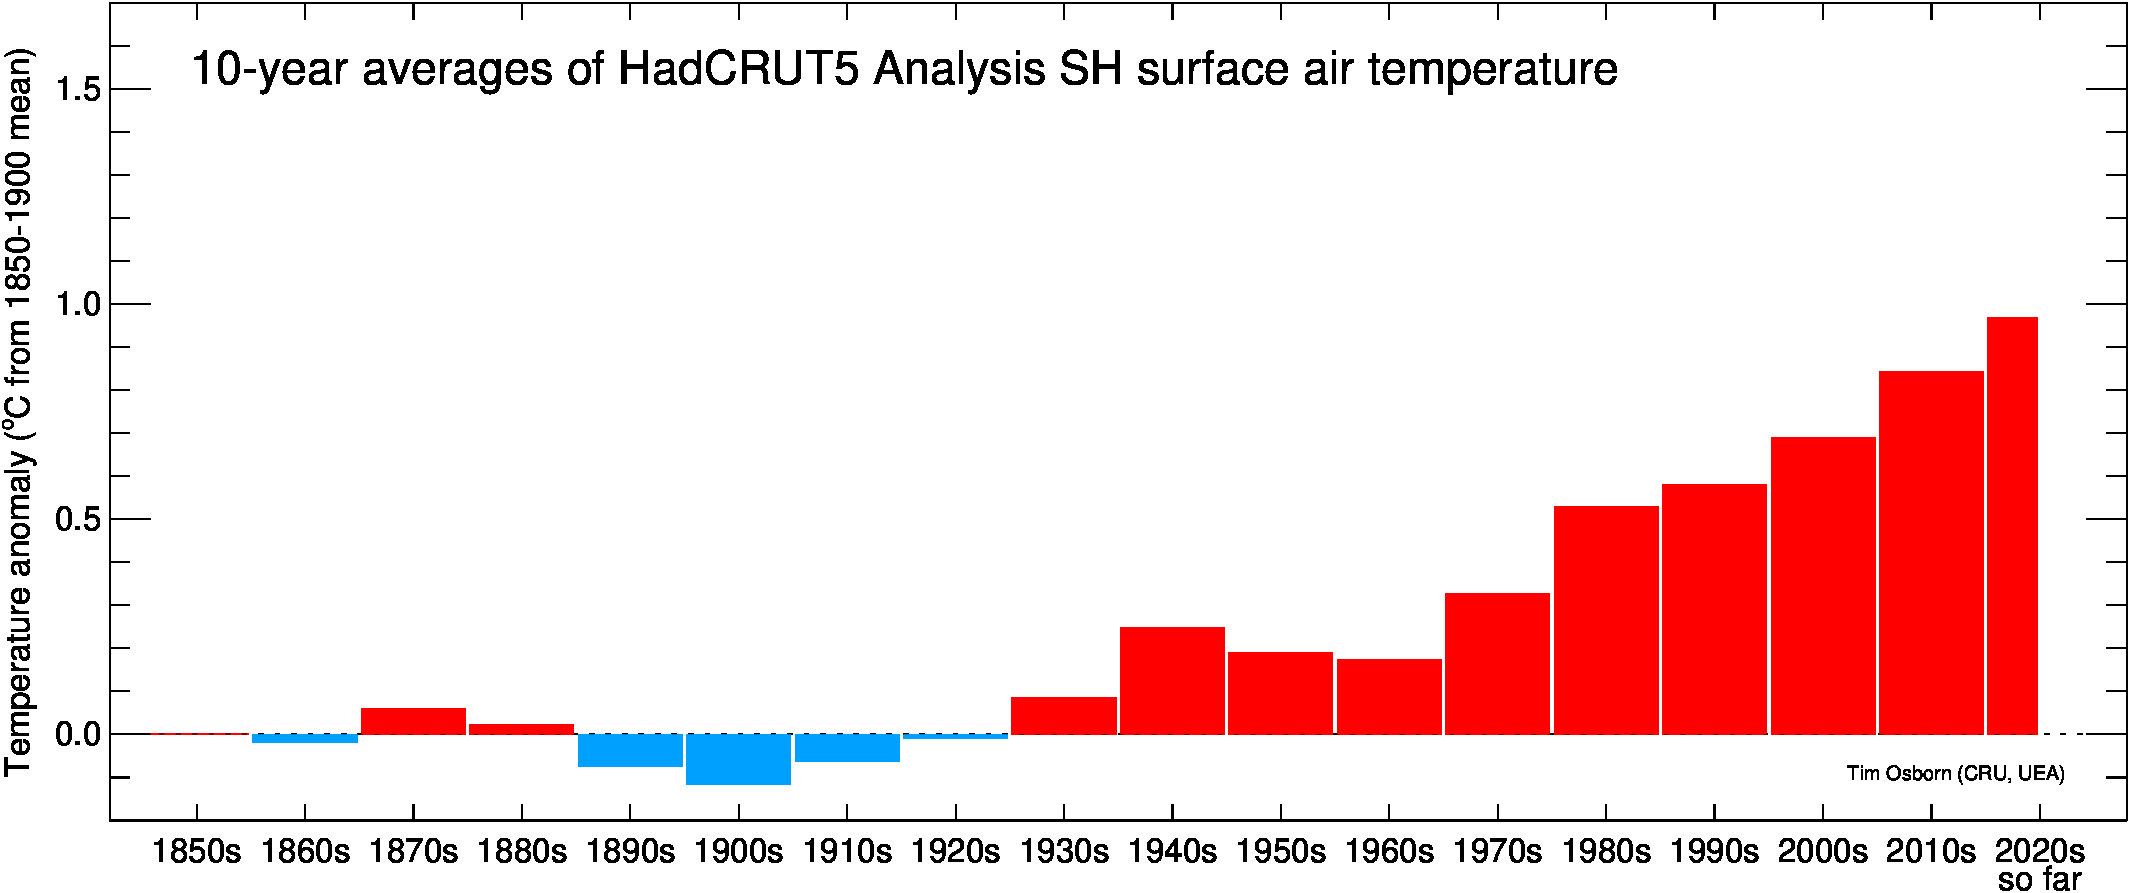
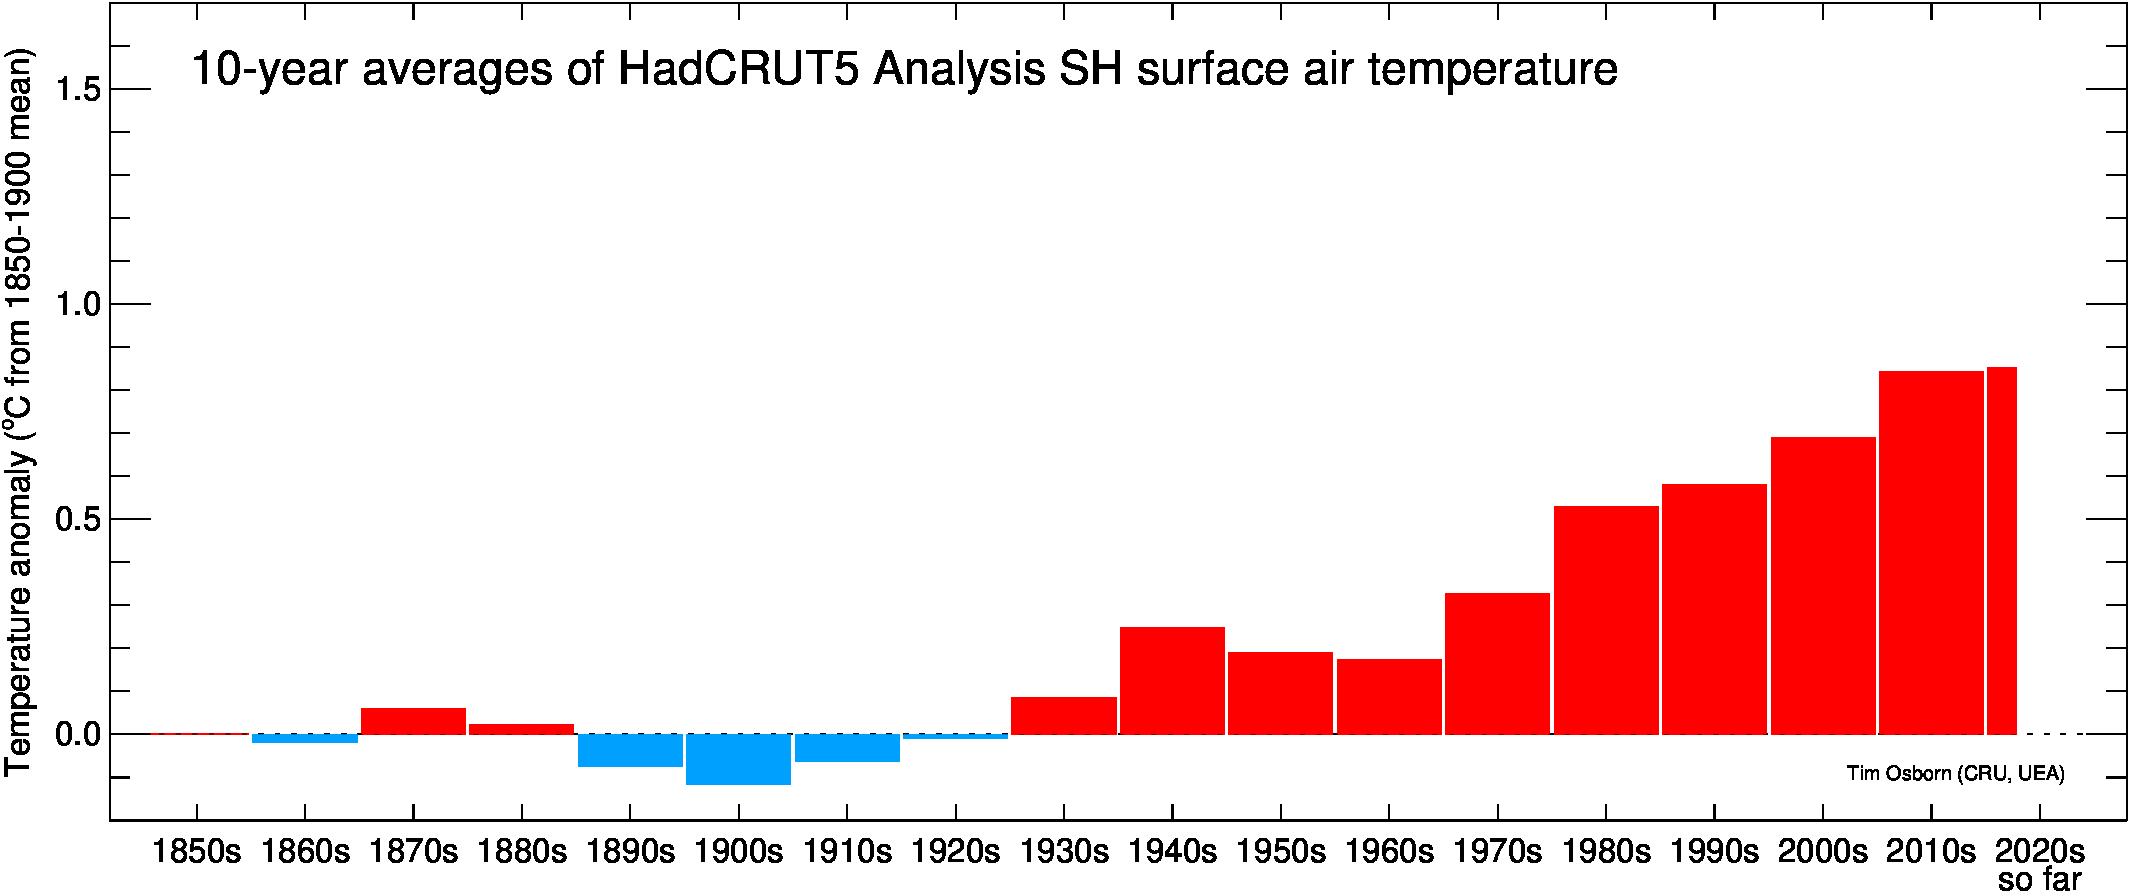
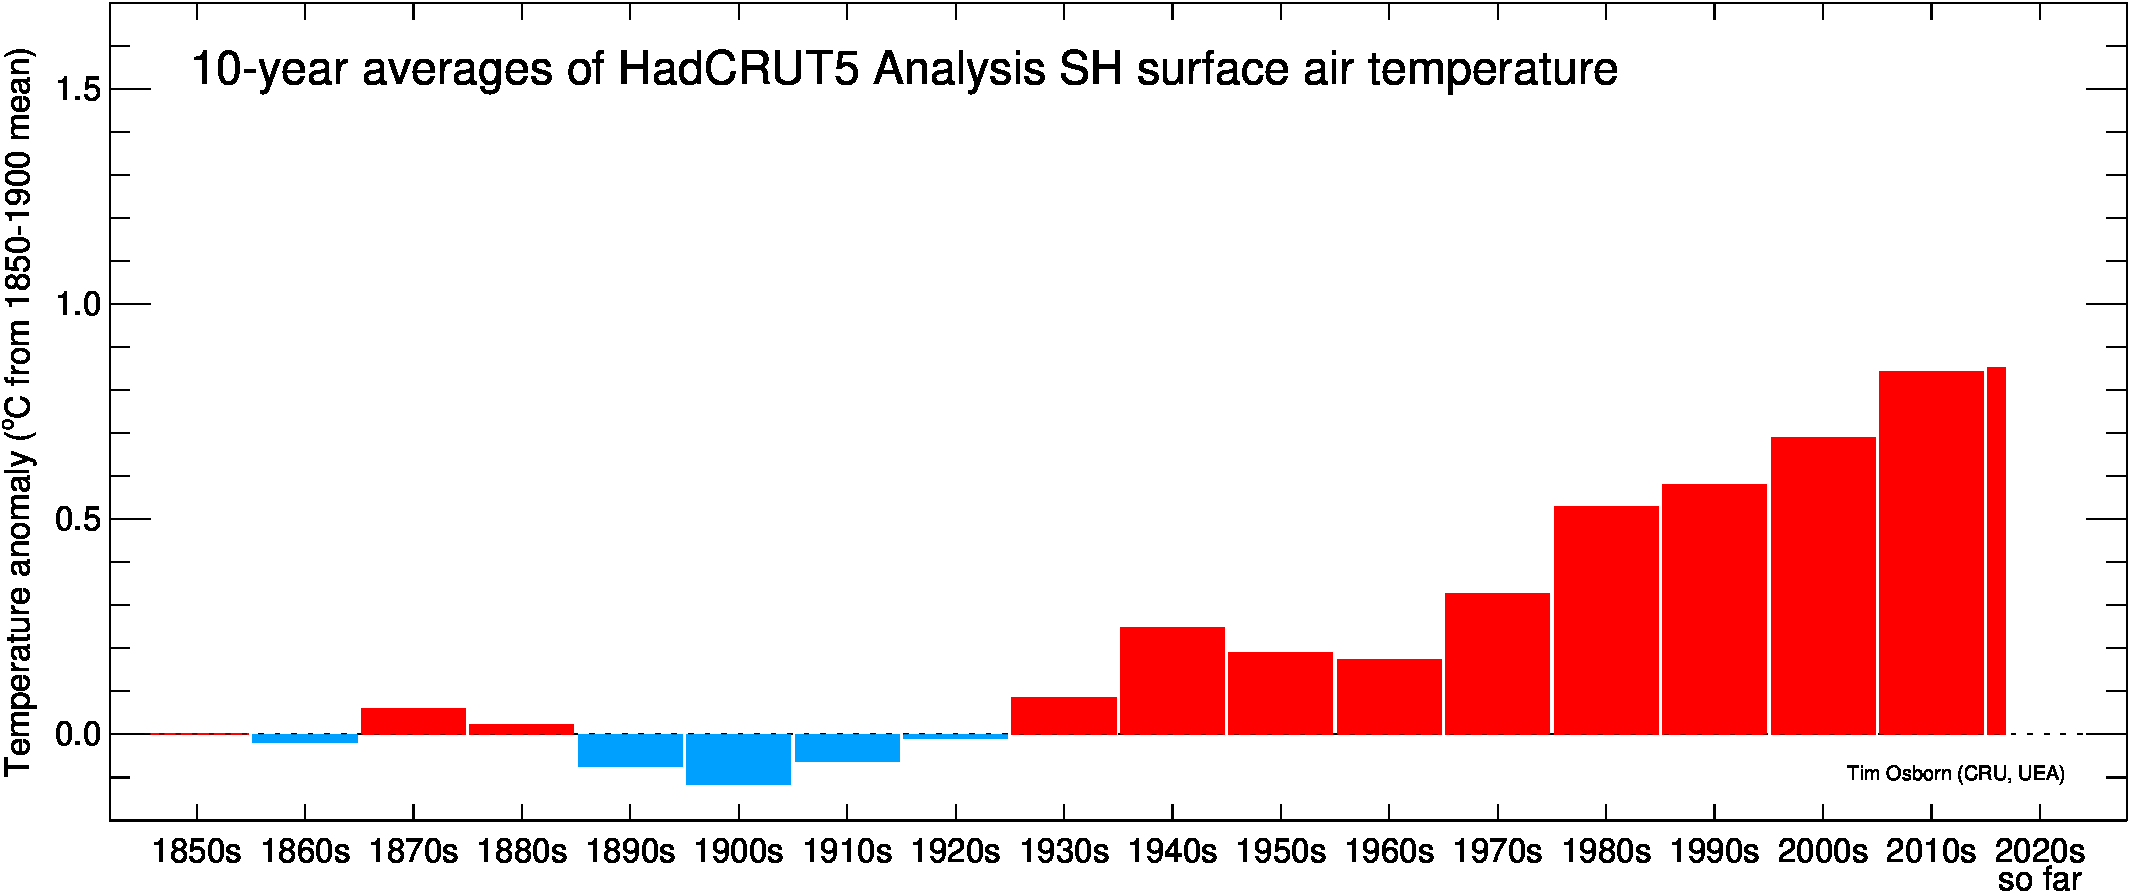
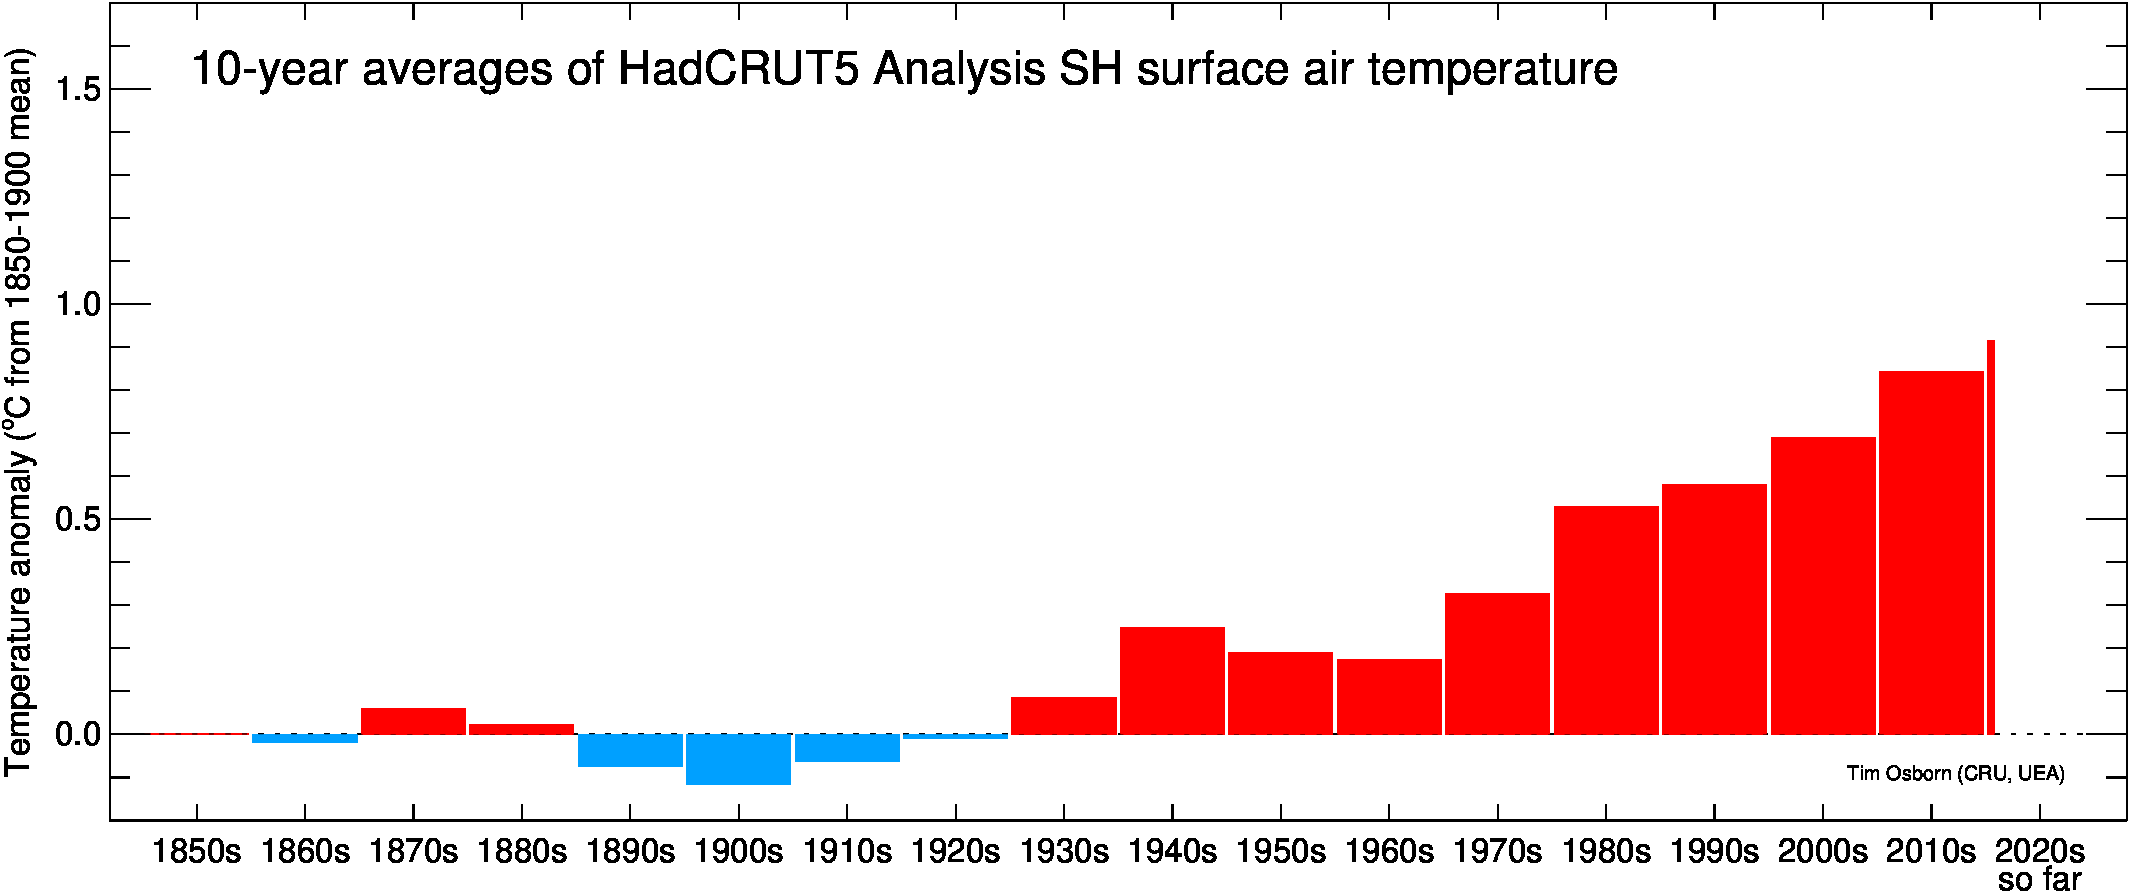
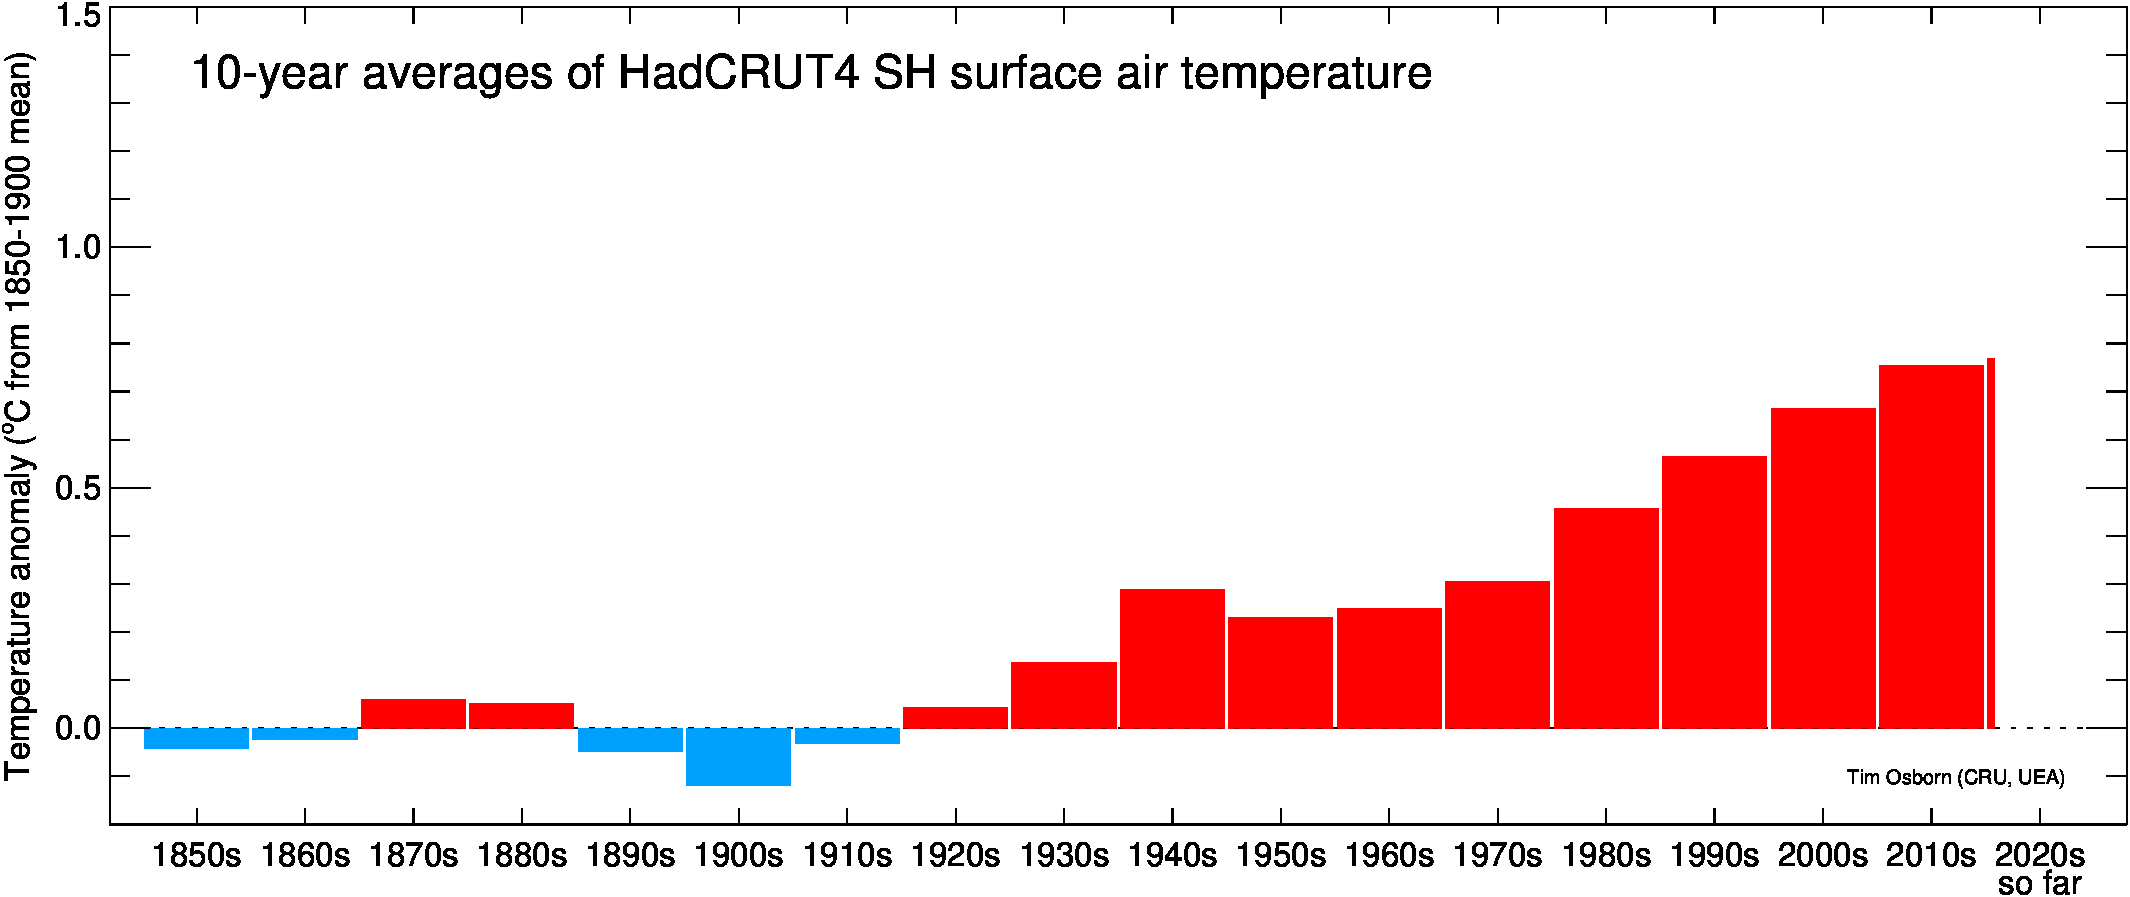
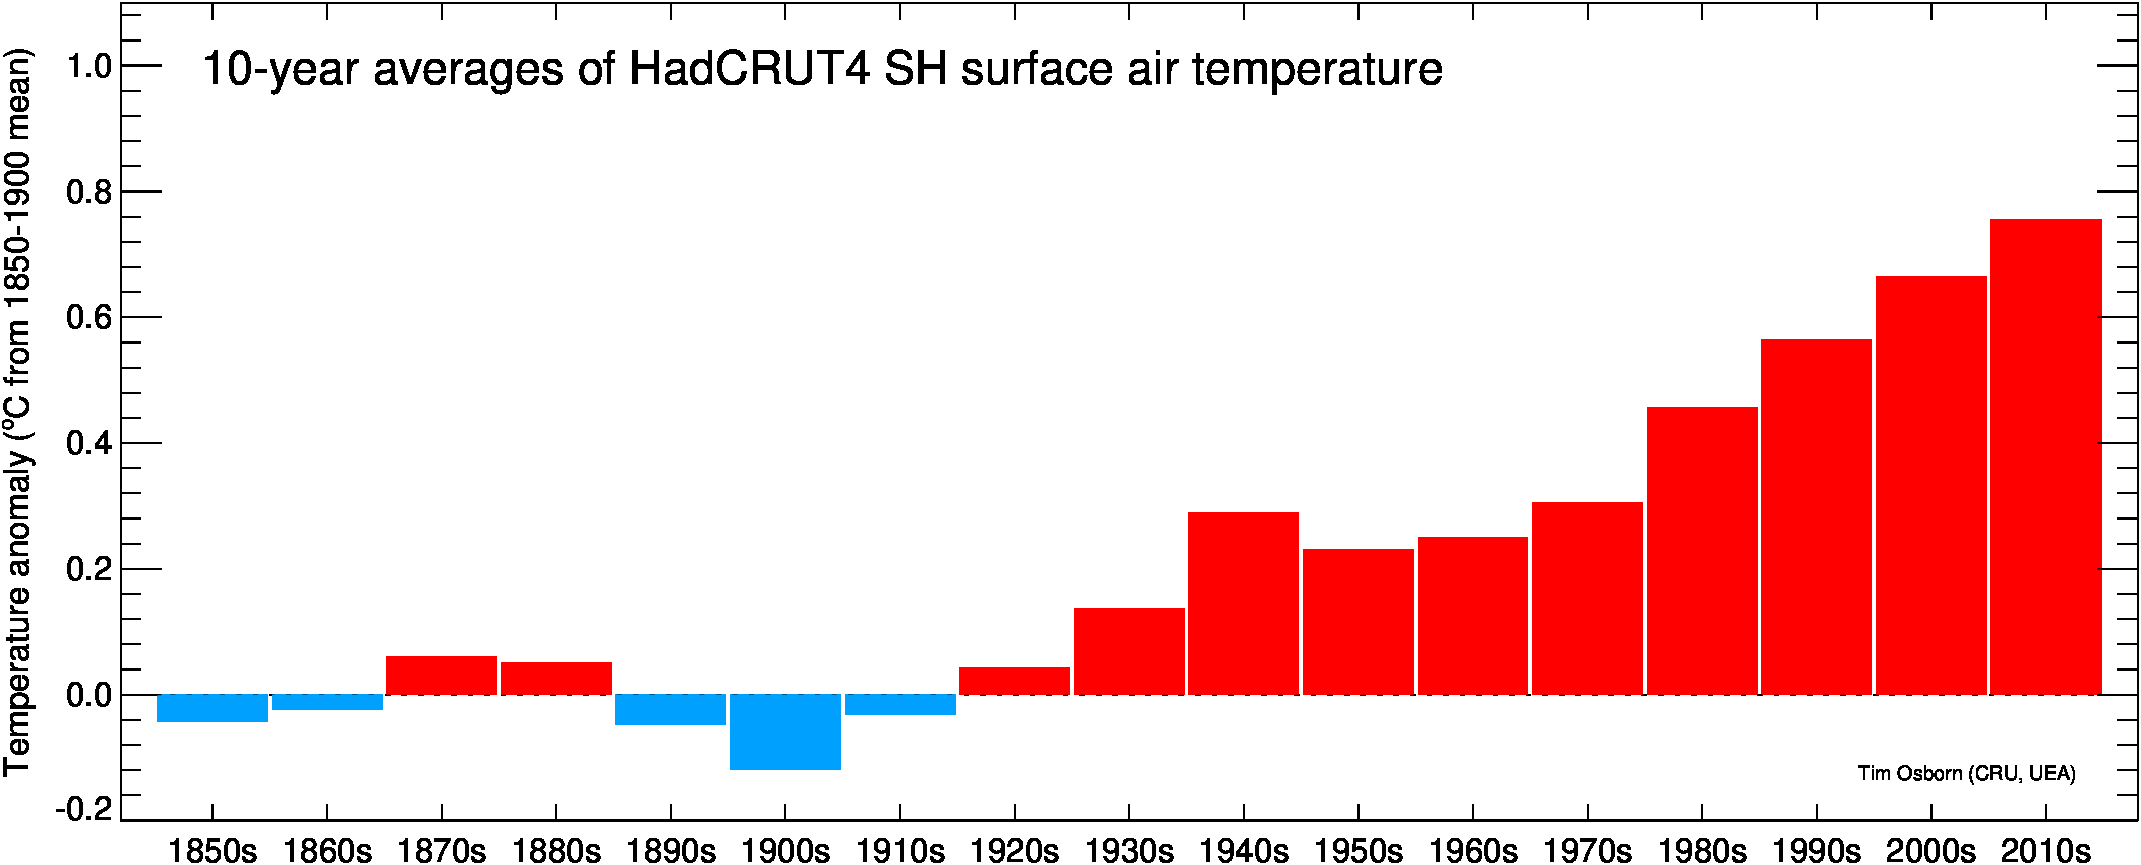
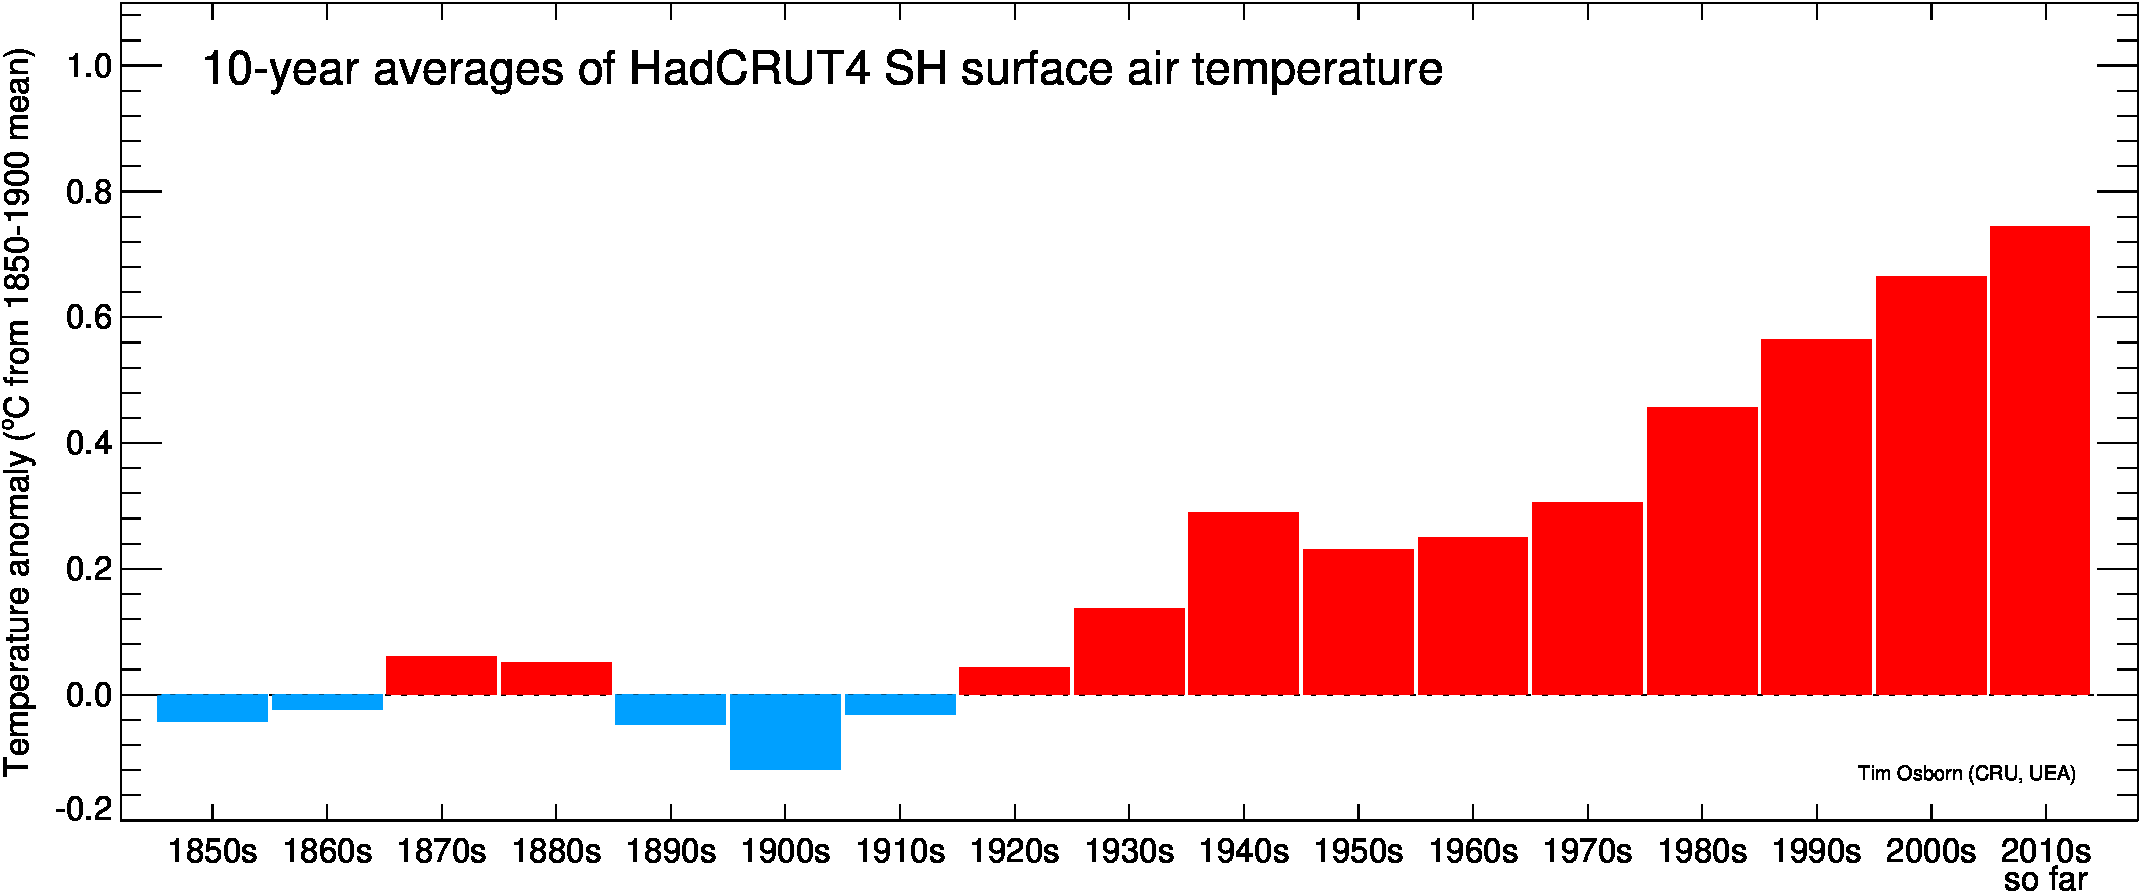
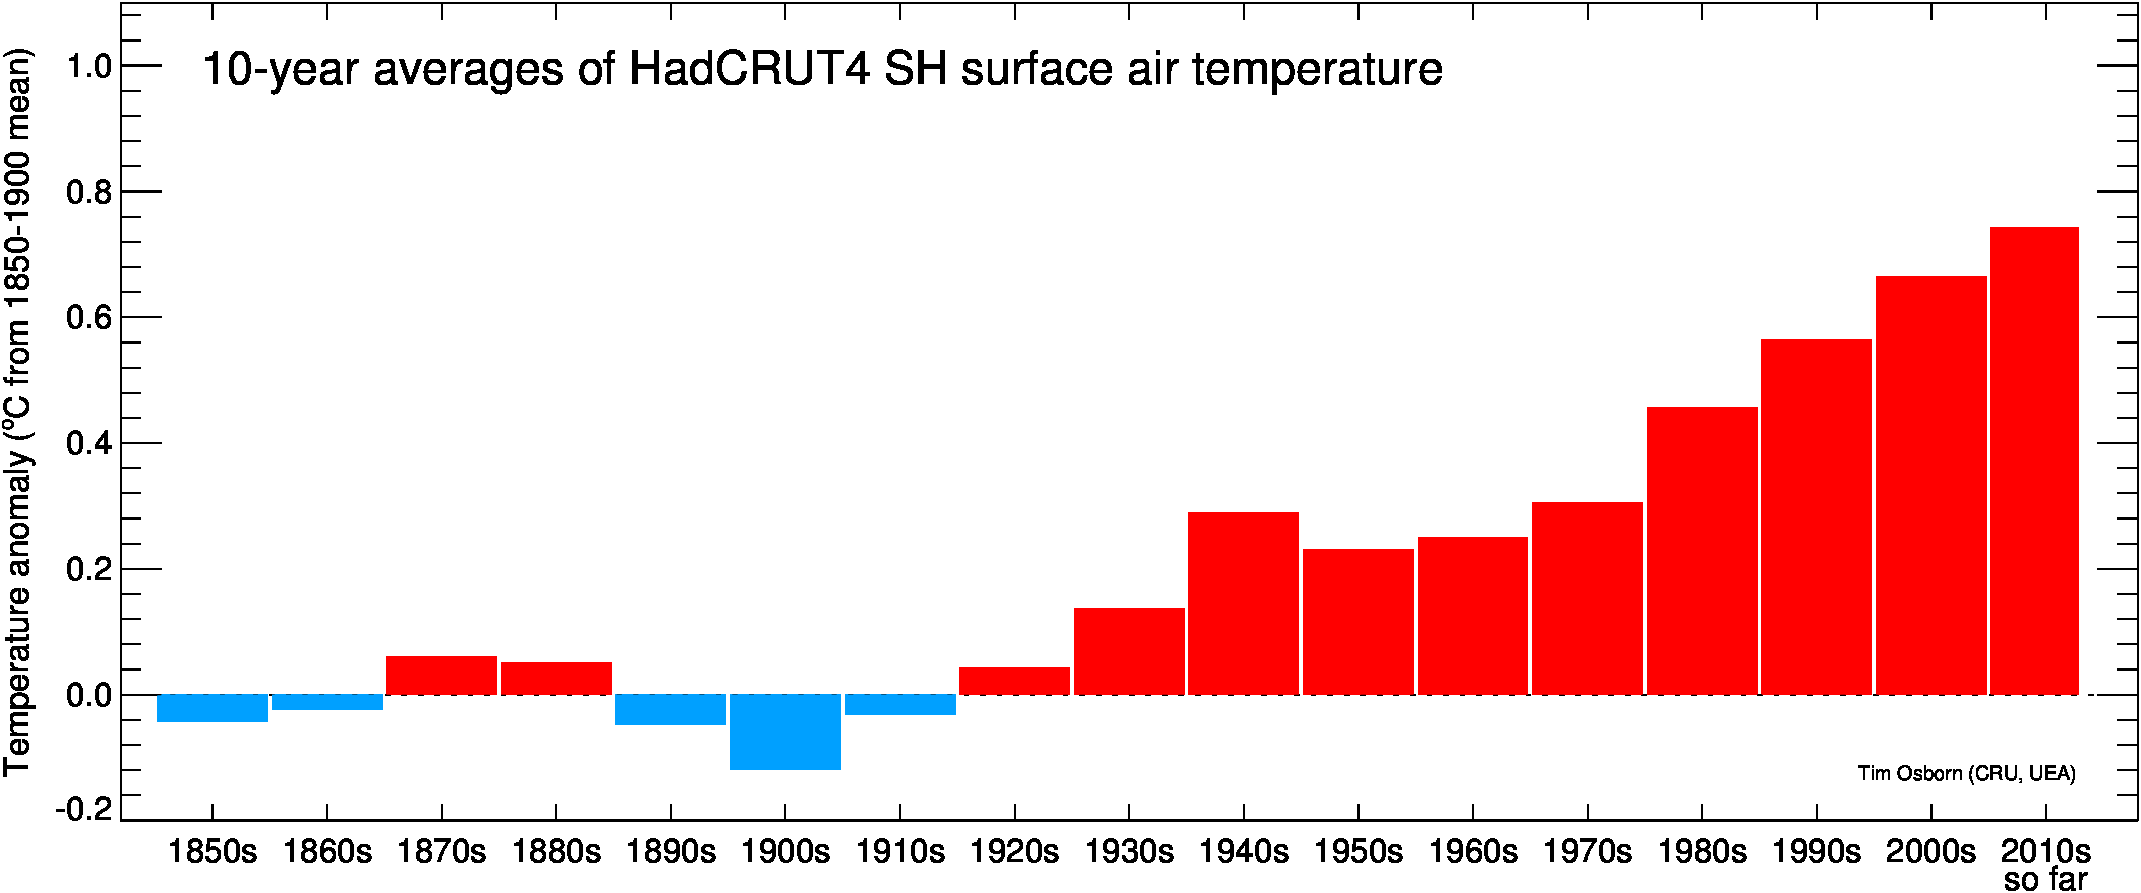
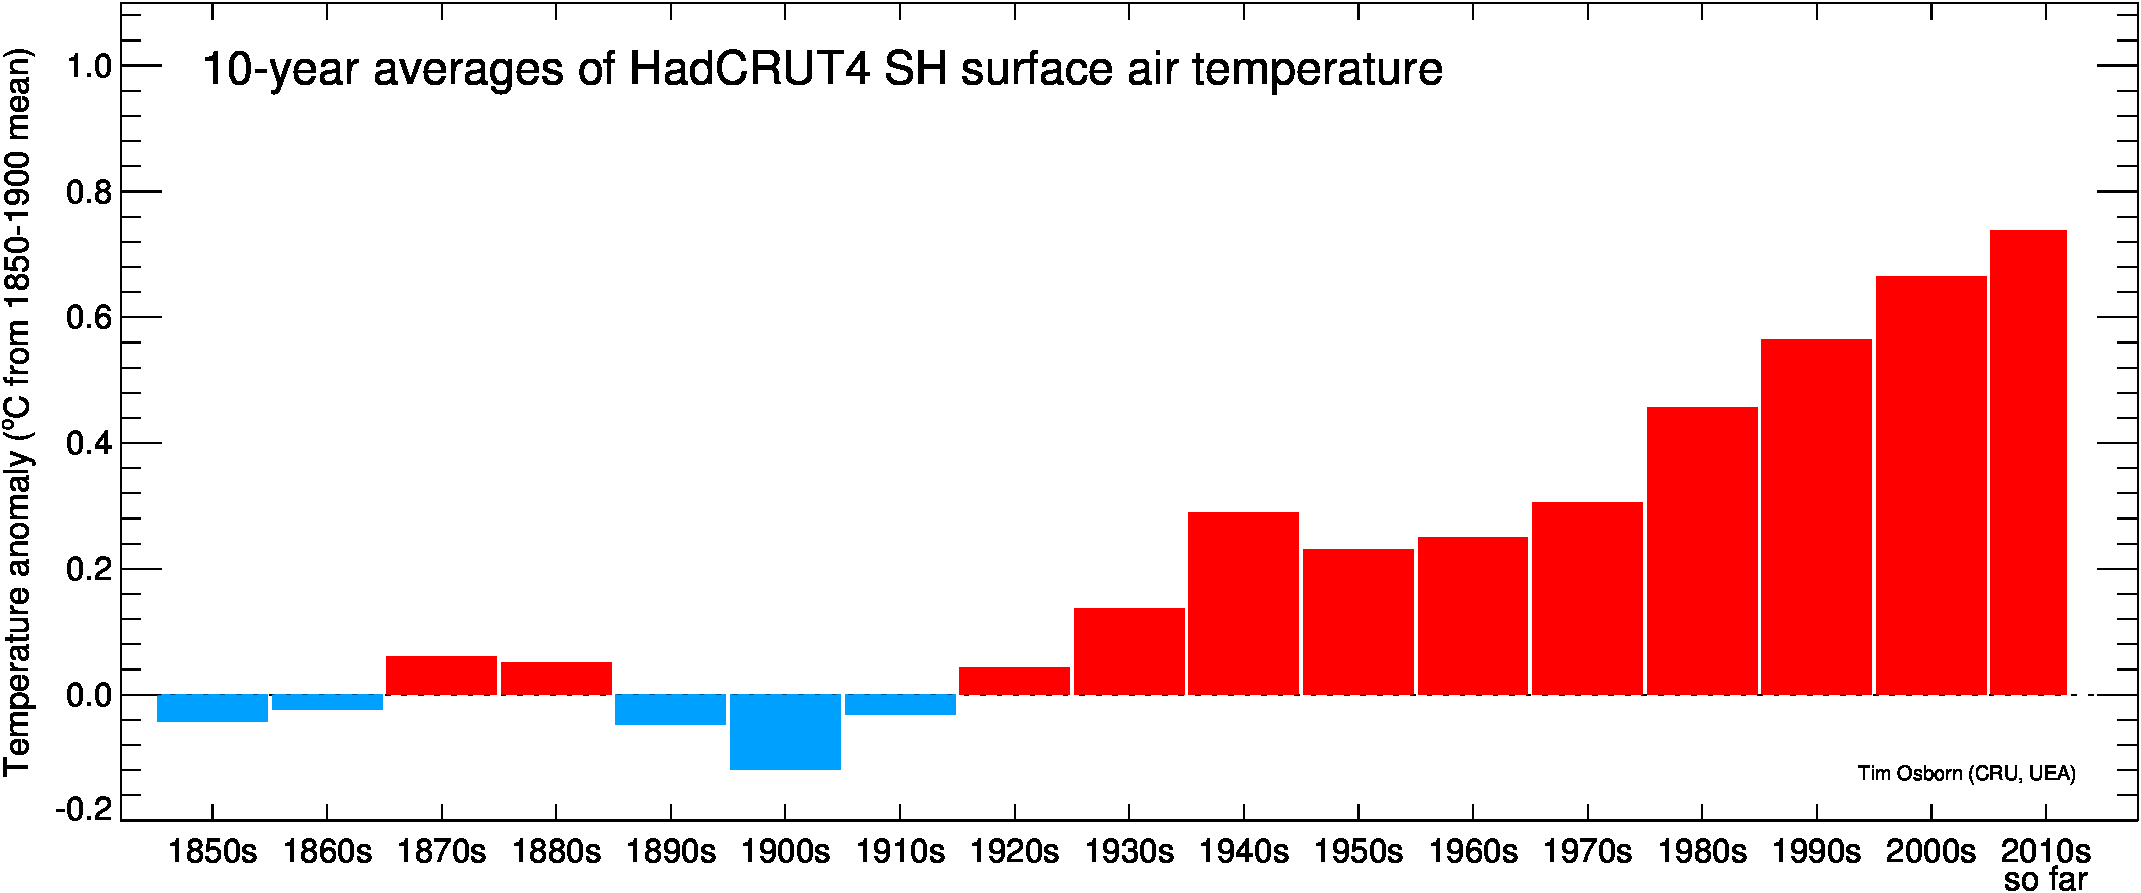
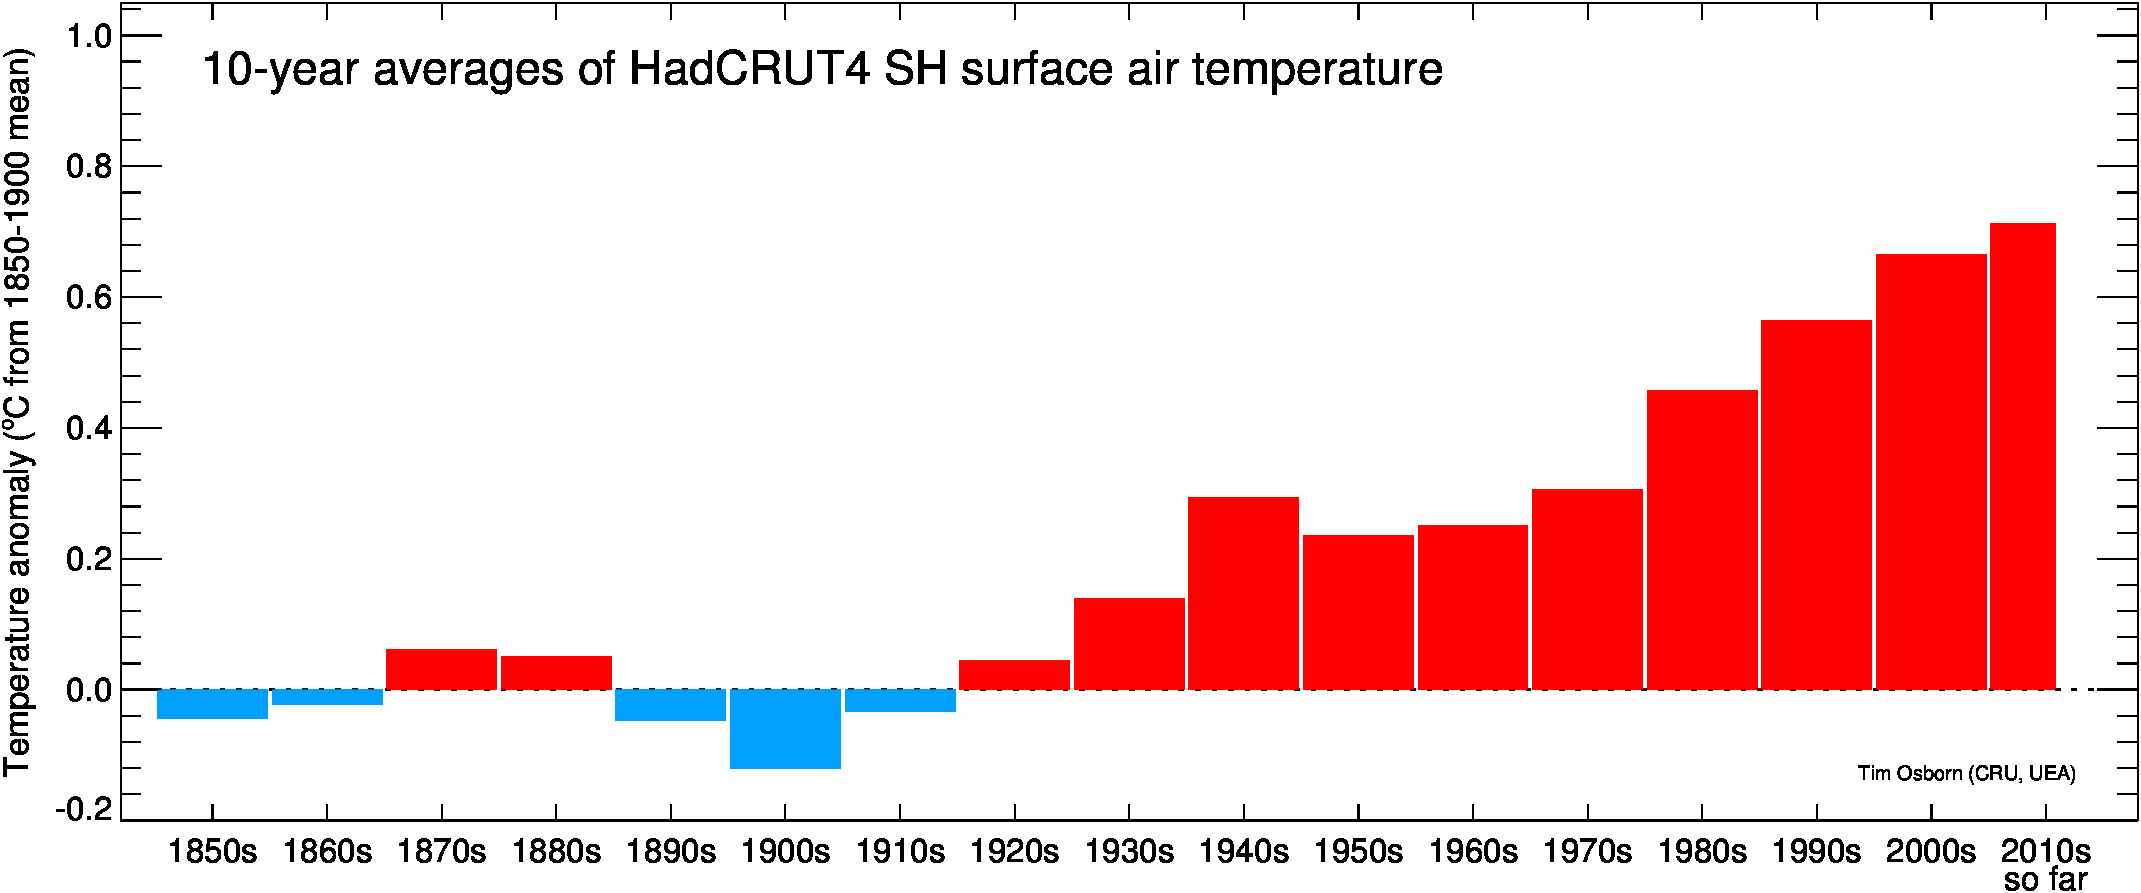
| Temperature timeseries: decadal means (based on complete years) compared to 1850-1900 (more info) | ||
| Global | Northern Hemisphere | Southern Hemisphere |

Click for larger image |
Click for larger image |
Click for larger image |
Archive of end-of-year visualisations
| Temperature timeseries: yearly and decadally smoothed, with uncertainties (more info) | ||
| Global | Northern Hemisphere | Southern Hemisphere |
|
HadCRUT5 Analysis 2025 2024 2023 2022 2021 2020 HadCRUT4 2020 2019 2018 2017 2016 2015 |
HadCRUT5 Analysis 2025 2024 2023 2022 2021 2020 HadCRUT4 2020 2019 2018 2017 2016 2015 |
HadCRUT5 Analysis 2025 2024 2023 2022 2021 2020 HadCRUT4 2020 2019 2018 2017 2016 2015 |
| Temperature timeseries: yearly and decadal means, with uncertainties (more info) | ||
| Global | Northern Hemisphere | Southern Hemisphere |
|
HadCRUT5 Analysis 2025 2024 2023 2022 2021 2020 HadCRUT4 2020 2019 2018 2017 2016 2015 |
HadCRUT5 Analysis 2025 2024 2023 2022 2021 2020 HadCRUT4 2020 2019 2018 2017 2016 2015 |
HadCRUT5 Analysis 2025 2024 2023 2022 2021 2020 HadCRUT4 2020 2019 2018 2017 2016 2015 |
| Temperature timeseries: decadal means (based on complete years) compared to 1850-1900 (more info) | ||
| Global | Northern Hemisphere | Southern Hemisphere |
|
HadCRUT5 Analysis 2025 2024 2023 2022 2021 2020 HadCRUT4 2020 2019 2018 2017 2016 2015 |
HadCRUT5 Analysis 2025 2024 2023 2022 2021 2020 HadCRUT4 2020 2019 2018 2017 2016 2015 |
HadCRUT5 Analysis 2025 2024 2023 2022 2021 2020 HadCRUT4 2020 2019 2018 2017 2016 2015 |
| Temperature: this year so far (more info) | ||
| Global | Northern Hemisphere | Southern Hemisphere |
|
HadCRUT5 Analysis 2025 2024 2023 2022 2021 2020 HadCRUT4 2020 2019 2018 2017 2016 |
HadCRUT5 Analysis 2025 2024 2023 2022 2021 2020 HadCRUT4 2020 2019 2018 2017 2016 |
HadCRUT5 Analysis 2025 2024 2023 2022 2021 2020 HadCRUT4 2020 2020 2019 2018 2017 2016 |
References
- Osborn, T.J., Jones, P.D., Lister, D.H., Morice, C.P., Simpson, I.R., Winn, J.P., Hogan, E., and Harris, I.C., 2021: Land surface air temperature variations across the globe updated to 2019: the CRUTEM5 dataset. Journal of Geophysical Research: Atmospheres. 126, e2019JD032352, doi:10.1029/2019JD032352
- Morice, C.P., Kennedy, J.J., Rayner, N.A., Winn, J.P., Hogan, E., Killick, R.E., Dunn, R.J.H., Osborn, T.J., Jones, P.D., and Simpson, I.R., 2021: An updated assessment of near-surface temperature change from 1850: the HadCRUT5 dataset. Journal of Geophysical Research 126, e2019JD032361, doi:10.1029/2019JD032361