UEA
ENV
CRU
Homepage
Data
CRU links
CRU staff
CRU data
External links
InterpretingCC
Homepage
NAO
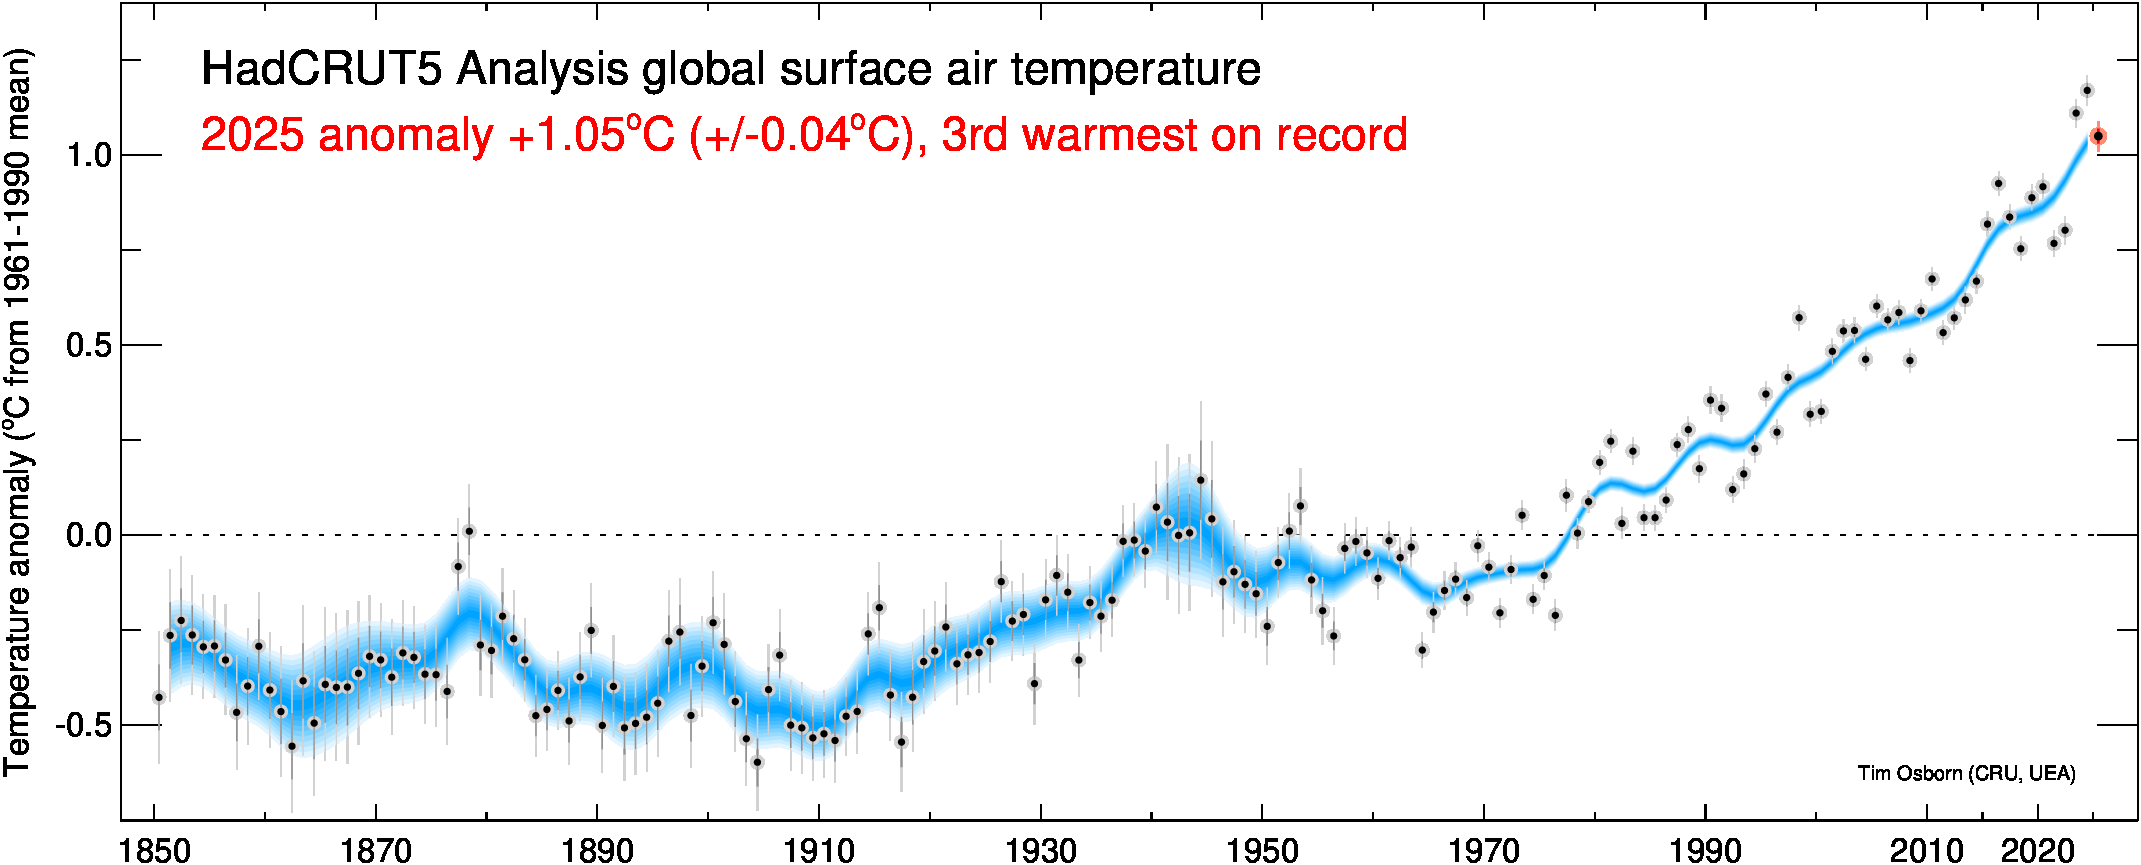
Visualisations of the full timeseries of global and hemispheric temperature anomalies, including the current (possibly incomplete) year.
The temperature dataset is our HadCRUT5 data.
Yearly and decadally-smoothed values
These graphs show the annual average temperature anomalies (black/grey dots) and their estimated uncertainty (vertical lines: dark grey for +/- 1 standard deviation; light grey for the 95% confidence interval). The current year is shown red, and the uncertainty tends to be greater when it is incomplete.
Decadally-smoothed values are shown in blue, with shading to indicate the 95% confidence interval at the decadal timescale. This is narrower than for the annual values (i.e. reduced uncertainty) because some sources of uncertainty are effectively random between years and partially cancel out when averaged across years to obtain the decadal values. The uncertainty in the decadally-smoothed values increases slightly near the beginning and end of the series because of end effects arising from applying the decadal filter right to the ends of the timeseries.
Click for larger image
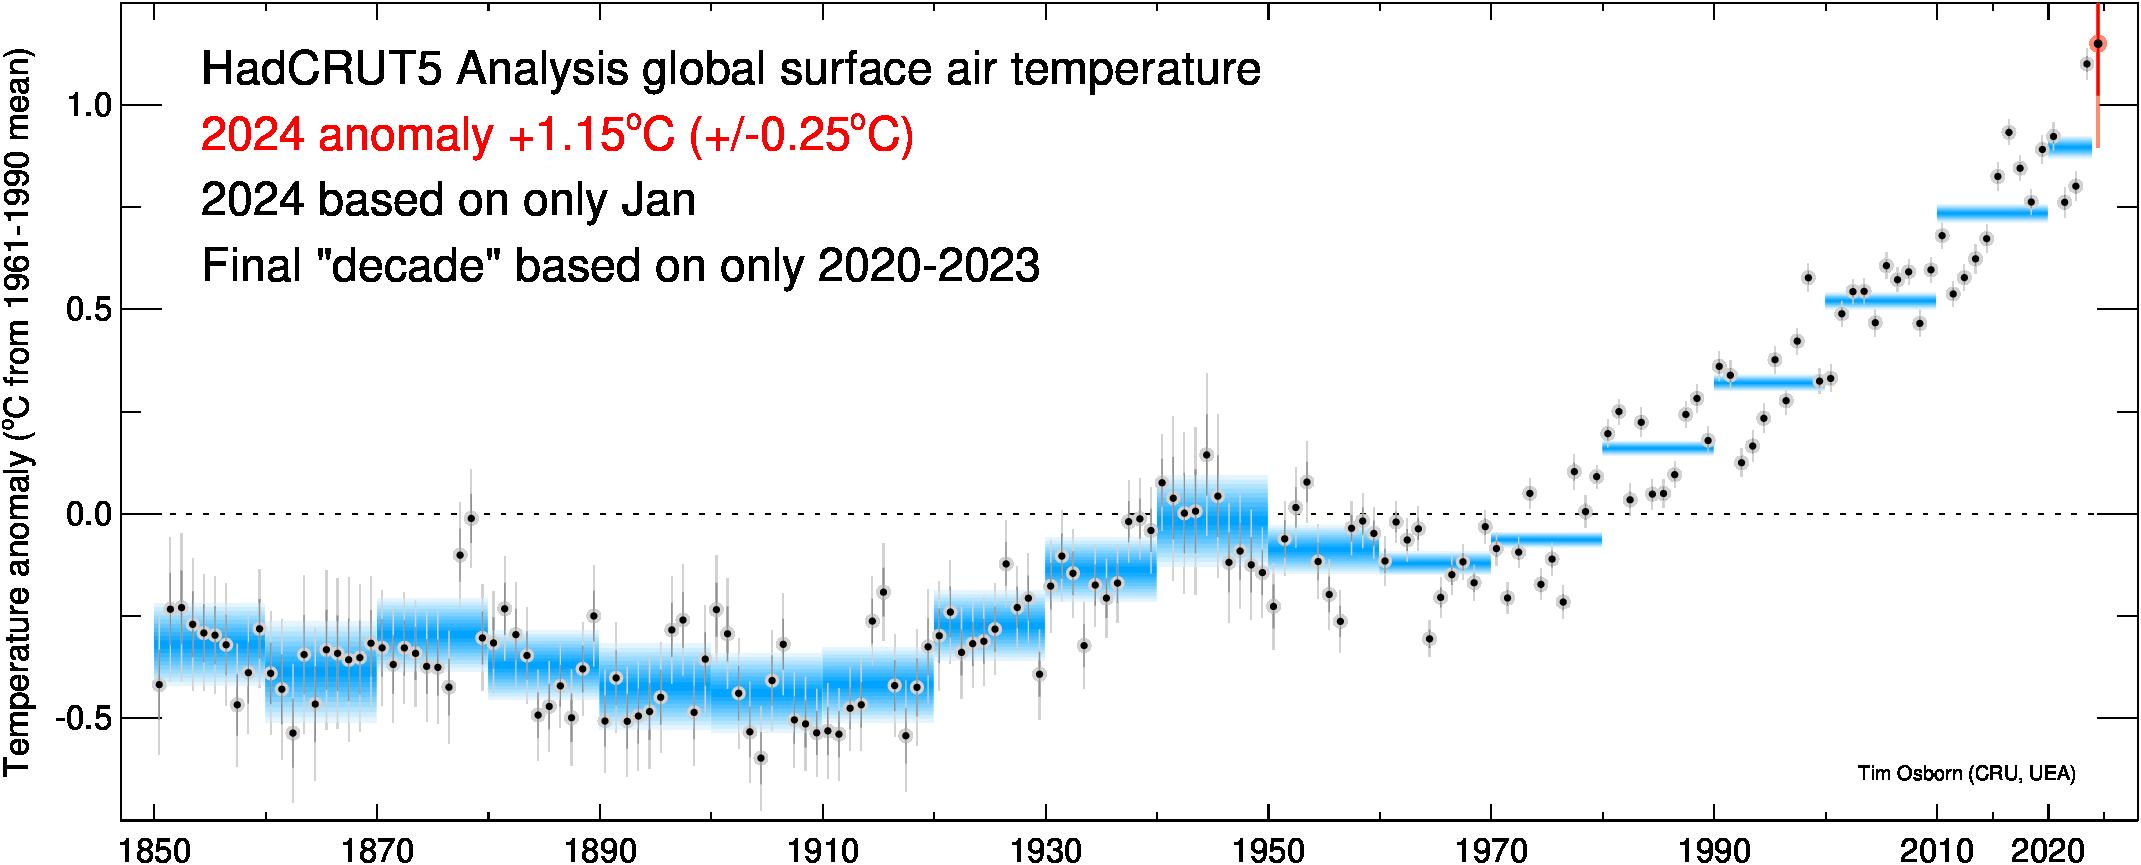
Yearly and decadal average values
As above, but averages are shown for the individual decades. When the final decade is incompete, the uncertainty tends to be greater.
Click for larger image
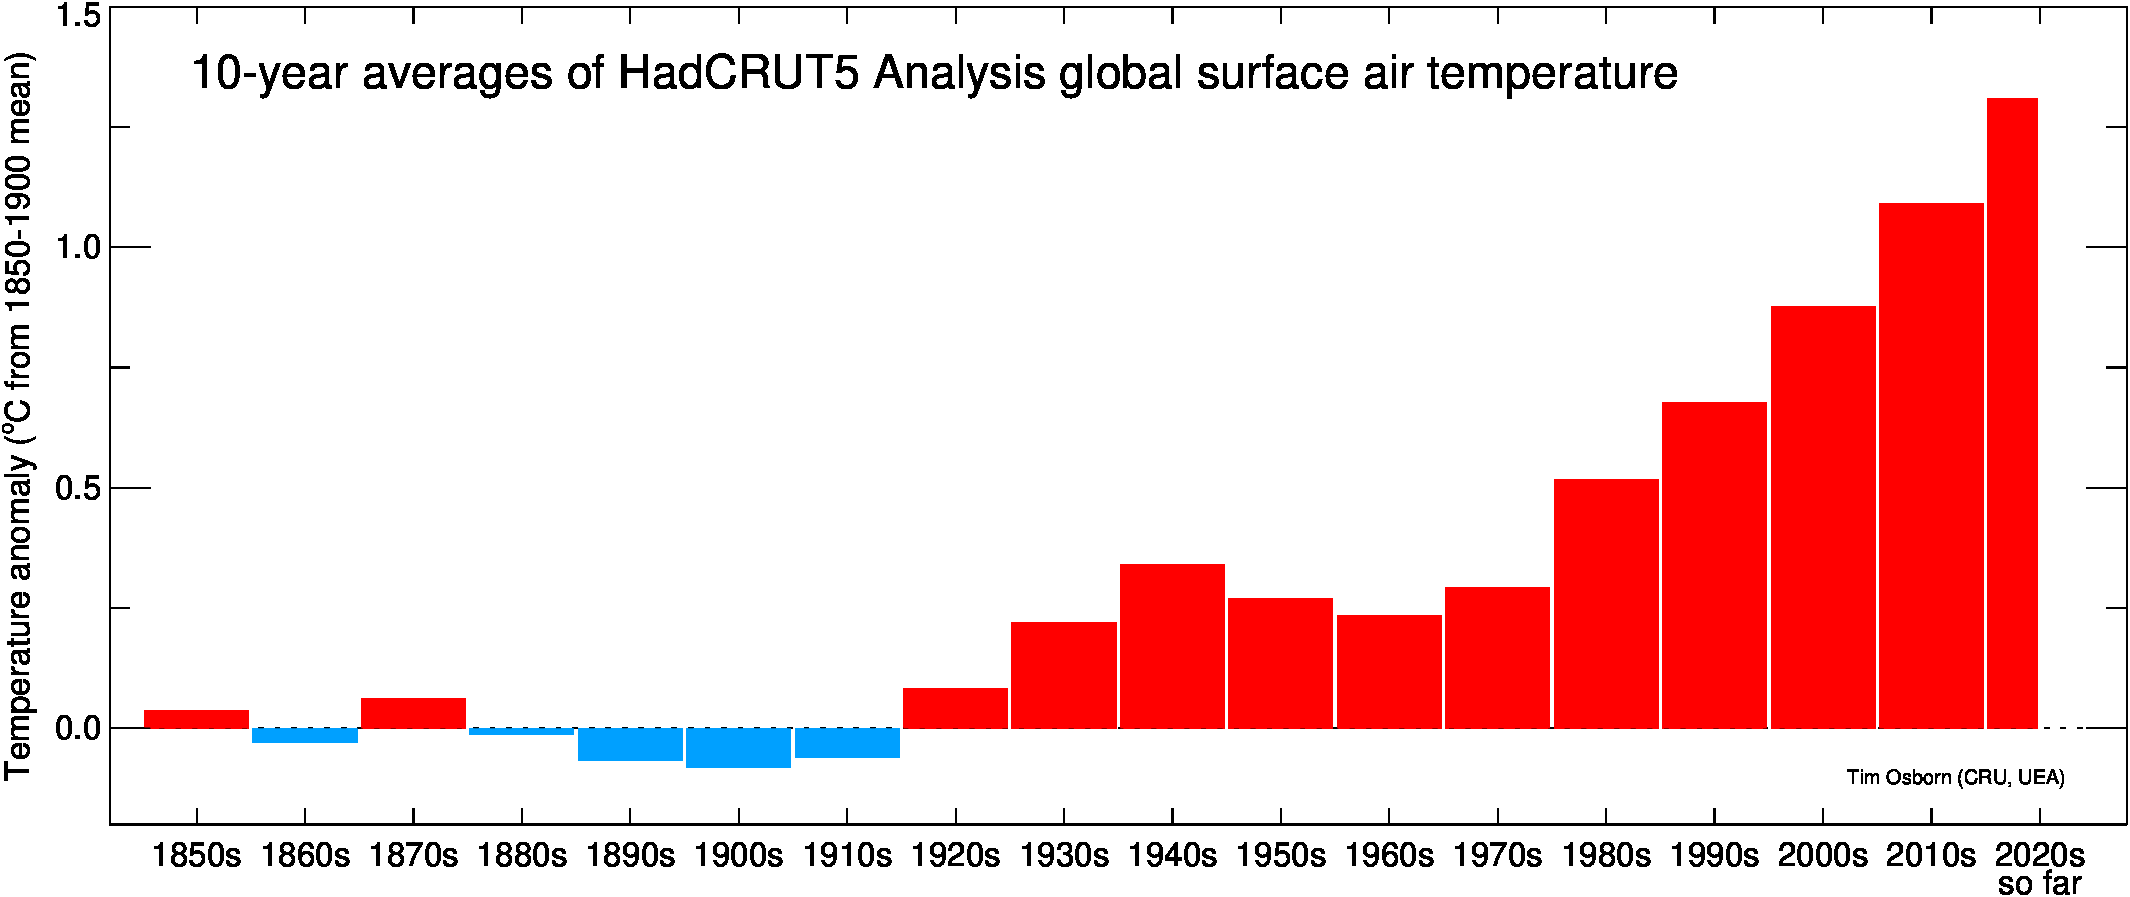
Decadal average values compared to 1850-1900
This graph is also used for UEA's Taking the Earth's Temperature.
As above, but only averages for the individual decades are shown (values for individual years are not shown) and the temperature anomalies are also relative to the 1850-1900 baseline, as an approximation to pre-industrial temperatures. The uncertainty estimates for the HadCRUT5 are not completely applicable to any baseline except for 1961-1990, so they are not shown on these graphs. The final "decade" is shown even if it is not yet complete (but only complete years contribute to its calculation) and the width of its bar is proportional to the number of complete years in the decade.
Click for larger image
References
- Morice, C.P., Kennedy, J.J., Rayner, N.A., Winn, J.P., Hogan, E., Killick, R.E., Dunn, R.J.H., Osborn, T.J., Jones, P.D., and Simpson, I.R., 2021: An updated assessment of near-surface temperature change from 1850: the HadCRUT5 dataset. Journal of Geophysical Research 126, e2019JD032361, doi:10.1029/2019JD032361