UEA
ENV
CRU
Homepage
Data
CRU links
CRU staff
CRU data
External links
InterpretingCC
Homepage
NAO
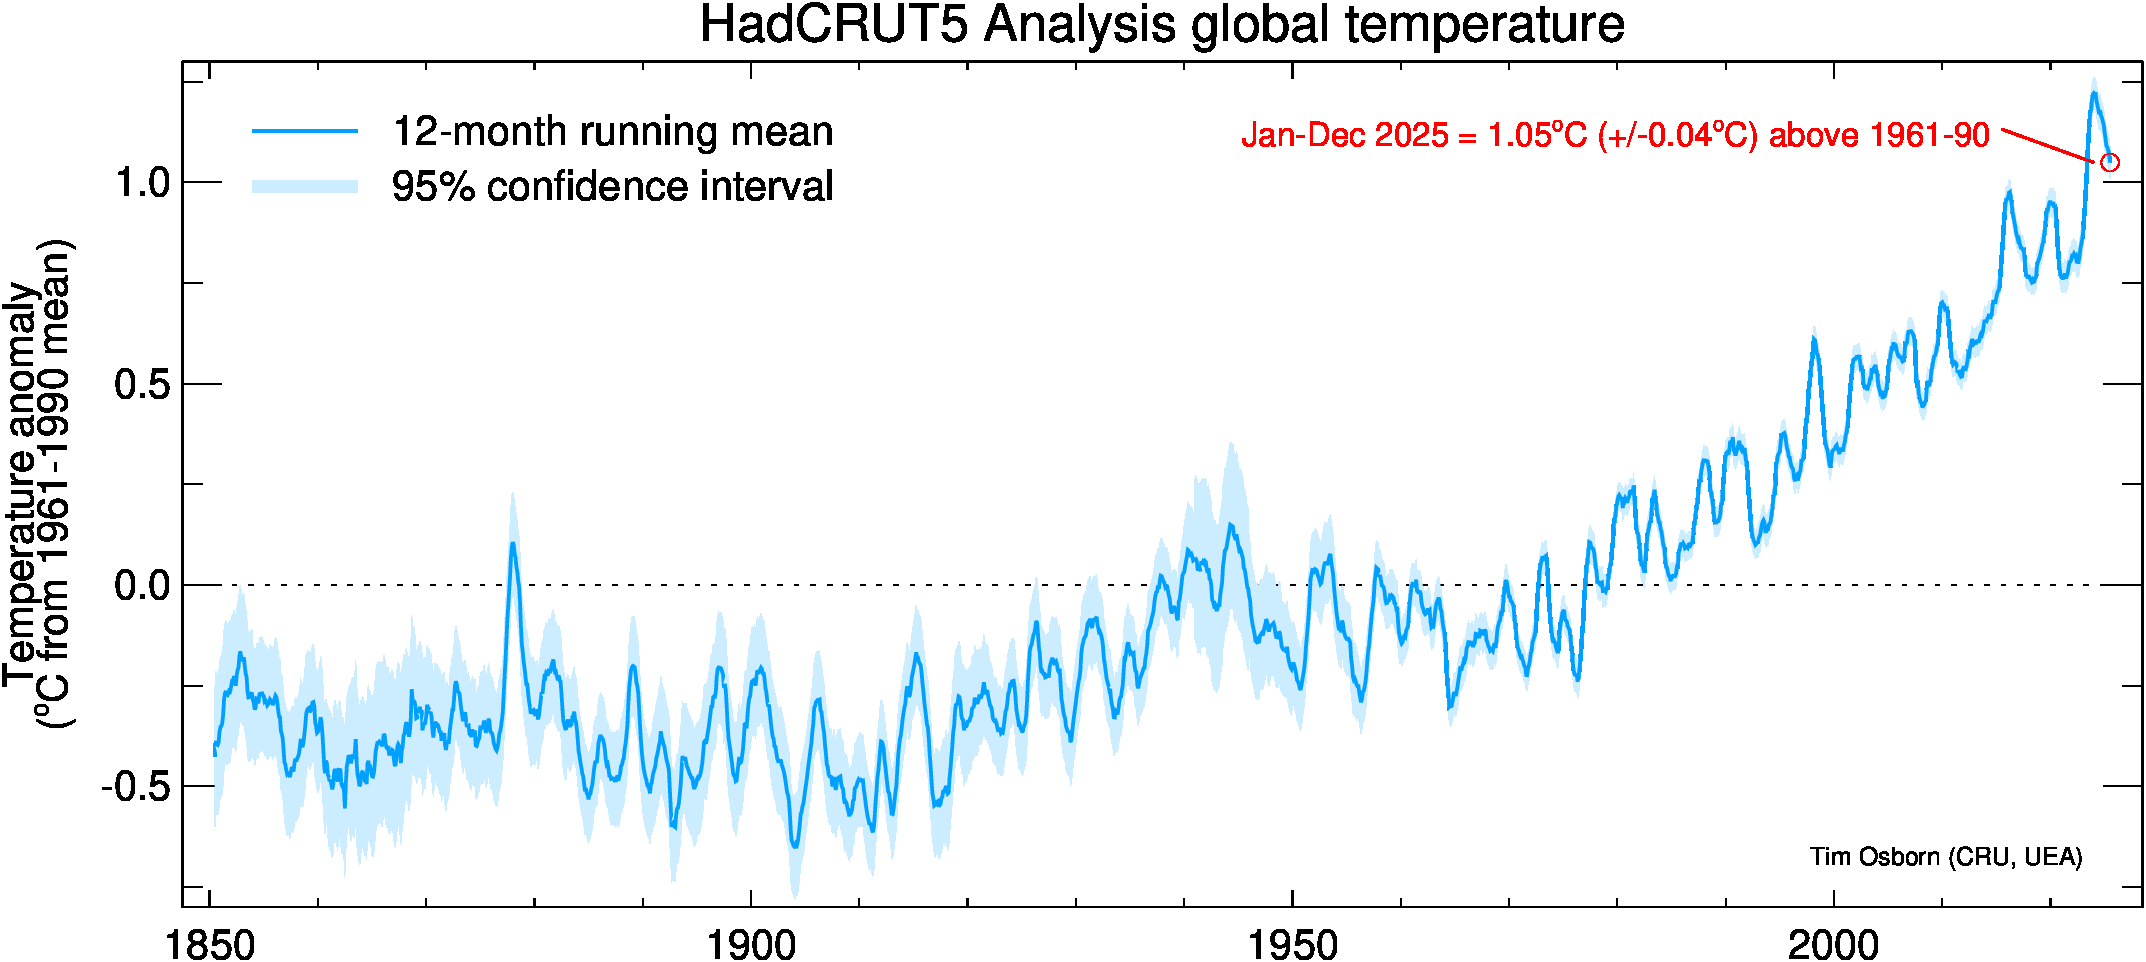
Visualisations of the full timeseries of global and hemispheric temperature anomalies, using 12-month running means.
The temperature datasets shown are our HadCRUT5 and CRUTEM5 data.
12-month running mean values
These graphs show the 12-month running-mean temperature anomalies (blue line). Their estimated uncertainties (pale blue shading) are assumed to be equal to the uncertainties of annual means.
Using 12-month running means avoids the abritrary division into calendar years for annual averages, and so it can better capture short-lived anomalies (e.g. those associated with ENSO events) that do not necessarily align with calendar years. It also allows the most recent data to be included (indicated by a red circle and label) and compared with earlier values on a like-for-like basis (avoiding comparing a partially-complete current year with complete previous years).
Figures for two datasets are provided. HadCRUT5 (Morice et al. 2021) is the global average of land and marine data. CRUTEM5 (Osborn et al. 2021) is the global average over the land surface only.
Click for larger image
References
- Osborn, T.J., Jones, P.D., Lister, D.H., Morice, C.P., Simpson, I.R., Winn, J.P., Hogan, E., and Harris, I.C., 2021: Land surface air temperature variations across the globe updated to 2019: the CRUTEM5 dataset. Journal of Geophysical Research: Atmospheres. 126, e2019JD032352, doi:10.1029/2019JD032352
- Morice, C.P., Kennedy, J.J., Rayner, N.A., Winn, J.P., Hogan, E., Killick, R.E., Dunn, R.J.H., Osborn, T.J., Jones, P.D., and Simpson, I.R., 2021: An updated assessment of near-surface temperature change from 1850: the HadCRUT5 dataset. Journal of Geophysical Research 126, e2019JD032361, doi:10.1029/2019JD032361