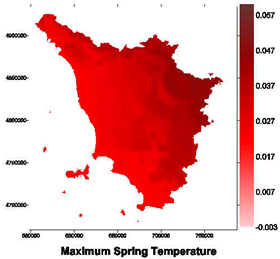
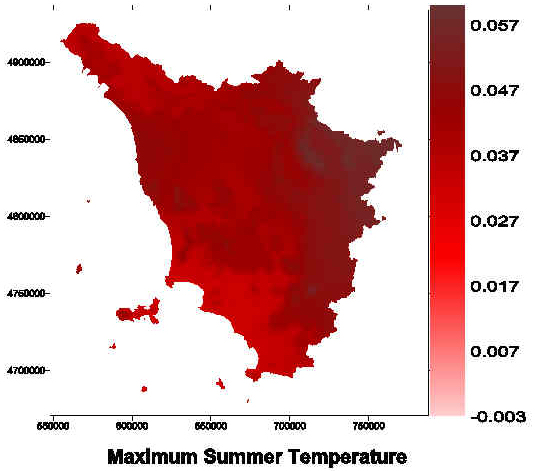
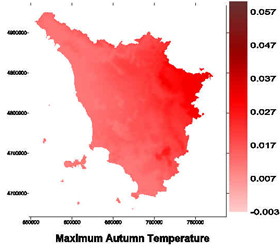
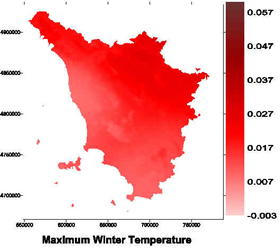
Indicator spatial plots:
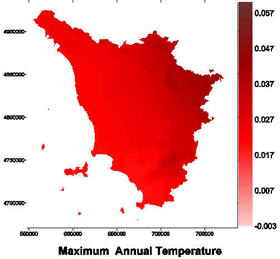
Maximum temperature, Tuscany, Italy
The following spatial (with a resolution of 1 km) are interpolated from daily gridded data (with a spatial resolution of 25 km) extracted from the E-obs dataset (from the EU project ENSEMBLES). Plots illustrate the spatial variation in annual maximum temperature trends, and seasonal (spring, summer, autumn, winter) maximum temperature trends, for the years 1951 to 2006.
 |
 |
 |
 |
 |
|