Indicator spatial plots:
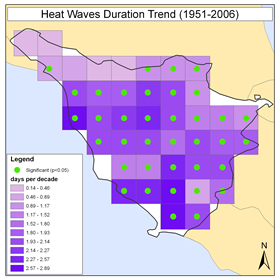
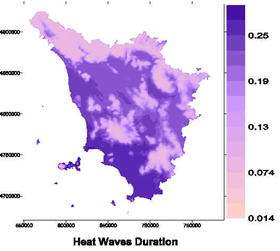
Heat wave duration index, Tuscany, Italy
The following spatial (with a resolution of 1 km) are interpolated from daily gridded data (with a spatial resolution of 25 km) extracted from the E-obs dataset (from the EU project ENSEMBLES). Plots illustrate the spatial variation in trends in the heat wave duration index (HWDI), for the years 1951 to 2006.
 |
 |