Indicator plots: Maximum temperature Tuscany, Italy
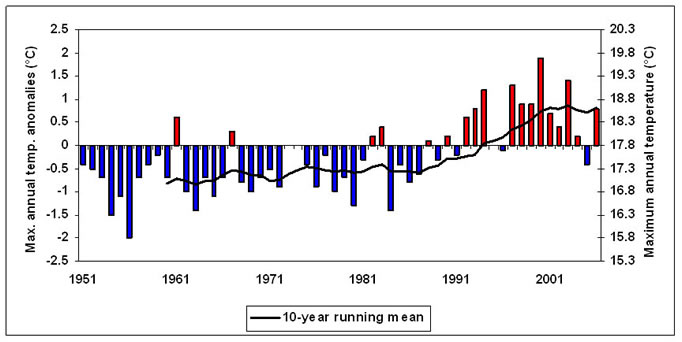
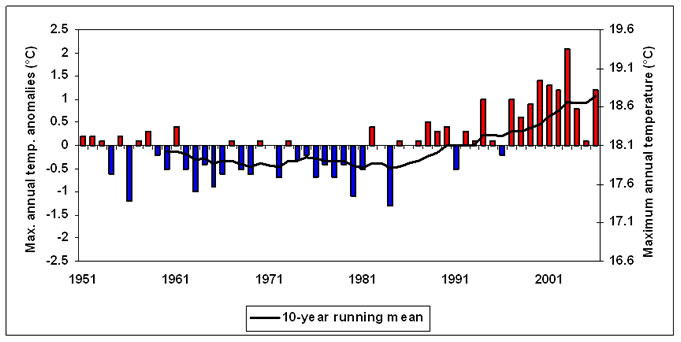
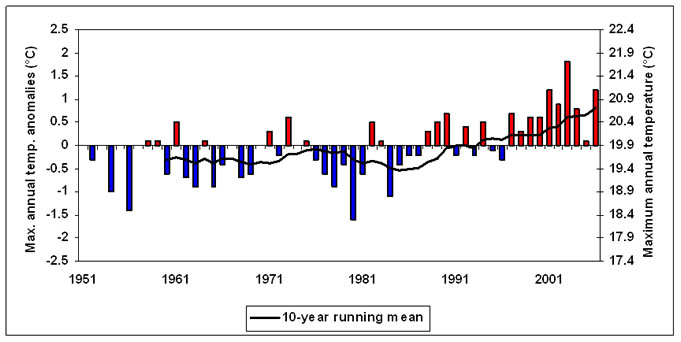
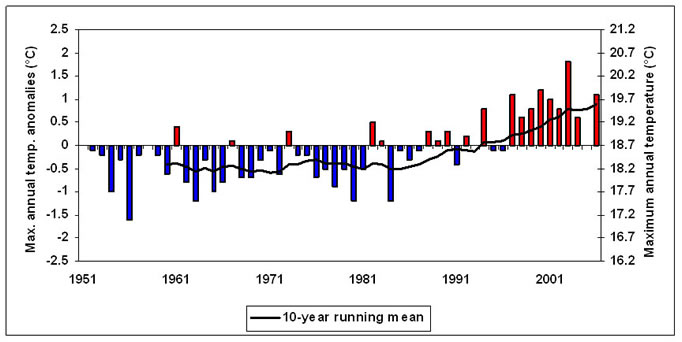
The following time-series plots are calculated from daily gridded data (with a spatial resolution of 25 km) extracted from the E-OBS dataset (from the EU project ENSEMBLES). Plots are shown (data underlying the plots are available as a csv file) for four representative grid squares for which coordinates of the centroid are listed below:
- Firenze (43.88 °N, 11.38°E)
- Grosseto (42.88 °N, 11.38°E)
- Livorno (43.62 °N, 10.38°E)
- Siena (43.38 °N, 11.12°E)
Firenze: Annual maximum temperature, 1951-2005
 [
[Grosseto: Annual maximum temperature, 1951-2005
 [return to top]
 [
[ [
[