Advancing the Use of Historical Environmental Data through the Climate Database Modernization Program
Eric Freeman, Clive Wilkinson et al.
NOAA's Climate Database Modernization Program (CDMP) has been rescuing
environmental data for more than ten years. During that time, information located
on fragile media has been imaged and preserved, and historical data has been
digitized to provide access to more than 55 million imaged records previously
difficult to obtain or fully unavailable to the public. CDMP rescues many types of
data, including ocean, terrestrial, and upper air. By digitizing national and
international ship logbooks, global observations over the oceans are being made
available to the International Comprehensive Ocean-Atmosphere Dataset
(ICOADS) to enhance the spatial and temporal coverage of the most extensive
surface marine meteorological archive in the world. Marine rescue efforts are not
limited strictly to surface meteorological observations and also include projects
related to sub-surface ocean observations, as well as biological and marine
ecosystems information. CDMP coordinates with the RECovery of Logbooks And
International Marine data (RECLAIM) project to locate, document and prioritize
the rescue of new sources of data and metadata for future projects with the goal
of increasing awareness and understanding of historical observing practices as
well as augmenting data coverage in sparsely observed areas. Over the past
decade, CDMP has also digitized large amounts of terrestrial data from data
sparse areas around the globe. These data are essential to the International
Surface Temperatures Initiative, a renewed effort at creating a
comprehensive international data holding of all land meteorological data to
address gaps including inadequate temporal and spatial coverage. By
working with private and public sector partners towards a mission to make data
available for science, CDMP is advancing understanding of the earth's physical
environment and preserving the past for generations to come.
Blocking-related extreme weather events in the LMDZ4 atmospheric model: Sensitivity to model resolution
Jessica Vial, Tim J. Osborn and Laurent Li
In the mid-latitudes, extreme weather events are
often caused by persistent and quasi-stationary
weather regimes, such as blocking. As a result, a
realistic representation of this phenomenon in
climate models is essential in order to provide
credible projections of climate change scenarios.
This study examines the ability of the AGCM LMDZ4
(IPSL,France) to simulate winter atmospheric
blocking and its relationship with temperature and
precipitation extremes in the Europe.
A daily gridded dataset for southern North America
J.L. Vazquez-Aguirre
Data grids derived from irregularly spaced observations
are often required in climate analyses. Some uses of
gridded data are the calculation of area-averaged
indices, application of multivariate techniques, objective
analysis, model verification and integrated
assessments. At present, most gridded datasets are
available at the monthly time-scale (high spatial resolution)
or for relatively low spatial resolutions (daily
time-scale reanalysis). Therefore a new daily gridded
high-resolution data set of precipitation and surface
temperature is being created for the area of Mexico and
the southern conterminous United States of America.
Status of Societal and Economic Research and Applications (SERA) for weather and climate information in Mexico
J.L. Vazquez-Aguirre and J. Cervantes-Perez
Recent activities by the World Weather Research Programme and THORPEX led to propose a framework
for Societal and Economic Research and Applications (SERA) of weather and climate information
(Morss et al., 2007, BAMS). Five areas emerged for further research and applications:
a) Understanding the use of forecast information in decision-making; b) communication of forecast uncertainty;
c) user-relevant verification of forecasts; d) economic valuation of forecasts and
e) development of decision support systems and tools. This poster summarizes some aspects related to
observed high-impact weather, availability of weather forecasts and the work conducted with user communities,
for the case of Mexico. Use and perception of weather forecasts are depicted from an electronic survey
conducted at the end of winter 2008-2009 through the National Meteorological Service (SMN) webpage.
Identifying changing climate responses of boreal forest trees in northwestern Canada
J. Barichivich, K. Briffa, K.J. Anchukaitis, D. Sauchyn, and T. Melvin
Tree growth at high northern latitudes has
provided a detailed history of extra-tropical
Northern Hemisphere temperature variability
over most of the last millennium. Contrary to
what might have been expected, recent tree
growth in some circumpolar locations does not
appear to be tracking the strong warming trend
of the past few decades. This apparent
sensitivity change in tree growth has been
described as the "divergence problem". It has
important implications for the interpretation of
paleoclimatic reconstructions based on treerings
and for the global carbon cycle. There is no
consensus on the causes or if the problem is
real or is just an statistical artifact of tree-ring
methods.
Assessment of Atmosphere-Ocean General Circulation Model Simulations of Northern Hemisphere Atmospheric Blocking
J. Vial and T. Osborn
Atmospheric blocking are large-scale, quasi-stationary and persistent anticyclones that
block or deflect the progression of transient smaller-scale weather systems.
They are often responsible for temperature and rainfall anomalies, and sometimes lead to
extreme weather events.
In summer 2003, a heat wave developed during a strong and persistent blocking high located over western Europe.
This event caused the death of 35.000 people, an economic loss of several million Euros mainly
due to a deficit in agricultural production, and severe environmental damage such as forest fires
due to extremely high temperatures (De Bono et al., 2004).
The ability of six coupled atmosphere-ocean general circulation models (AOGCM) to simulate the
frequency and the duration of atmospheric blocking in the Northern Hemisphere is assessed.
It will contribute to increase our understanding of the mechanisms responsible for the formation
and the maintenance of atmospheric blocking, and its impact on extreme weather events.
It will also help to indicate the confidence that we have in future projections of extreme
weather events that are often the product of large-scale weather regimes such as blocking.
Climate variability and changes in the climate extremes of Mexico as detected from the global to the local scale
J. L. Vazquez-Aguirre and P.D. Jones
Analysis of daily instrumental data allowed the IPCC AR4 to reveal the global
picture of observed changes in the extremes of temperature and precipitation. Further
studies over North America (Canada, the United States and Mexico), focused
in the percentile-based indices, and showed consistent trends with a warming of
the climate system. Both assessments used the indices approach proposed by the
WMO/CLIVAR/JCOMM Expert Team on Climate Change Detection and Indices.
Here, the same indices were calculated for as many locations as possible in eastern
Mexico. The comparison of changes in climate extremes as detected from the global
to the local scale suggests that some of the local changes are in phase with the largescale
signal. However, exploratory analysis of the natural variability show that lowfrequency
oscillations and inter-annual variability will also play a major role in the
modulation of the extremes (i.e., the first three principal components of summer rainfall
in the region were found to be well correlated to the global temperature record,
the Atlantic multi-decadal oscillation and the Niño 3.4 index). Since both, changes in
the extremes and natural climate variations are expected to have increased impacts in
the region, adaptation and decision-making strategies will require climate diagnostics
as specific packages of user-oriented information.
RECLAIM - RECovery of Logbooks And International Marine data
C. Wilkinson, S. Woodruff, E. Freeman, P. Brohan, F. B. Koek and D. Wheeler
A cooperative international project to image historical ship logbooks and
related marine data and metadata, and digitize the meteorological and oceanographic
observations for merger into the International Comprehensive Ocean-Atmosphere Data
Set (ICOADS) and for utilization for climate research.
Climate impacts of the Southern Annular Mode simulated by the IPCC AR4 models
A. Karpechko, N. Gillett, and G. Marshall
We assess the ability of the CMIP3
models used for the 4th IPCC assessment
report to simulate the climate impacts of
Southern Annular Mode (SAM).
The models simulate realistic spatial
patterns of surface air temperature (T) and
precipitation response to the SAM, but the
magnitudes of the T response is
underestimated. The simulated patterns of
SST and sea ice response are less realistic.
The quality of simulation varies strongly
between models. There is some correlation
between model skill in simulating responses
in different parameters, with models good
at simulating one parameter also being good
at simulating others.
The underestimation of the temperature
response to the SAM means that the models
likely underestimate the temperature
response to future changes in the SAM. In
boreal summer this is likely to lead to an
underestimation of the warming over the
Antarctic continent associated with ozone
recovery.
The role of eddies in determining the Southern Ocean response to the Southern Annular Mode
J. Screen, N. Gillett, D. Stevens, G. Marshall and H. Roscoe
The Southern Ocean shows a clear response to the Southern Annular Mode (SAM). A positive shift in the SAM is associated with cold sea surface temperature (SST) anomalies centred at 60°S and warm SST anomalies centred at 40°S, and increases in the transport of the Antarctic Circumpolar Current (ACC). It has also been shown that Southern Ocean eddy activity increases when the SAM is in it's positive phase. Eddies may act to reduce the SST response to the SAM by increasing southward heat transport, and reduce the ACC zonal transport response to the SAM by transferring momentum downwards in the water column. Consequently the Southern Ocean response to the SAM may be difficult to capture exactly with climate models that do not resolve eddies explicitly.
Results are presented from the OCCAM ocean model which is run at 3 spatial resolutions - 1°, 1/4° and 1/12° -
from coarse to eddy-permitting. Comparing coarse with fine resolutions indicates the effect of explicitly-resolved
eddies on the Southern Ocean response to changes in the SAM. The observed SST response to the SAM is well represented
by all resolutions of the model. The regressions between monthly Drake Passage transport anomalies and the SAM
are not significantly different in the three model resolutions. These results are encouraging for climate modellers
as they suggest that low (1°) resolution models are able to capture the main features of the Southern Ocean
response to the SAM on monthly timescales. However, preliminary results suggest that the response of the
Southern Ocean eddy field to the SAM is lagged by 2-4 years. Consequently, over inter-annual timescales
eddies may play a more important role.
Determining the impact of lower stratospheric ozone depletion on Southern Hemisphere climate
Sarah P.E. Keeley and Nathan P. Gillett
There has been strong stratospheric ozone depletion in the Southern Hemisphere since the 1980s. Ozone losses in the Southern Hemisphere occur from 250-20 hPa and are seasonally dependent, with the maximum losses occurring during October. Sonde measurements taken from different Antarctic stations have shown that the ozone depletion occurs later at lower altitudes.
Over the same period as the ozone depletion there has also been an observed downward trend in the geopotential height and temperature over Antarctica in the spring and summer months. The stratospheric trends peak in November, whereas the tropospheric trends are largest in December and January. Surface temperatures are most sensitive to ozone loss near the tropopause, therefore we hypothesise that the observed tropospheric response is forced mainly by ozone depletion in the lower stratosphere (below 160 hPa).
In this study the climate response to ozone depletion is simulated using the higher vertical
resolution, 64 level, Hadley Centre atmosphere model coupled to a slab ocean.
We have considered changes in the ozone concentration limited to the region near
the tropopause to determine the impact of summer ozone radiative forcing in the
lower stratosphere. Preliminary results suggest that changes in the lower stratospheric
ozone concentration do not have a large impact on the tropospheric climate. This suggests
that the tropospheric response is forced mainly by the depletion in the midstratosphere.
How and why is global temperature changing?
Clare Goodess
Created for the BA Festival of Science 2006 "Beer today, champagne tomorrow" event
Predicting future climate change for the UK and East Anglia
Clare Goodess
Created for the BA Festival of Science 2006 "Beer today, champagne tomorrow" event
Assessment of Daily Rainfall Variability in Climate Model Simulations Using Estimations of Areal Rainfall
Carol McSweeney, Tim Osborn, Phil Jones, Nick Reynard and Kevin Hiscock
Variability in daily precipitation simulated by coarse scale climate models can be difficult to validate against station records because the level of variability in spatially averaged rainfall is not comparable to that of point rain-gauge observations.
Whilst for some regions, this can be overcome by using a large number of stations to give an areal average, for many regions the density or distribution of observations may not be sufficient to give a 'true' areal mean, and the result may mean that our baseline climate is biased.
The objective of this work is to estimate some of the properties of 'true' areal means, using only a small sample of stations.
These estimates of areal precipitation variability can then be used to validate climate model daily precipitation simulations.
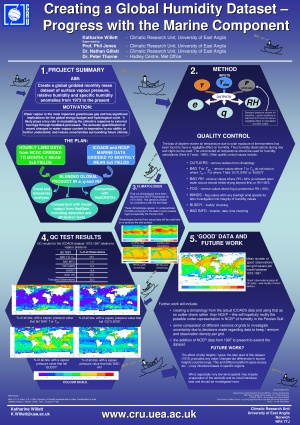
Creating a Global Humidity Dataset - Progress with the Marine Component
Katharine Willett
Aim: Create a global gridded monthly mean dataset of surface vapour pressure, relative humidity and specific humidity anomalies from 1973 to the present.
Motivation: Water vapour is the most important greenhouse gas and has significant implications for
the global energy budget and hydrological cycle. It likely plays a key role in modulating the
climate's response to external forcings through feedback processes. The accurate quantification
of recent changes in water vapour content is imperative to our ability to further understand,
and reduce uncertainties surrounding future climate.
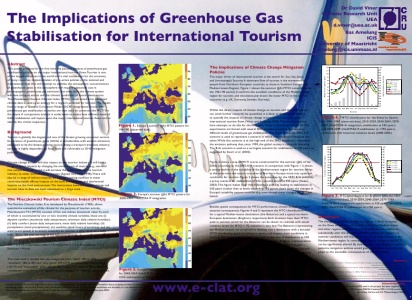
The Implications of Greenhouse Gas Stabilisation for International Tourism
David Viner and Bas Amelung
This poster presents for the first time the possible impacts of greenhouse gas stabilisation policies
on the major international tourism flows. Tourism is one of the largest industries in the world and a
vital component for the economy of many countries. Implementation of pro-active policies at the national
and international level that will attempt to stabilise the atmospheric concentrations of greenhouse gases
in the atmosphere will require substantial cuts in anthropogenic greenhouse gas emissions. But even then,
the climate system will have changed, and so will the climatic conditions of tourist destinations.
The Mieczkowski Tourism Climatic Index (MTCI), constructed from observed climate data is used as an
analogy for a region's potential for tourism. The results from a range of General Circulation Model (GCM)
integrations forced with greenhouse gas stabilisation scenarios are then used to construct the MCTI
for the future. A comparative analysis is undertaken to assess how different levels of GHG stabilisation
will impact upon the major international tourism flows and to identify the critical responses.
The winter North Atlantic Oscillation in the IPCC AR4 climate simulations
Tim Osborn
This poster builds upon the earlier work of Osborn et al. (1999), Ulbrich et al. (1999), Zorita & Gonzalez-Ruoco (2000), Osborn (2004) and others, in evaluating and applying climate model simulations to answer a number of questions about the North Atlantic Oscillation (NAO). This study expands the comparison to include many different global climate models, using simulations undertaken for the IPCC 4th assessment report. The pattern of present-day winter circulation variability is identified in each model and compared with observations. The response of the mean circulation to increasing greenhouse gas forcing is also diagnosed: in many cases this represents an increase in the strength of the westerlies across the North Atlantic, and thus corresponds with an increase in the NAO index. Other than this shift in the mean circulation, there does not appear to be a clear change in the pattern of variability under the future climate - at least not one that is consistent across the range of climate models analysed here.
March 2005 (Workshop on analyses of climate model simulations for the IPCC AR4, University of Hawaii, Honolulu, Hawaii, USA)
Spatial properties of seasonal rainfall in southeast England
Marie Ekström and Adrian Chappell
Interpolated rainfall fields are important inputs to agricultural, hydrological and
ecological models and serve to enhance our understanding of environmental systems
and hence the natural and anthropogenic impacts on the surface environment.
However, the large temporal and spatial variability in rainfall makes this variable
difficult to estimate at unsampled locations, particularly when station network is highly dispersed.
In this article, we present preliminary work within the Marie Curie Framework 6 project GAP
(Geostatistical Analysis of Precipitation).
Using one year of rainfall data, seasonal rainfall patterns are investigated for South East England.
Both seasons showed anisotropic conditions with greater dependence in the W-E direction.
The parameters of the models fitted to the directional variograms showed a larger range,
but substantially smaller sill, for the summer season compared to those variograms of the winter season.
Seasonal rainfall depth maps were derived using Simulated Annealing (SA) and Ordinary Kriging (OK).
The two methods showed large differences in terms of local and regional variability, with smooth
patterns associated with the OK maps and larger spatial variability associated with the SA maps.
Both methods however, captured the large scale patterns that are typical to
summer and winter rainfall in the study region.
We suggest that the optimized patterns using SA could provide an alternative to OK,
particularly for high temporal resolution rainfall data when OK produce unrealistically smooth maps.
Investigating the role of surface water vapour content changes in recent climate
Katharine Willett
Atmospheric water vapour plays a key role in the climate system.
In the light of recent changes in global annual mean temperatures,
the quantification of recent changes in water vapour content will
be a valuable tool to our understanding of the climate system.
This project attempts to further work of others such as
New et al. (1999, 2000) in producing a comprehensive gridded
global product of monthly mean surface vapour pressure.
It will combine hourly data from the Hahn (1971 - 1996)
and ISH NCDC (1945 - 2003) datasets with Mark New's monthly mean
vapour pressure (1961-1995) and marine data from ICOADs.
Homogenisation technique and methods for creating monthly means will be a particular focus.
Finally, the global product will be used in comparison with model output
from various runs of the Hadley Centre models (HadCM3 / HadGEM) to
address the question as to whether the models adequately resolve both the variability and trends.
Variability and Extremes of Rainfall at Different Spatial Scales
Carol McSweeney
Issues of spatial scale present a number of problems in the evaluation and application of climate model output.
Whilst the mean is unaffected by spatial scale, the distribution of daily rainfall totals will alter depending on the
size of the area represented such that the variance, for example, of daily rainfall observations at a point will be
greater than that of a regional average surrounding that station.
It is generally accepted that climate models generate output which represents the grid-box scale, which presents
us with a mismatch between
a) the point observations used to evaluate model output; and
b) the resolution of scenarios required for many areas of climate impact assessment.
The high degree of spatial and temporal variability in precipitation, and the particular interest in the magnitude of
that variability and extremes of the rainfall process, mean that this issue is of particular importance in
assessments of model skill and future scenarios of change in precipitation regimes.

Climate Change and Tourism
David Viner and Bas Amelung
Climate change will have a range of direct impacts on
the tourism industry by changing the environment
of resorts (e.g., sea-level rise, temperature, etc.)
and it will increase the vulnerability of the tourism
industry to other environmental changes. There
will also be a range of indirect impacts, for example:
raising conflicts in water resources; health effects;
impacts on the built environment; and detrimental
impacts on the local environment. Tourism
through increasing emissions (aviation emissions
are estimated to be the fastest growing source)
of greenhouse gases (GHGs) is in turn having
an impact upon the climate system. Therefore,
the introduction of GHG mitigation policies will
impact on tourism. These interactions between
climate change and tourism have to date not been
examined on a large scale.
HadAT1: a new gridded radiosonde temperature product
Peter W. Thorne, David E. Parker, Simon F. B. Tett, Phil D. Jones, and Mark McCarthy
Recent studies highlight the degree of uncertainty in upper-air temperature records and the effect that this can have upon e.g.
detection studies. It is imperative that we create multiple independent long-term homogeneous timeseries to fully
investigate and understand this uncertainty. The Hadley Centre's current radiosonde-based global gridded upper-air product,
HadRT2.1s, has major limitations regarding the selection of potential break-points and their treatment with MSU satellite
based co-located series, limiting our corrections solely to post-1979. These corrections reduce the dataset's spatio-temporal
consistency and independence from MSU. We aim to address these deficiencies in creating our new dataset: HadAT1.
New gridded daily rainfall data for the Sahel
Andrew Matthews, Tom Holt and Jean Palutikof
Rainfall in the Sahel, West Africa, is characterised by high interseasonal variability and has suffered
frequent severe droughts since the late 1960s, suggesting a change in the rainfall regime (Hulme, 2001).
In order to create a spatiially homogenous daily rainfall dataset suitable for unbiased statistical analysis,
a gridded dataset has been created using stations in Burkina Faso, Mali, Niger and Senegal. A smoothing
thin plate spline has been used to create a daily gridded rainfall series at a 1° resolution.

Assessment of HadRM3 Extreme Precipitation in the UK
Marie Ekström and Phil Jones
Climate change impacts on extreme rainfall in the United Kingdom (UK) present a major concern regarding their
effects on water resources and hydrology. Climate model output gives some guide to the magnitude of future changes.
However, the modelling involves many parameterisations of sub-grid processes.
Validation of model estimates with observed data is therefore essential to assess the reliability of modelled rainfall extremes.
This study compares return period magnitudes in rainfall based on the Hadley Centre regional model (HadRM3) data
and on observed data for the period 1961-1990.
Statistically downscaling from an Earth System Model of Intermediate Complexity to reconstruct past climate gradients across the UK
Mark Hoar and Jean Palutikof
Earth System Models of Intermediate Complexity (EMICs) allow the simulation of climate over Glacial-Interglacial Cycles.
To add finer detail to the coarse spatial resolution of these models, a statistical downscaling approach can be used.
Based around the Louvain-la-Neuve EMIC, MoBidiC, we are developing a methodology which uses full three-dimensional
General Circulation Models (GCMs) as an intermediate step in the downscaling. The first requirement is to select the GCM.
Correlation matrices and hierarchical cluster analysis have been used to compare 21 PMIP GCMs and 6 sensitivity studies
for a domain 38N13W to 65N30E for the present day, mid-Holocene and Last Glacial Maximum time slices.
Downscaled information is required along four transects within this spatial domain.
Along these, the GCMs have been compared with observed climate and proxy palaeoclimate data for the same time slices.
This has been done using correlation matrices and root mean squared errors, with and without the linear trends of the
transects removed.
K-means cluster analysis is used to define the 'best' model or best group of models based on these statistics.
The second step in the downscaling is to use an objective measure to fit a suitable polynomial to the 'best' curves
obtained for each time slice.
The polynomials can then be linked to the output of the Louvain EMIC to produce transects for any period during the last 123 kyr BP.
Although this methodology has been developed for the Louvain models, it is hoped that it can be applied to the output
from other EMICs and for long-term future climate change.
Regional Climate Model Simulations of Daily Maximum and Minimum Near-Surface Temperatures Across Europe 1961-1990: Comparisons with Observed Station Data
Anders Moberg and Phil D. Jones
High-resolution (~50 km) dynamic Regional Climate Models nested
in Global Climate Models (GCM) are becoming an increasingly important tool in climate research.
HadRM3H is the latest RCM from the Hadley
Centre, with a resolution of 0.44° lat/lon. It is forced at its lateral boundaries by an atmosphere-only
GCM (HadAM3H). Both models have 19 vertical layers. HadAM3H was run driven by observed 1961-90
sea surface temperatures and sea ice. Initial conditions were interpolated from a transient model
run with a coupled ocean-atmosphere model, where greenhouse
gases and aerosols were successively increased from 1860 to 1990. An ensemble
of three members has been obtained for the 1961-90 period, by starting transient runs from different
points in a long unperturbed control run.
Development of High Resolution Weather Scenarios for the EPSRC/UKCIP Initiative
Clare Goodess
In order to develop high-resolution climate change scenarios for key locations, this project will use computer-based weather generators and statistical models to produce common source datasets for the other projects in the programme. The basis of this additional data will be the UKCIP02 climate change scenarios, which will be developed for shorter time periods (daily and sub-daily) and higher spatial resolution (5 km grid boxes and point locations rather than a 50 x 50 km grid), focusing on climate variables which are of greatest concern to the built environment. The project will also address issues of scenario uncertainty and provide further information on potential changes in the "urban heat island" effect.
This project will act as a service to the other projects in the initiative and
develop best practice in the application of climate change scenarios. At the end of
the project, the new scenario data that is generated will be made more widely available.
MICE / PRUDENCE / STARDEX
Tom Holt
Three projects funded by the European Union to examine climate change and extreme events.
See also MPS Portal
Relationships between winter circulation patterns and temperature and precipitation over Greece
Effie Kostopoulou, Phil Jones and Trevor Davies
Study of the atmospheric circulation during the winter period over the
eastern Mediterranean region has been undertaken, in order to develop a
map-pattern classification over the area. NCEP Reanalysis data have been
used for three levels, geopotential heights at 500 and 850 hPa and sea level
pressure data. Daily data spanning a period of 43 years were used for the
area 5° to 35° E and 25° to 55° N. A Rotated Principal Component Analysis
(RPCA) has been employed, then specifying a maximum and a minimum threshold
regarding the PC-scores a number of groups of days were created. Based on
these groups of days the dominant circulation patterns over the study area
were identified. The influence of these patterns in the Greek area was
studied using observational data from twenty-one meteorological stations
around Greece. The observational data are composed of mean daily, maximum
and minimum temperature, daily range of temperature and precipitation. Using
the day-groups, which were identified by the RPCA, the spatial distribution
of the observational data was studied and its relationships with the
corresponding circulation patterns. Trends and persistence of patterns have
been studied with a focus on those that lead to extreme events in the region
such as low temperatures and/or heavy precipitation.
A multivariate analysis of the NAO influence on Europe: climate impacts and associated physical mechanisms
Ricardo M. Trigo, Timothy J. Osborn and João M. Corte-Real
A multivariate analysis of the influence of the North Atlantic Oscillation (NAO) on the climate of the North Atlantic and European sectors is presented using the 40 year (1958-97) consistent data set from NCEP. Anomaly fields of climate variables are then interpreted based on physical mechanisms associated with the anomalous mean flow (characterised by the surface wind field) and the anomalous eddy activity, characterised by the surface vorticity and the 500 hPa storm track fields. It is shown that NAO-related temperature patterns are mainly controlled by the advection of heat by the anomalous mean flow. However, large asymmetries between minimum and maximum temperatures, and more significantly, between positive and negative phases of NAO imply the importance of a different mechanism, namely the modulation of short wave and long wave radiation by cloud cover variations associated with the NAO. Furthermore, NAO influence over two different precipitation-related variables, namely, precipitation rate and precipitable water display different patterns. Precipitable water is shown to be strongly related to the corresponding anomaly fields of temperature while. precipitation rate appears to be controlled by the surface vorticity field and associated strength of the tropospheric synoptic activity.
Because of production difficulties, this PDF file is unusually large (20MB).
If you just want to read the poster or print it out A4 size (300dpi)
you may prefer to download a 2356x3151 pixel GIF (564KB)
of the poster instead.

Climate Change and Tourism
Dr. David Viner, Dr. Maureen Agnew
This poster summarises a report commissioned by the World Wide
Fund for Nature (WWF-UK)and a paper prepared for the International
Conference on Tourism and Hospitality in the 21st Century (11-14th
January,2000,University of Surrey).These publications review the
impacts of climate change for a wide range of international holiday
destinations visited by UK tourists.
What do climate models tell us about the winter North Atlantic Oscillation?
Timothy J. Osborn, Phil D. Jones
This poster builds upon the earlier work of Osborn et al.
(1999), Ulbrich et al. (1999), Zorita & Gonzalez-Ruoco (2000)
and others, in evaluating and applying climate model simulations
to answer a number of questions about the North Atlantic
Oscillation. This study expands the comparison to include six
different global climate models, and is being written up with full
details and an extended discussion for submission to a scientific
journal. Throughout this work, seasonal-mean winter (December
to March) sea level pressure (SLP) data are used, and the
North Atlantic Oscillation and its index are defined as the leading
empirical orthogonal function (EOF) and associated principal
component (PC) time series of the Atlantic half of the Northern
Hemisphere SLP field.

Suitability of the 3D radiosonde temperature field for climate change detection and attribution studies
P.W. Thorne, P.D. Jones, T.J. Osborn, T.D. Davies, S.F.B. Tett, D.E. Parker
Presented at RMS 150th Anniversary Conference (July 2000), Cambridge, UK
Previous climate change detection and attribution studies have
considered either surface patterns of temperature change
or zonally averaged vertical profiles of temperature change.
Here we investigate the potential for using the full field of
upper air radiosonde temperartures from the HadRT2.1 dataset
in formal detection and attribution studies. These are
compared qualitatively with output from ensemble simulations
with the HadCM2 climate model under various forcings
provided through the Climate Impacts LINK Project.
Severe Windstorms in Europe
Clair Hanson, Jean Palutikof, Tom Holt
Europe is vulnerable to the impact of storms developing across the North Atlantic.
Investigating changes in the behaviour of these storms can help us mitigate against the severest events to minimize
human and economic losses.
This study focuses on the variations in storm activity across the North Atlantic and the impact of storms on
Northwest Europe by developing a storm climatology of the region and a storm damage model.
Intra-Ring Growth Parameters In Dendrochronology
Thomas M. Melvin, Keith R. Briffa
Presented at International Meeting on Dendrochronology (April 2000), Mendoza, Argentina
This work forms part on an ongoing project to examine the modelling of tree ring growth and the changing sensitivity of that growth to climate.The independence of the common signals from intra-ring parameters in terms of crossdating ability and the changing relationships of these signals with climate on inter-annual to inter-decadel timescales is examined.
The potential for gaining added dendrochronological "value" by using sub-ring parameters rather than simple total
ring-width data is explored in example northern boreal locations, Rorstaddalen and Borareloa in western Norway.
Two sites of Pinus sylvestris L. were chosen where there is a long meteorological record and an expectation of a
strong positive response to summer temperature.
Large-scale temperature information in tree-ring density data
Keith R. Briffa, Timothy J. Osborn, Fritz H. Schweingruber, Stepan G. Shiyatov, Eugene A. Vaganov, Philip D. Jones, Ian C. Harris
There now exists a growing network of temperature-sensitive tree-ring density chronologies spanning much
of the higher-latitude and high-elevation regions of the Northern Hemisphere. Here we present several illustrations
of the large regional-scale nature of the temperature signal in many of these data
collected from generally cool and moist sites spread
across the western United States, Canada, Europe, Fennoscandia and northern Siberia.
We show some examples of the information that has been gleaned about
past temperature variability from these data.
Changes in the intensity of daily precipitation over the UK
Timothy J. Osborn, Mike Hulme, Phil D. Jones, Phil A. Reid
The Potential Impact of Climate Change in the Norfolk Arable Land Management Initiative (NALMI) Area over the next 30-50 Years
David Viner, Andrew Jordan, Irene Lorenzoni, David Favis-Mortlock
This poster presents climate change scenarios up to the 2050s and related impacts for the NALMI area of
Norfolk. In this work funded by the Countryside Agency we analysed the impacts of climate change upon
the thirteen parishes of the NALMI Region.
The winter North Atlantic Oscillation
Timothy J. Osborn, Keith R. Briffa, Edward R. Cook, Michael E. Mann
Two-dimensional modelling of Past and Future Climate Change and Comparison with PMIP Simulations
Paul Burgess, Sarah Watkins, Clare Goodess, Jean Palutikof

The Climate Impacts LINK Project
David Viner
Applying results from the Hadley Centre's climate change experiments for climate change impacts assessments.