
How to cite: Osborn et al. (2016)
Quick links: Overview : Mean temp : Min temp : Max temp : Diurnal temp range : Precip : Cloud : Vapour pressure
Climate observations - mininum temperature
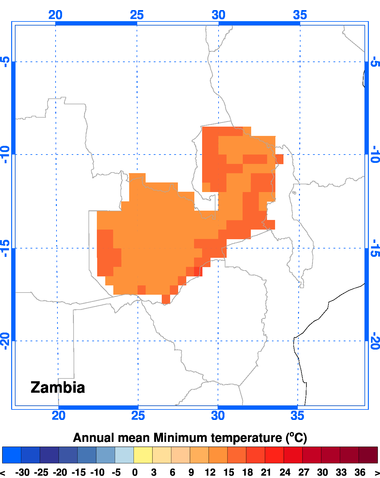
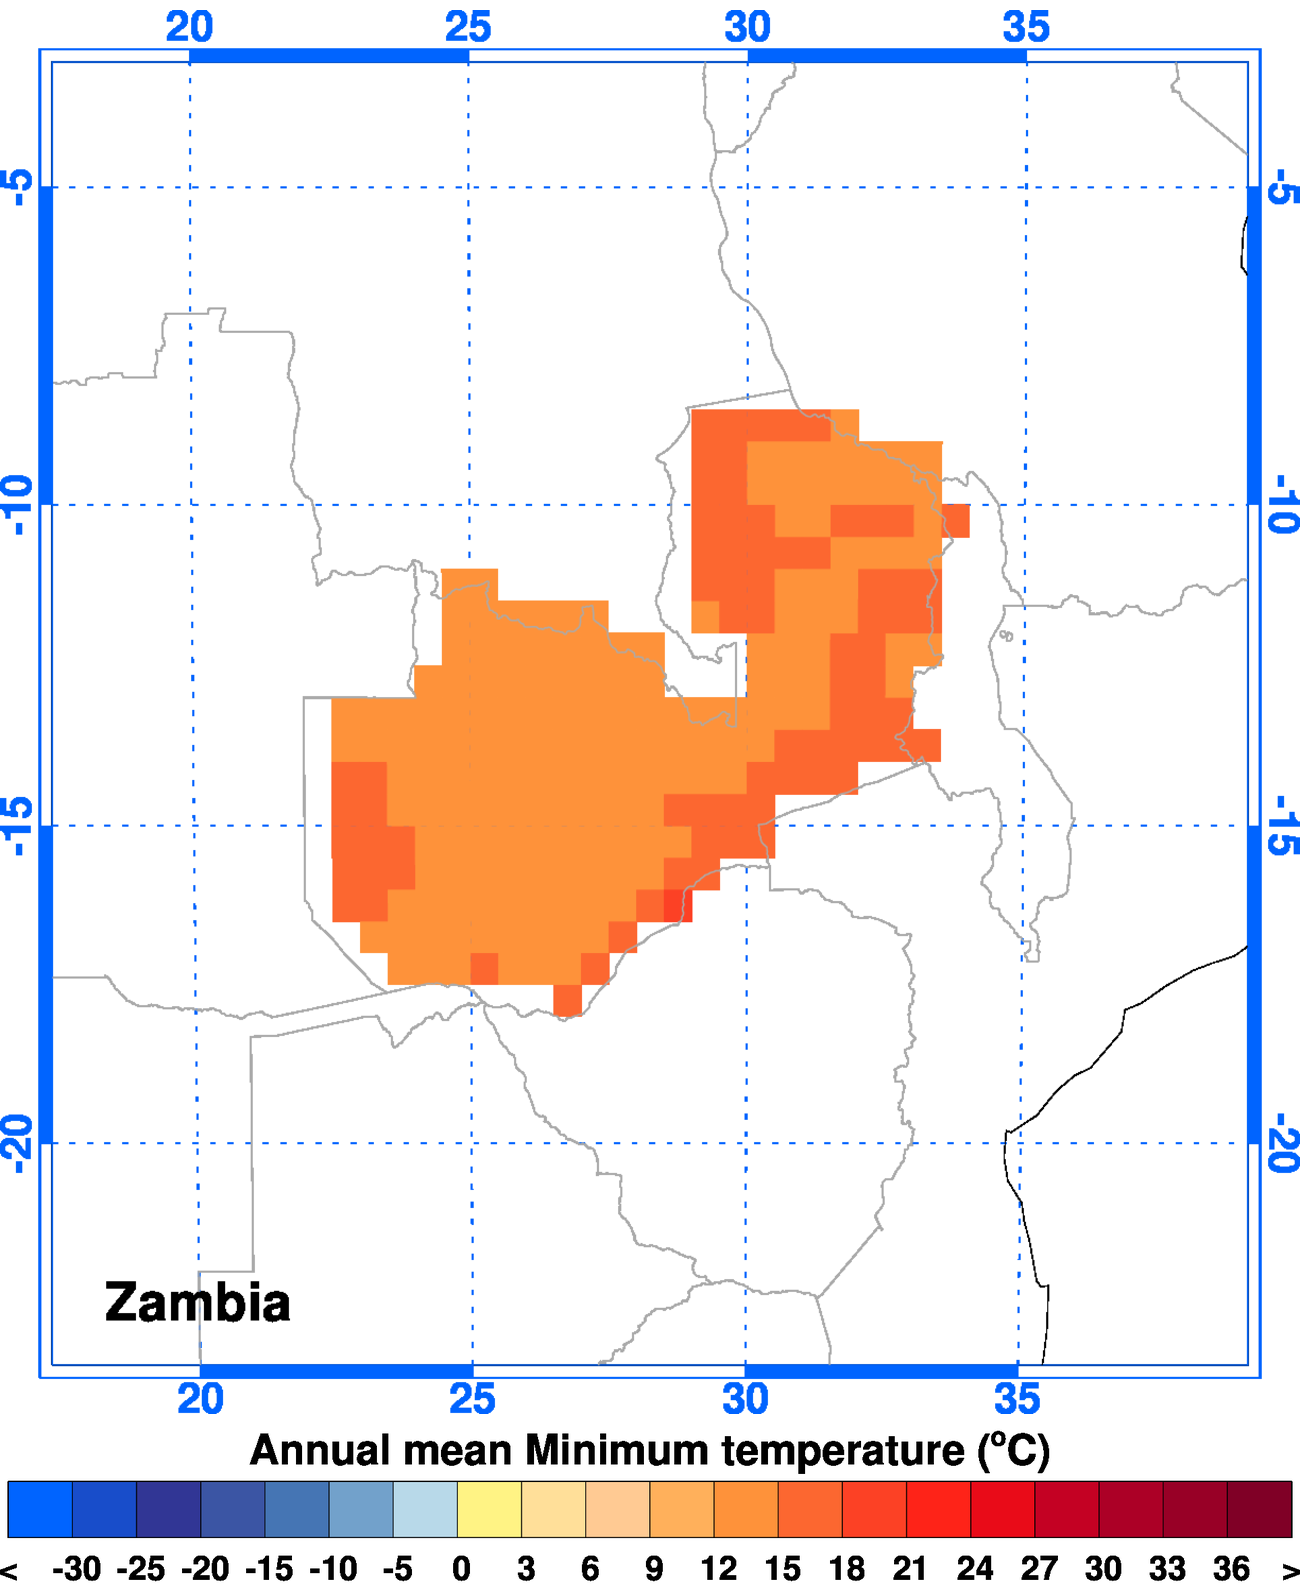
Although this resource deals mostly with national average climates, it is important to take into consideration the geographical variations in climate that occur across countries. A national average may not be very appropriate when considering countries that include different climate regimes, strong contrasts in orography, etc. Maps are included here to show the geographic variations.
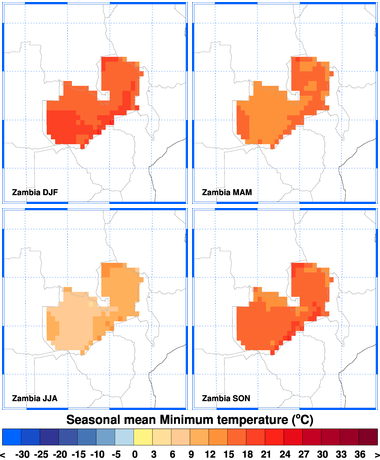
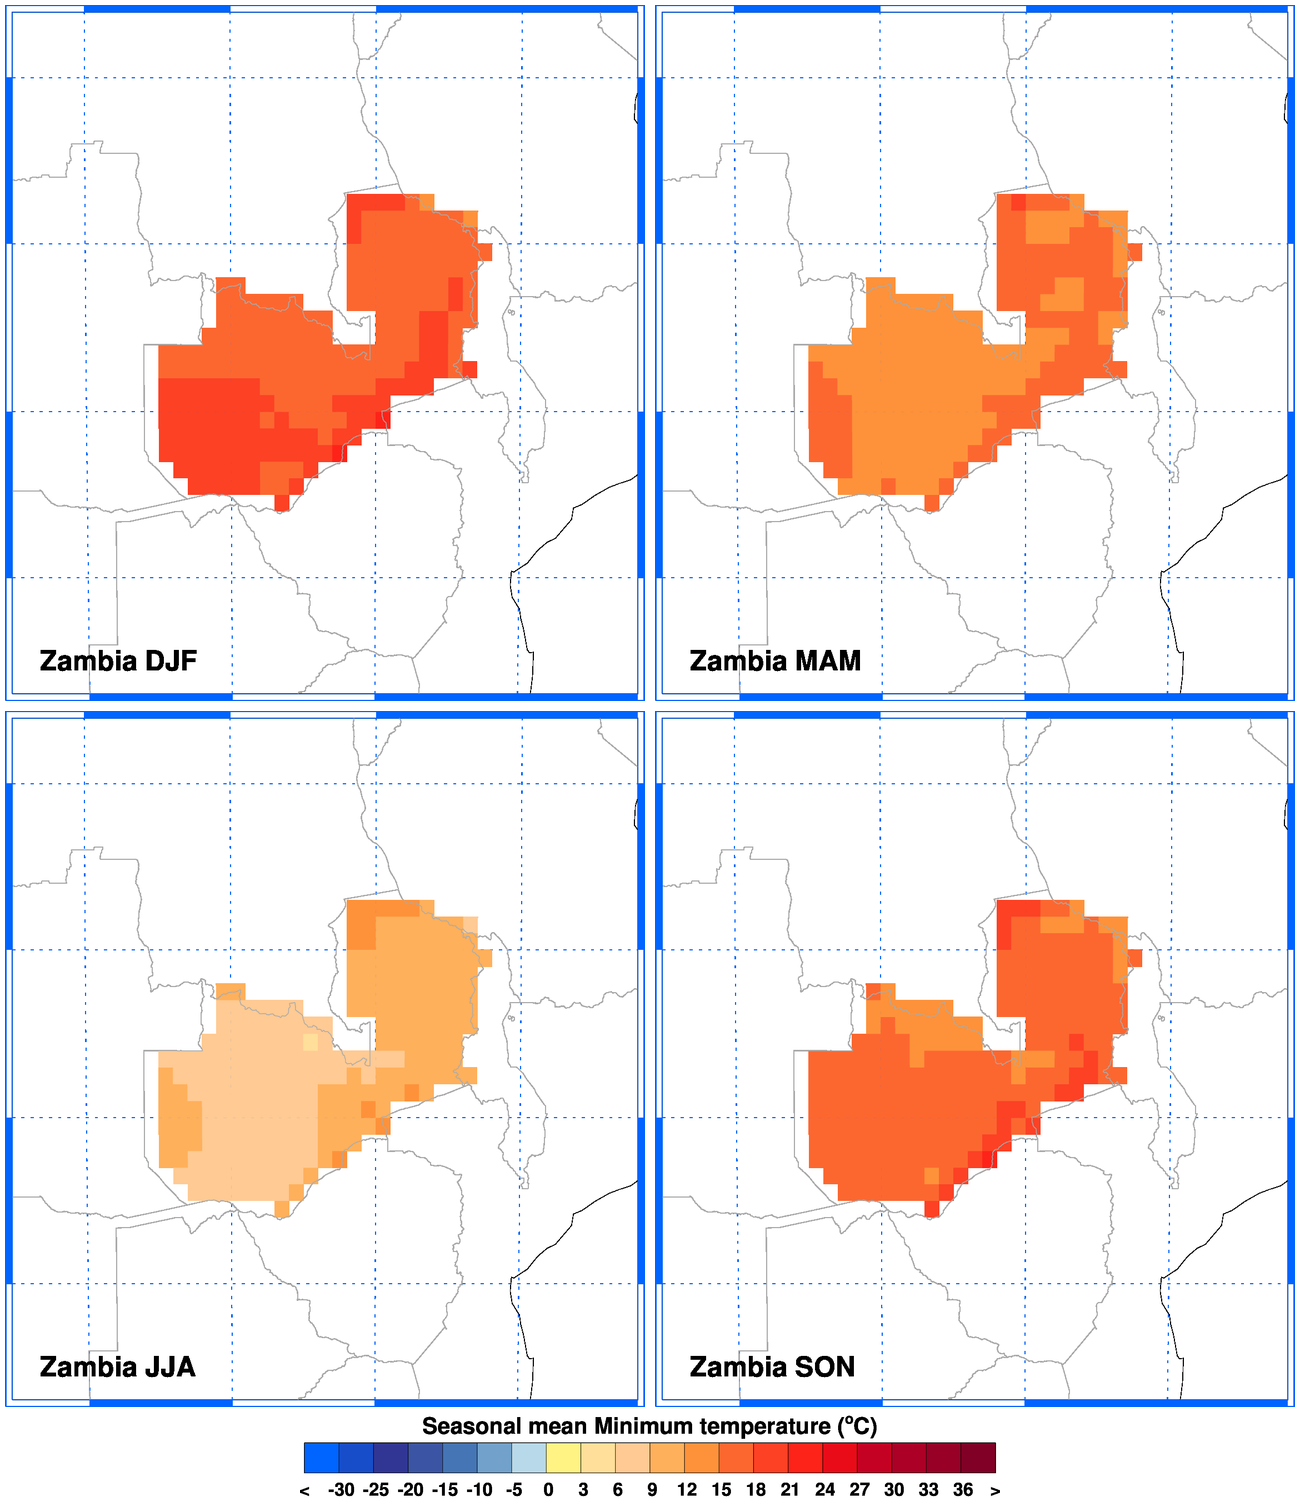
The maps on this page show the 1961-1990 average annual and seasonal mininum temperature across this country or region from the CRU TS observations (New et al., 1999). For the seasons, DJF = December to February, MAM = March to May, JJA = June to August, and SON = September to November averages.
The gridded data, including timeseries of monthly values for each 0.5° grid cell, and the underlying station data, are available in scientific formats from here and via a convenient Google Earth interface here.
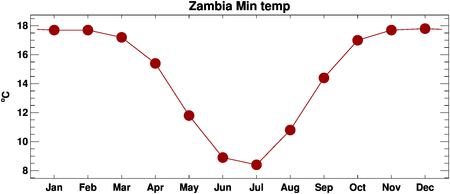
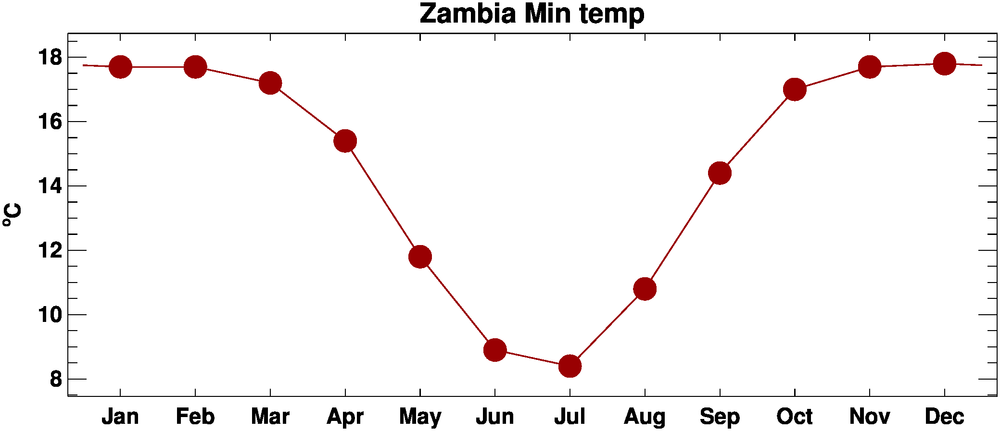
National average 1961-1990 mininum temperature normals for each month of the year are shown in the table and figure below. Seasonal and annual values are also given.
| 1961-1990 | Jan | Feb | Mar | Apr | May | Jun | Jul | Aug | Sep | Oct | Nov | Dec | |
|---|---|---|---|---|---|---|---|---|---|---|---|---|---|
| Min temp | 17.7 | 17.7 | 17.2 | 15.4 | 11.8 | 8.9 | 8.4 | 10.8 | 14.4 | 17.0 | 17.7 | 17.8 | °C |
| 1961-1990 | MAM | JJA | SON | DJF | Annual | |
|---|---|---|---|---|---|---|
| Min temp | 14.8 | 9.4 | 16.4 | 17.7 | 14.6 | °C |
Data files
National-average 1961-1990 CRU TS observed normals can be downloaded: