
How to cite: Osborn et al. (2016)
Quick links: Angola : Cameroon : Central African Rep : Chad : Congo : Ethiopia : Gabon : Kenya : Malawi : Mozambique : Nigeria : South Sudan : Tanzania : Uganda : Zambia : Zimbabwe
Quick links: Prescribed warming scenarios: Overview : Seasonal projections : Data
Climate projections - overview for specific global warming levels
Projections of national average climate change are provided for either specific levels of global warming or for time periods during a range of climate scenarios from the RCP and SRES groups. This overview page contains projections for a fixed global warming of 2 °C above the 1961-1990 baseline, and also for warmings from 1 to 4 °C. See below for a discussion about the 1961-1990 baseline compared with "pre-industrial", as well as the main caveats and limitations page. For projections under time-dependent amounts of global warming under the RCP or SRES scenarios, use the links to the left or at the bottom.
The overall purpose of these projections is to provide a quick and simple guide to the spread of results from different groups of climate models. This is a common way to assess uncertainty in climate projections, though you should read about this climate data to understand the purpose of these projections and their limitations.
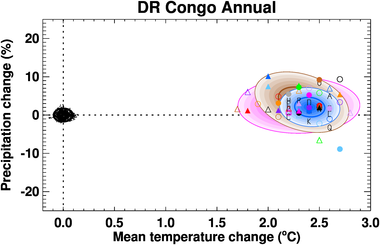
The upper image on the right shows projected changes in national average temperature (x-axis) and precipitation (y-axis) for a fixed amount of global warming (here 2°C). All changes are from the mean of the 1961-1990 reference period (so the global mean is about 2.4°C warmer than the "pre-industrial" conditions, since global warming of about 0.4°C had already taken place from the second half of the 19th century to 1961-1990).
The changes in national average temperature (x-axis) are simply the difference between the future climate (when the global temperature has warmed by 2°C) and the 1961-1990 mean. The national average precipitation (y-axis) is expressed as a percentage change from the 1961-1990 mean, so that <0% represents a decrease, 0% represents no change, and >0% represents an increase in precipitation.
Changes are given for 21 CMIP3 climate models (coloured, open symbols), 21 CMIP5 climate models (coloured, filled symbols) and 18 QUMP climate models (black letters). The spread in the projections from these three multi-model ensembles is visualized by the shaded ellipses (pink for CMIP3, brown for CMIP5 and blue for QUMP). The outer ellipse line marks the +/-2 standard deviation range of the models in each ensemble, while the innder ellipse line marks the +/-1 standard deviation range. These are not directly interpretable as probabilistic projections (see caveats and limitations of these projections for more information).
The small black dots (and associated ellipses) provide an estimate of the natural variability inherent in our climate, with each one representing a 30-year average of national average precipitation and temperature calculated from a 1000-year "control run" simulation with the CMIP3/CMIP5 HadCM3 climate model. We do not have long enough climate observation records to estimate this variability for the real world, so this is only an indicative, model-based estimate of this variability. Further, the variability of individual years is of course much greater than the variability of 30-year "climate averages" shown here; similarly, the variability for smaller-scale locations with a country can be considerably greater than the variability of the national averages shown here, especially for countries that cover a large area.
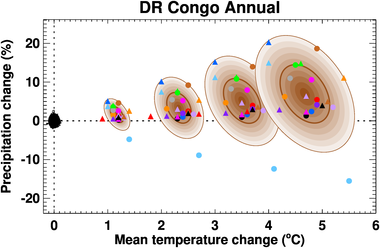
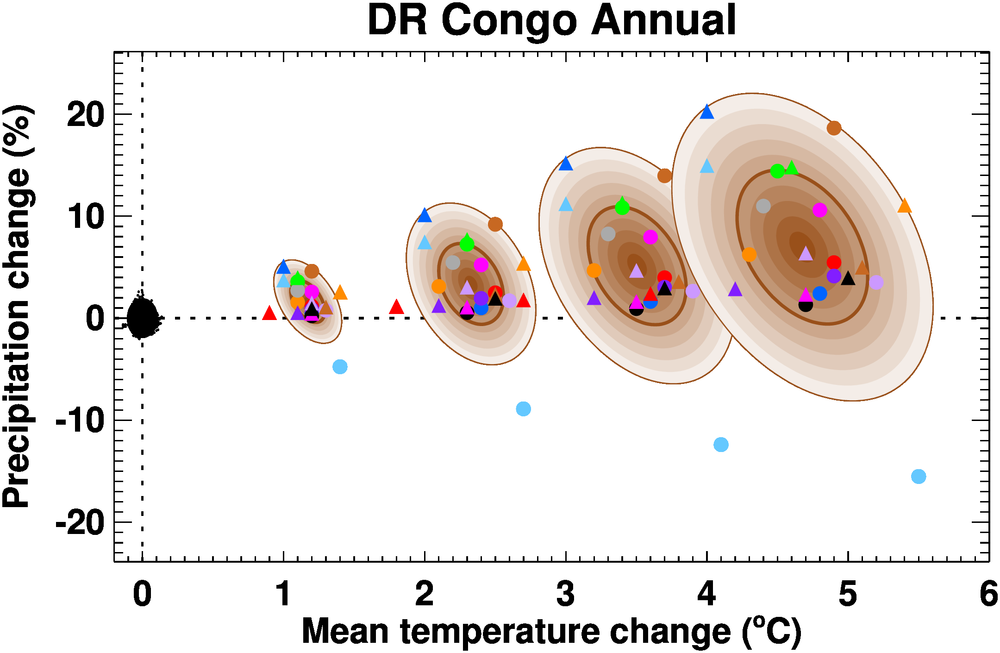
The lower image on the right compares similar results for global warmings of 1, 2, 3 and 4 °C, though only for the 21 CMIP5 climate models.
Seasonal results and data files for these and other variables
To view graphics for standard seasons or to download climate projection data for temperature, precipitation and the other available variables, click these links (this page is the overview page showing annual temperature and precipitation changes).
- Prescribed warming scenarios: Overview : Seasonal projections : Data
Time-dependent climate scenarios
Climate projections for time-dependent climate scenarios are also available: