On this webpage:
Professor H.H. Lamb subjectively classified each day's weather over the British Isles from 1861 to February 1997. All the years have been published, except for 1996/7, in Lamb (1972) and Hulme and Barrow (1997). All LWTs for the British Isles are available on this webpage.
An objective scheme to classify the daily circulation according to the Lamb weather typing scheme was developed by Jenkinson and Collison (1977). The objective scheme uses daily grid-point mean sea level pressure (MSLP) data. The objective and the original subjective Lamb scheme were compared for the British Isles by Jones et al. (1993). New series were later produced using reanalysis data (Jones et al., 2013) and these are updated by CRU in near-real-time and are available on this webpage.
Both the Lamb and the Jenkinson Weather Types use the following coding scheme for each day.
| Lamb / Jenkinson Weather Types - Number coding |
|---|
-1 U -9 non-existent day 0 A 20 C 1 ANE 11 NE 21 CNE 2 AE 12 E 22 CE 3 ASE 13 SE 23 CSE 4 AS 14 S 24 CS 5 ASW 15 SW 25 CSW 6 AW 16 W 26 CW 7 ANW 17 NW 27 CNW 8 AN 18 N 28 CN |
| File format |
|---|
 format(a) descriptive header line
 for year = firstyear to lastyear (groups of 12 rows)
   for month = 1 to 12 (rows)
     format(31i3) each day of month in columns
 (see earlier table for meaning of each number code)
|
| Dataset: Original Lamb Weather Types (1861-1997) | ||
|---|---|---|
| Filename | Description | |
| lwtlamb.dat | Lamb Weather Types - Lamb 1861-1997 | |
An objective scheme to classify the daily circulation according to the Lamb weather typing scheme was developed by Jenkinson and Collison (1977). The objective scheme uses daily grid-point mean sea level pressure data (see map below). The objective and the original subjective Lamb scheme were compared by Jones et al. (1993). A new series has now been producuced using reanalyses data (Jones et al., 2013). For the period from 1871-1947 the 20CR developed by Compo et al. (2011) is used and for 1948 to present the National Centers for Environmental Prediction (NCEP) Reanalysis by Kalnay et al. (1996) is used.
In developing a new and more consistent series,
we have chosen to base the analysis data on the synoptic hour 12, as
this is in the centre of the civil day to which the LWTs refer. The
series from 1871 to the present day is given here.

Location of the grid points centred over the British Isles
| File format |
|---|
Description of columns: day month year PM-1000 W S F Z G Dir LWT Definitions: PM_1000 average pressure over the grid points W westerly flow S southerly flow F resultant flow Z total shear vorticity >G gale day Dir direction of flow LWT see above table |
| Main dataset: LWTs centred on the British Isles (1871-present) | |
|---|---|
| Filename | Description |
| 20CR_1871-1947_ncep_1948-2026_12hrs_UK.dat | 1871-1947 20CR; 1948-present NCEP; text format |
| 20CR_1871-1947_ncep_1948-2026_12hrs_UK.csv | as above in csv format (contains headers) |
| Subsidiary datasets (to allow comparison between reanalyses) | |
|---|---|
| Filename | Description |
| 20CR_1948-2010_12hrs_UK.dat | 1948-2010 (20CR to facilitate comparison) |
| ERA5_1979-2018_12hrs_UK.dat | 1979-2018 ERA5 |
| Subsidiary datasets (results for other synoptic hours) | |
|---|---|
| These files do not contain the final column field (LWT) | |
| Filename | Description |
| ncep_1948_2026_00hrs_UK.dat | 1948-present NCEP 00hrs |
| ncep_1948_2026_06hrs_UK.dat | 1948-present NCEP 06hrs |
| ncep_1948_2026_18hrs_UK.dat | 1948-present NCEP 18hrs |
| 20CR_1871-2010_00hrs_UK.dat | 1871-2010 20CR 00hrs |
| 20CR_1871-2010_06hrs_UK.dat | 1871-2010 20CR 06hrs |
| 20CR_1871-2010_18hrs_UK.dat | 1871-2010 20CR 18hrs |
Jenkinson and Collison (1977) defined a gale index, G, calculated from the following formula:
G = [F2 + (0.5Z)2]1/2where F is the resultant flow and Z is the total shear vorticity (see Jones et al., 1993, for further details).
The daily gale index G values are included in the LWT files provided in the previous section above.
In addition, data and timeseries figures are provided here indicating the days that exceed a specified gale intensity (in a similar vein to that used by Hulme and Jones, 1991):
G > 30 gale
G > 40 severe gale
G > 50 very severe gale
This was done annually and for an extended winter (NDJFMA)
| Gale index and visualisations: British Isles (1871-present) | |
|---|---|
| Filename | Description |
| gale_index_1200hrs_UK.csv | dated log of all G>30 days |
| ANN_G_thresh_counts_UK.pdf | Plot of annual (calendar year) counts of gale days, severe gale days and very severe gale days (note: final value may be lower if the current year is incomplete) |
| NDJFMA_G_thresh_counts_UK.pdf | Plot of extended winter (November to April) counts of gale days, severe gale days and very severe gale days (note: final value may be lower if the current season is incomplete) |
The objective Jenkinson/Collison LWT scheme has also been applied to a grid of daily mean sea level pressure data centred over the North Sea (see map below). For all other details (including format of the files), see the earlier British Isles section.
Location of the grid points centred over the North Sea
| Main dataset: LWTs centred on the North Sea (1871-present) | |
|---|---|
| Filename | Description |
| 20CR_1871-1947_ncep_1948-2026_12hrs_N_Sea.dat | 1871-1947 20CR; 1948-present NCEP; text format |
| 20CR_1871-1947_ncep_1948-2026_12hrs_N_Sea.csv | as above in csv format (contains headers) |
| Subsidiary datasets (to allow comparison between reanalyses) | |
|---|---|
| Filename | Description |
| 20CR_1948-2010_12hrs_N_Sea.dat | 1948-2010 (20CR to facilitate comparison) |
| ERA5_1979-2018_12hrs_N_Sea.dat | 1979-2018 ERA5 |
| Subsidiary datasets (results for other synoptic hours) | |
|---|---|
| These files do not contain the final column field (LWT) | |
| Filename | Description |
| ncep_1948_2026_00hrs_N_Sea.dat | 1948-present NCEP 00hrs |
| ncep_1948_2026_06hrs_N_Sea.dat | 1948-present NCEP 06hrs |
| ncep_1948_2026_18hrs_N_Sea.dat | 1948-present NCEP 18hrs |
| 20CR_1871-2010_00hrs_N_Sea.dat | 1871-2010 20CR 00hrs |
| 20CR_1871-2010_06hrs_N_Sea.dat | 1871-2010 20CR 06hrs |
| 20CR_1871-2010_18hrs_N_Sea.dat | 1871-2010 20CR 18hrs |
See earlier British Isles section for an explanation.
| Gale index and visualisations: North Sea (1871-present) | |
|---|---|
| Filename | Description |
| gale_index_1200hrs_N_Sea.csv | dated log of all G>30 days |
| ANN_G_thresh_counts_N_Sea.pdf | Plot of annual (calendar year) counts of gale days, severe gale days and very severe gale days (note: final value may be lower if the current year is incomplete) |
| NDJFMA_G_thresh_counts_N_Sea.pdf | Plot of extended winter (November to April) counts of gale days, severe gale days and very severe gale days (note: final value may be lower if the current season is incomplete) |
Flood indices were constructed based on the method of Wilby and Quinn (2013) for Environment Agency regions in England and Wales, plus the area overseen by the Scottish Environmental Protection Agency (SEPA).
The LWTs used by Wilby and Quinn (2013) are based on an objective classification of pressure patterns obtained from the 20CR and NCEP/NCAR re-analysis described above. Like the LWTs, the regional flood indices are provided from 1871 to present, updated daily.
The flood indices are calibrated from the number of Peaks over Threshold (POT) river flows in relation to the prevailing daily Lamb Weather Types (LWTs). POT time series were derived for each river gauging station by determining how many times the river flow exceeds a threshold set for each gauge, recorded as the number of exceedances per water year (October to September).
Weather patterns such as the C-type tend to generate more frequent POTs whereas A-types are relatively flood poor. Hence, decadal variations in the frequency of these contrasting weather types can explain flood rich and flood poor periods. Since gauged flood data are rare (very few stations were operating prior to 1950), the association between recorded POTs and corresponding LWT enables consideration of flood clustering in time periods where only LWT data are available (1871 to 1950s).
The regional flood indices also help place contemporary events in a much longer context. For example, the 30 day moving average flood index in February 2014 reached a maximum weight value of 2.33 in the Southern region. At the time, this value had only been exceeded during five previous episodes in the last 144 years (1872, 1951, 1981, 1983 and 2000).
Overall, the most extreme flood index for the Southern region was 2.58 in November 2000. As with 2014, this high value was due to very persistent cyclonic weather lasting several weeks.
The map below shows the regions (by colour) and river gauging stations used to calibrate the flood indices. Stations were selected because they had at least 50 years of flood peak data.
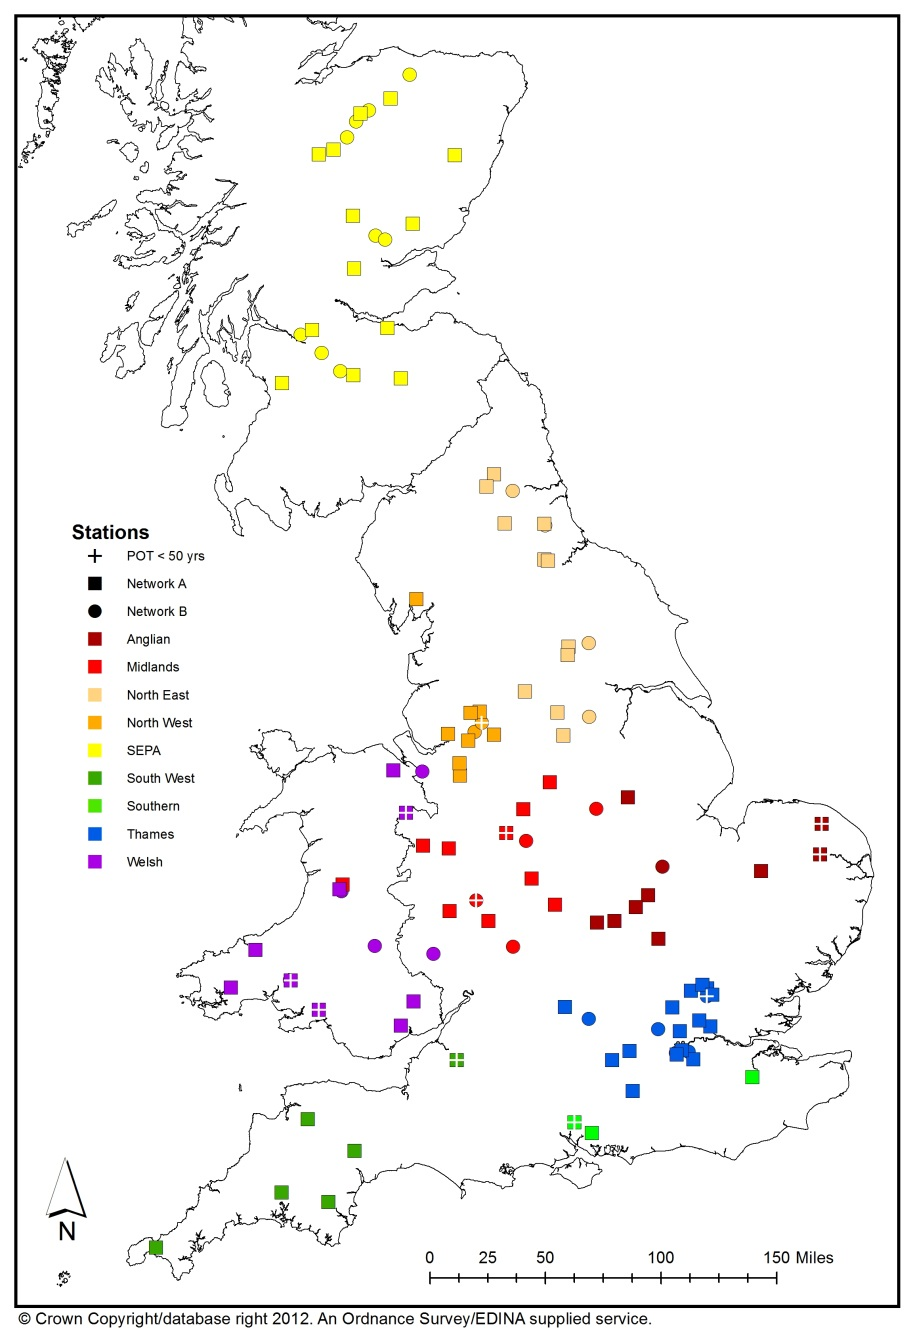
Location of UK river gauging stations
A flood index for the Island of Ireland (IoI) was subsequently produced by Harrigan (2016) following the approach of Wilby and Quinn (2013).
Similar to Britain, the C-type weather pattern generates more frequent POTs across IoI. In general, IoI flood loadings are most similar to those for Wales where the CS-type is also found to be associated with a greater likelihood of high flows.
The IoI flood index was calibrated over water years 1978-2009 using POTs based on Daily Mean Flows (DMFs) from the 29 stations shown in the map below.
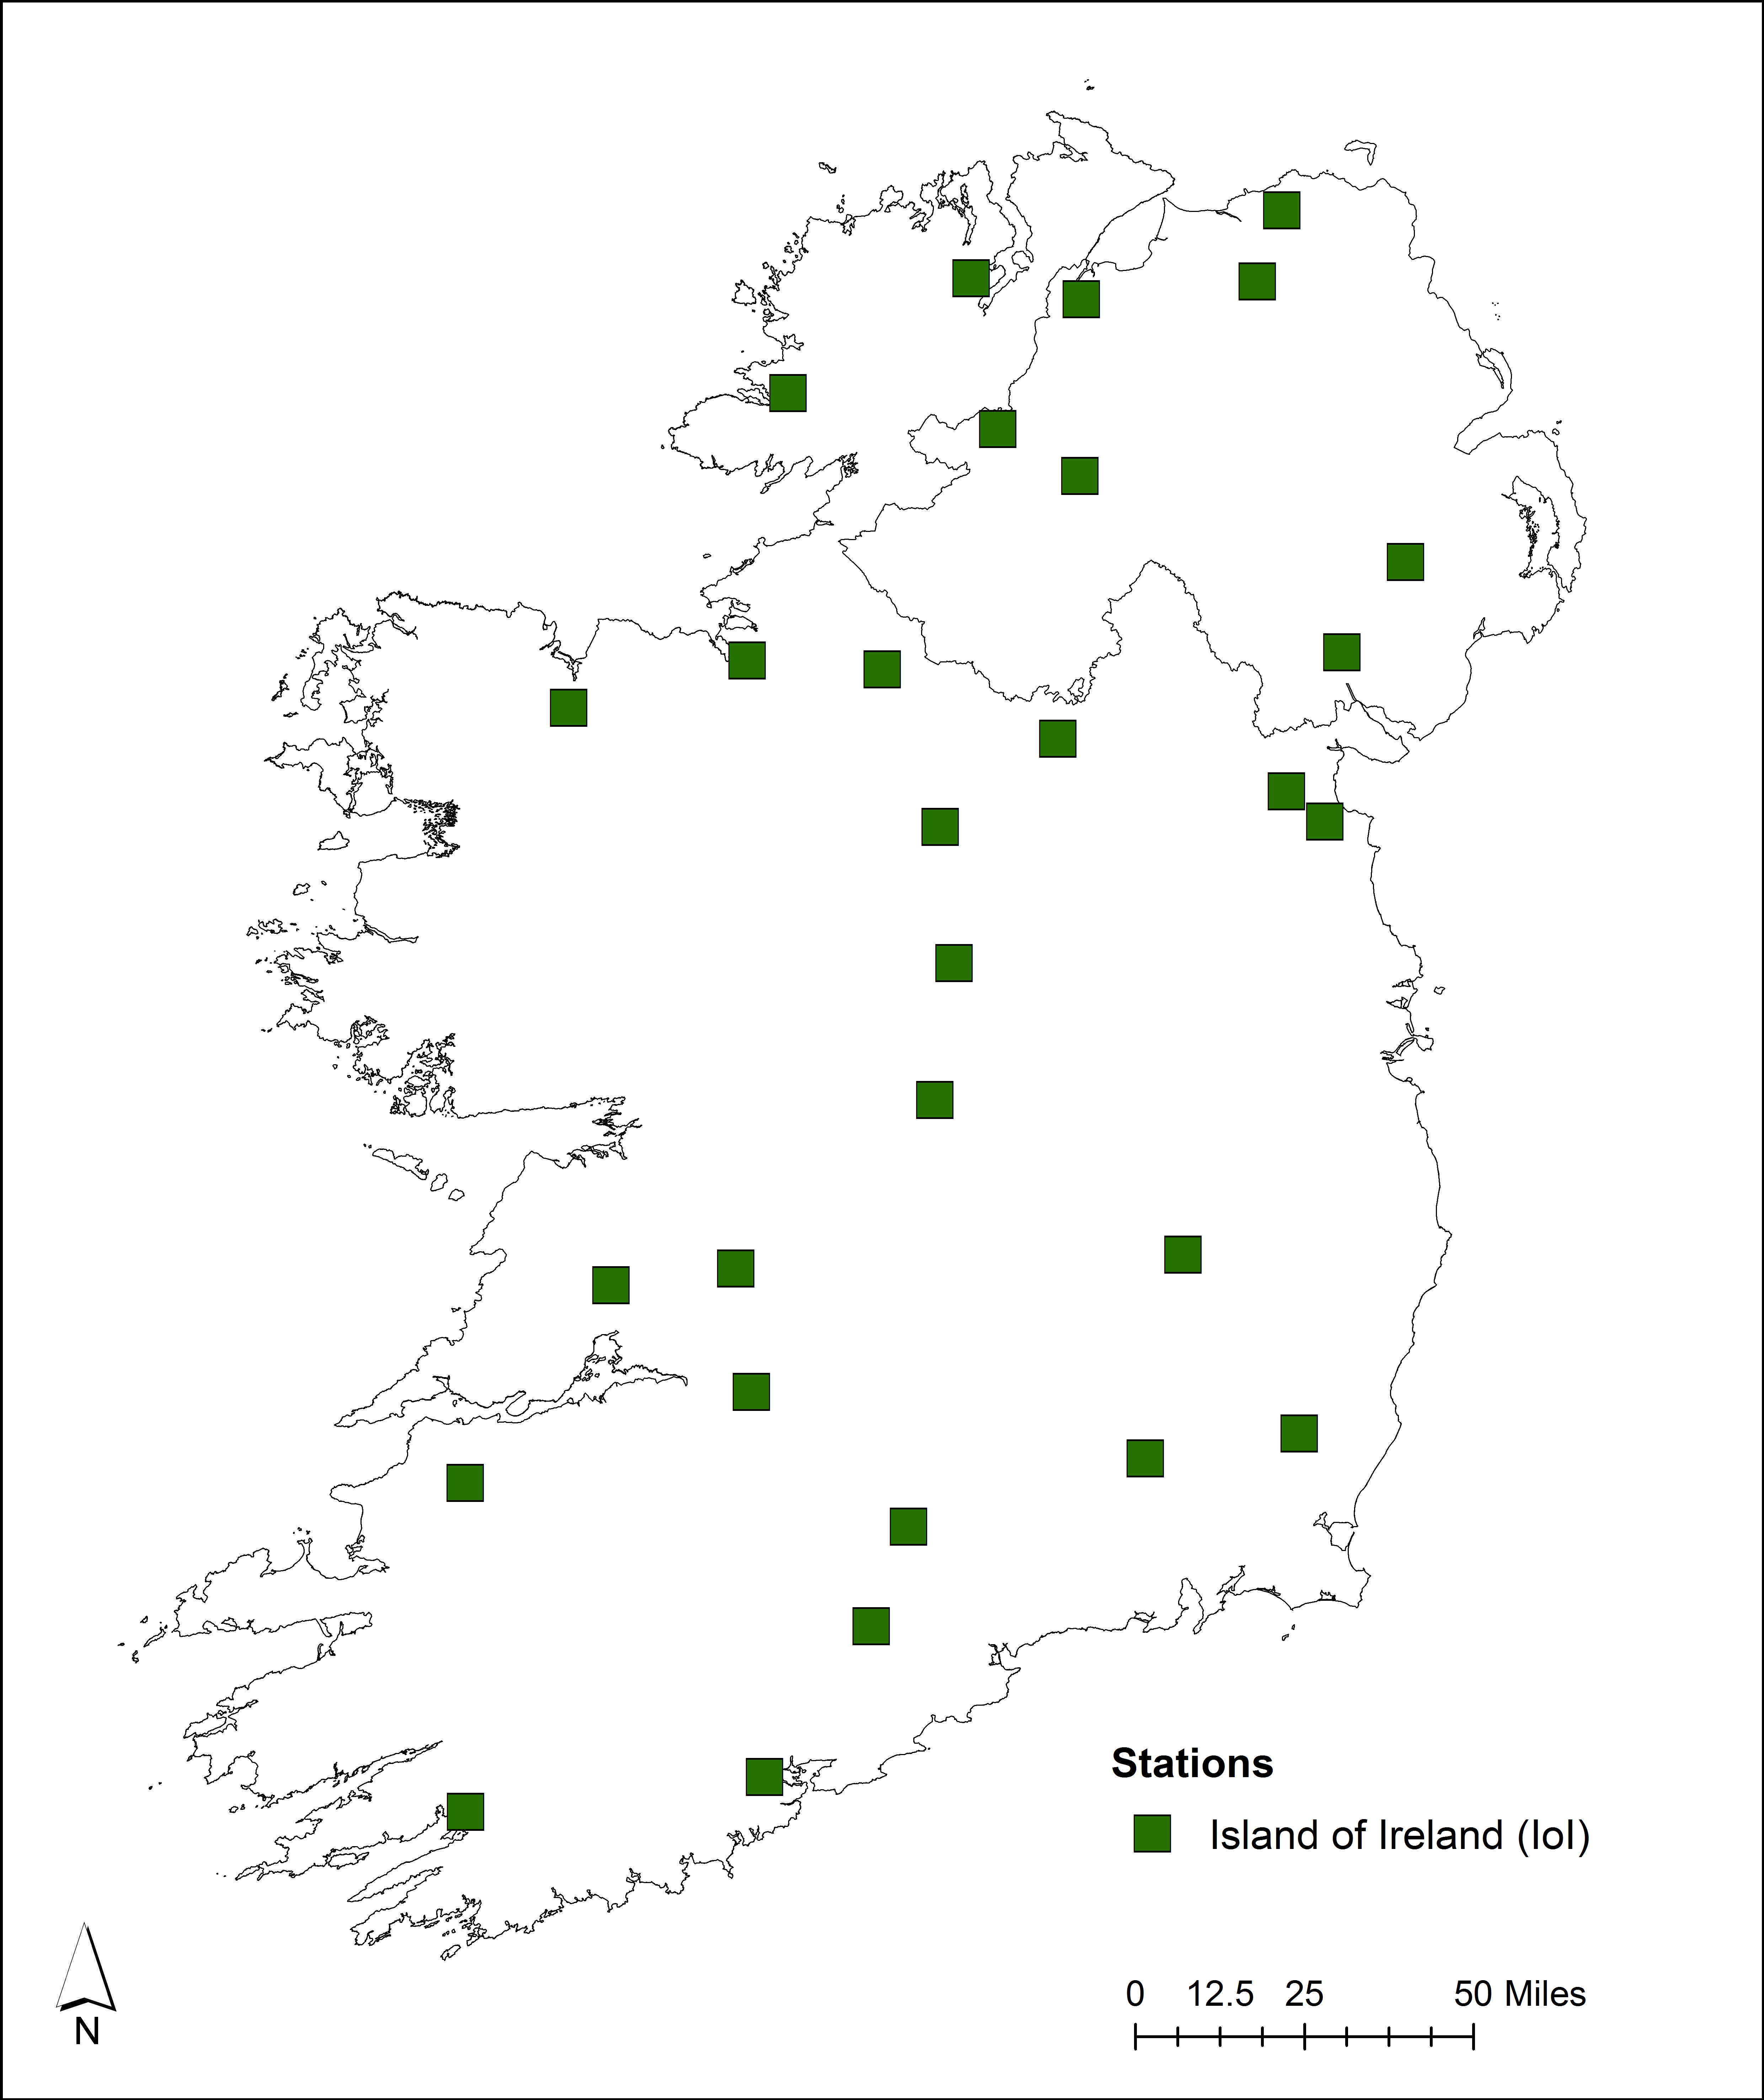
Location of Island of Ireland river gauging stations
| Fluvial flood indices for British regions and the Island of Ireland (1871-present) | |
|---|---|
| Filename | Description |
| mov_averages.pdf | Visualisation of flood indices (30-day moving averages for last 3 years, 90-day moving averages for last 10 years, 365-day moving averages for last 30 years) |
| day_weights.csv | Complete daily time series from which moving averages are calculated |
| move_av_30dy.csv | Complete 30-day moving average time series |
| move_av_90dy.csv | Complete 90-day moving average time series |
| move_av_365dy.csv | Complete 365-day moving average time series |
These datasets are made available under the Open Database License. Any rights in individual contents of the datasets are licensed under the Database Contents License under the conditions of Attribution and Share-Alike.
Updated: near real time