Climatic Research Unit : Staff : Keith Briffa : Yamal 2009
Exploring potential biases in the Yamal RCS Chronology: sensitivity to the inclusion of modern data from specific sites
Overview
Here we test the robustness of published versions of the Yamal RCS chronology
(Briffa, 2000; Briffa et al. 2008) shown in Figure A.
We explore the sensitivity of the character of the Yamal chronology
to the specific inclusion of measurements taken from living trees at
each of 4 sites and compare the individual chronologies, each based
on sub-fossil data combined with the modern data from each site, with
the chronology created using the combined data from all sites.
Chronologies are created using the RCS standardisation method
incorporating the 'signal-free' technique described in
Briffa and Melvin (2008), Melvin and Briffa (2008).
|
Figure A
This Figure shows the earlier versions of the Yamal RCS chronology as
published in Briffa (2000) and Briffa et al. (2008). The chronologies have been scaled so that
the individual yearly values have the same mean and standard deviation as the new
Yamal_All chronology discussed later (see Data section for definitions) over the period AD 1
to 1600. The upper panel shows the chronologies over the period AD 1 to 1996, smoothed
using a 40-year low-pass cubic smoothing spline (for details of the implementation of the
smoothing spline see Cook and Peters, 1981). The lower panel shows yearly index values
over the period 1801 to 1996. Sample counts are shown with grey shading.
|
Background
General texts describing the basis of dendroclimatic methods include Fritts
(1976) and Cook (1990). Here we summarise some relevant points.
Trees grow better in some years than in others and series of ring-width
measurements from different trees at a site or across a region can
show similar patterns of good and bad growth through time. The
existence of this common pattern or 'signal' in series of
tree-ring measurements, especially as shown in high-pass filtered
data, allows the measurement series to be crossdated against each
other and, provided the trees can be matched to living samples with
known dates for their outer rings, the exact calendar date of each
ring can be established.
Once they have been dated, ring-width data can be incorporated into a
'chronology': a time series composed of the average of many
tree-ring data series. Even under the same climate conditions the
growth of individual trees will vary because of different localised
site conditions (e.g. soil type, aspect, competition) or other small
scale factors varying within a site. The rationale for building a
tree-ring chronology is to produce a robust representation of
whatever underlying influence(s) is (are) expressed in the common
growth pattern exhibited by a representative sample of different
trees within a site or across a wider region. Averaging the records
from different trees greatly reduces the variability that is not
shared in common by many trees and brings out the underlying pattern
of common growth changes.
The need to 'Standardise' raw measurement data to remove tree-age effects
The widths of tree rings can also vary substantially over time, according
to tree age and the changing radial geometry of the tree.
Radial-increment measurements generally display a characteristic
pattern of rapid growth followed by a more gradual decline as the
tree gets older.
If raw ring-width measurements from different trees are simply averaged
together, especially when the trees germinated at roughly the same
time, the chronology values would show a declining trend, expressing
the narrowing of ring widths as the trees get progressively older.
Standardisation methods have been developed to allow the estimation
and removal of the age-related trends in tree growth measurement
series, to allow the underlying tree-growth signal to be more clearly
expressed. Standardisation can be accomplished by filtering the
measurements with a high-pass filter (e.g. using data-adaptive or
curve-fitting methods) but the inevitable consequence is that
long-timescale variance in the chronology is removed.
Regional Curve Standardisation
Regional Curve Standardisation (RCS) is a simple approach to removing
tree-age-related bias in chronologies. This converts measurement
series into fractional deviations from a single statistical model of
expected ring width as a function of tree age. Unlike the 'high-pass
filter' approach, which restricts the timescale of variability in
standardised series to periods shorter than the length of the
tree-ring records, the RCS approach can preserve potential
long-timescale variance with respect to the overall chronology mean
(Cook et al. 1995, Briffa et al. 1996).
Where the focus of study is on long-term changes we believe the RCS
approach remains the most promising technique, as shown by comparison
with various other widely applied alternatives that demonstrably fail
to preserve evidence of long-term climate trends. The methods and
protocols for processing and interpreting RCS chronologies
are, however, still evolving.
We have previously described how the application of this method may
provide a biased indication of regional-average tree-growth changes
over multi-decadal and longer timescales if the measurement data are
inhomogeneous, in the sense that they are taken from trees that would
have grown at different rates under the same climate conditions.
A single statistically-derived model of expected ring-width as a
function of ring age may not always be an appropriate reference from
which to calculate tree-growth indices for all samples and in such
cases and the degree of expressed bias at any point of the chronology
will depend on how specific sample biases, arising because of
inhomogeneous sample data, cancel each other through time.
We are exploring ways of identifying such biases and of modifying the
simple RCS approach to mitigate their effects. Further details and
more extensive discussion of these issues may be found in a recent
review of the status of the RCS technique
(Briffa and Melvin 2008).
Yamal Chronology History
The selection of which sites or regions from which to sample trees is
usually made on the basis of the study objectives, e.g. to
reconstruct temperature or precipitation. The number of sites
selected is dependent on the size of the region of investigation and
crucially on the availability of samples. The assessment of how many
trees are needed to build a chronology is usually gauged according to
the numbers required to express the statistically measured common
tree-growth signal at the timescale and error levels set as
objectives in the project i.e. longer timescales and smaller error
margins require larger numbers of samples. Individual trees are
selected for sampling on the basis of what we know about the local
ecology: with the intention of maximising the potential for the ring
patterns to show evidence of the common growth pattern. For living
trees a representative sample is taken from what is usually a larger
population of potential trees while for sub-fossil trees all samples
that have sufficient rings to enable crossdating are often employed.
When forming a chronology, the variance over time depends on the
sample count. To avoid problems with changing variance related to
differences in data replication the count of trees at the modern end
of a chronology may be deliberately limited (to be consistent with
the number of sub-fossil samples averaged through time) or,
alternatively, statistically-based variance adjustments can be made
(Osborn et al. 1997).
Over two decades our Russian colleagues collected hundreds of dead
(sub-fossil) trees from sites adjacent to several river systems in the
Yamal region (Hantemirov and Shiyatov 2002, Figure 1) and
painstakingly crossdated many of these measurement series, to place
them in exact calendrical alignment. This generated a data set of
ring-widths spanning several millennia. Hantemirov and Shiyatov's
intention was to use the 'corridor standardisation' (Cook et al.
1990), which can only preserve variance representing periods up to
about a third of the length of a tree, and so forms a chronology
which predominantly expresses the high-frequency signal of tree
growth.
For the "corridor-standardised" chronology produced by Hantemirov and Shiyatov,
a sample replication of about 10 trees in each year is generally
sufficient.
To form the modern end of their chronology they
also selected data from 17 trees spread over 5 sites in
the region in which their sub-fossil trees were collected
(see Figure B).
|
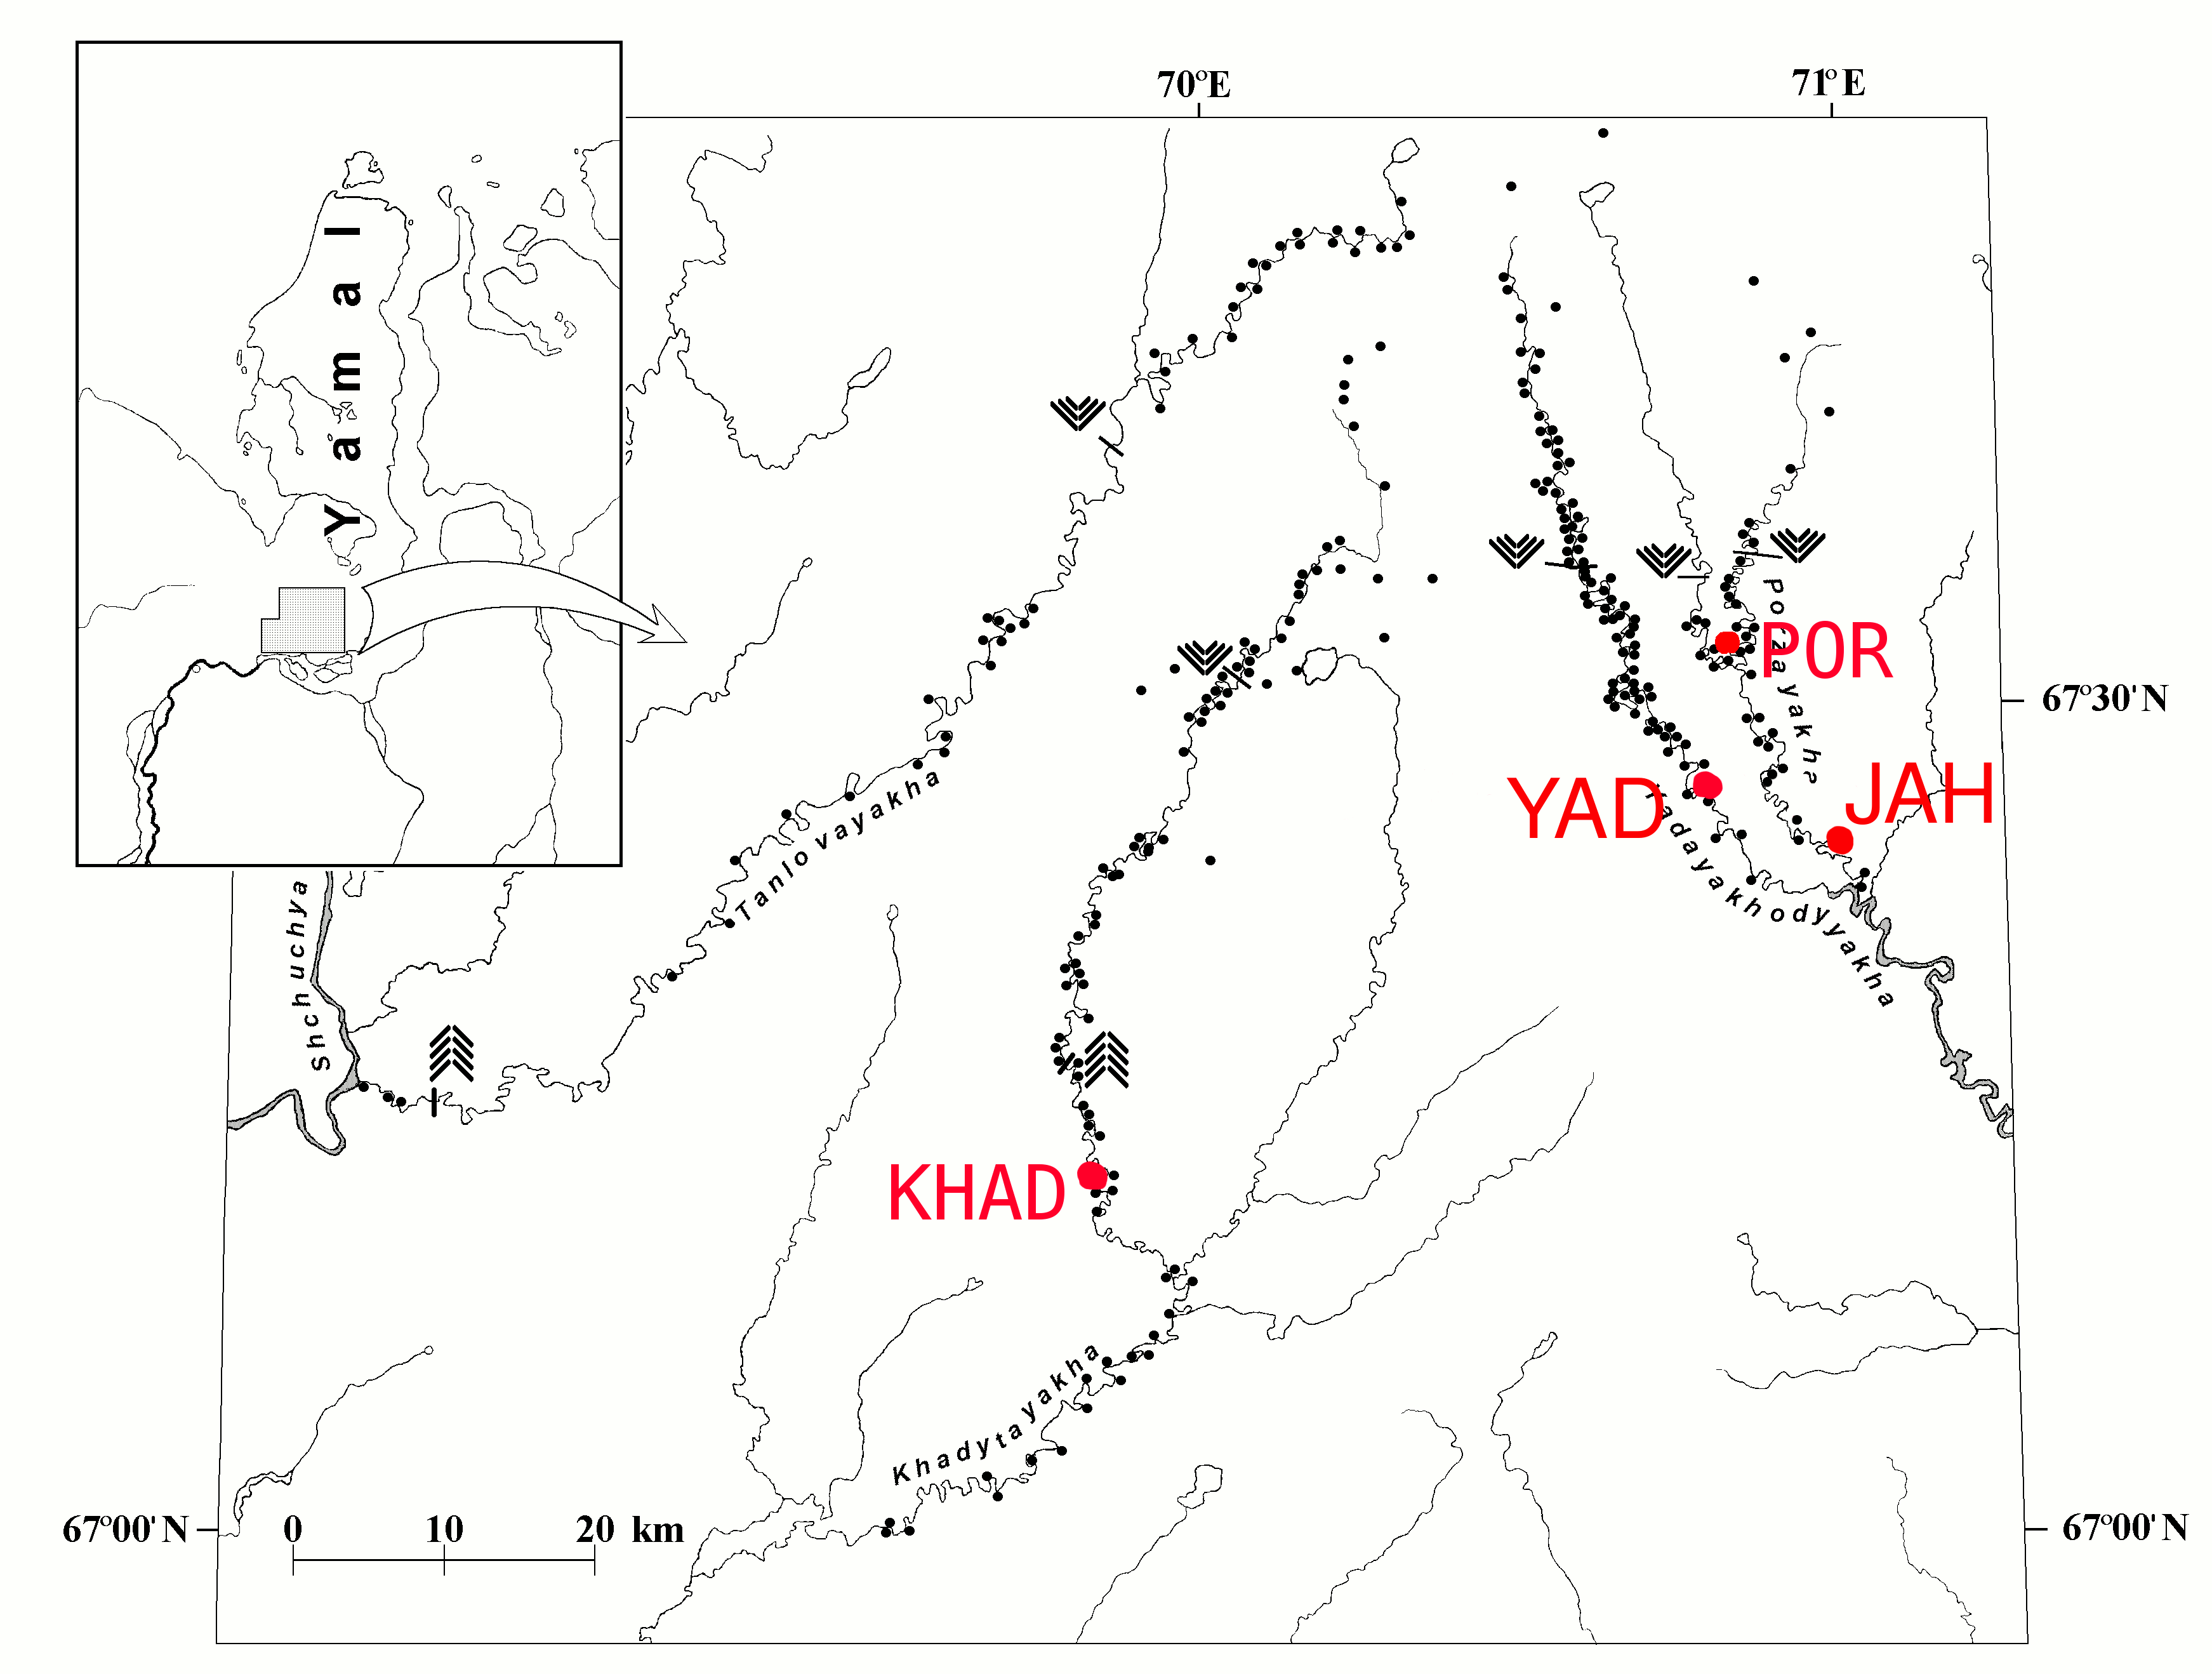
Figure B
This map (after Hantemirov and Shiyatov, 2002, Figure 1) shows the area of the southern
Yamal peninsula from which the tree-ring data were collected. Sub-fossil locations are shown
as black dots (note that only those with rings dating to the Christian era were used in the
analyses discussed here). Red dots mark the locations of the living-tree collections discussed
in the text. The larch tree line is indicated by the downward pointing arrows and the spruce
tree line by the upward pointing arrows.
|
To retain representation over the wider area they selected a few trees
from each site. With the intention of preserving some decadal and
longer time scale information in their data, they selected from the
longest series at each site as well as considering only trees which
showed high levels of the common growth forcing signal. Their near
4,000-year chronology was published in Hantemirov and Shiyatov
(2002), and the AD portion of this data set was used in Briffa (2000)
and Briffa et al. (2008) without further modification or
selection.
Data
The file Yamal_AD consists of measurements from 235 sub-fossil samples
collected at numerous sites adjacent to the Porzayakha, Yadayakhodyyakha,
Tanlovayakha and Khadytayakha rivers (Hantemirov and Shiyatov
2002, Figure 1) and samples from 17 living trees growing at 5 sites
in the vicinity of the sub-fossil trees.
In a second file we removed the 12 series (the same
12 series as removed by McIntyre) which came from the JAH, POR and
YAD sites, to leave data from 240 trees called Yamal_SF. (See Tables
1 and 2 listing all sites used). We also produced four files
containing the 'living-tree' data for each of the JAH, POR and
YAD sites (measurements supplied by Rashit Hantimirov, personal
communication) and a separate mean-tree file (data for 34 cores
averaged to form mean series for 18 trees) named KHAD (Khadytla,
Schweingruber and Briffa 1996). For the sensitivity tests we appended
the cores of each of the four individual sites to those of the
Yamal_SF forming four separate data sets (Yamal_YAD, Yamal_POR,
Yamal_JAH and Yamal_KHAD). We also appended all series from the 4
living-tree sites to the Yamal_SF trees to form a Yamal_All
chronology.
The original 17 living-tree samples selected by Hantemirov and Shiyatov are in file LIVE.
| Data Set | Site Name | Alt | North | East | Start | End | Species |
|---|
| Yamal_AD | Yamal | -999 | 6700 | 7000 | -202 | 1996 | LASI |
| KHAD | Khadytayakha | 90 | 6712 | 6950 | 1782 | 1990 | LASI |
| POR | Porzayakha | | 6732 | 7050 | 1580 | 1994 | LASI |
| JAH | Jahak | 25 | 6725 | 7028 | 1577 | 1991 | LASI |
| YAD | Yadayakhodyyakha | | 6725 | 7048 | 1803 | 1996 | LASI |
Table 1 –
Some details of the regional and local chronologies explored in this analysis:
altitude (masl), coordinates (degrees and minutes), start and end year and species
(LASI is Larix siberica).
The Yamal_AD file contains the measurement data used in Briffa (2000)
and Briffa et al. (2008).
|
| Derived data set | Derivation details |
|---|
| Yamal_SF | Sub-fossil and 5 living trees from two sites |
| Yamal_All | Yamal_SF + KHAD + JAH + POR + YAD |
| Yamal_KHAD | Yamal_SF + KHAD |
| YamalAD_KHAD | Yamal_AD + KHAD |
| Yamal_POR | Yamal_SF + POR |
| Yamal_JAH | Yamal_SF + JAH |
| Yamal_YAD | Yamal_SF + YAD |
| LIVE | The 17 living trees of the Yamal_AD |
Table 2 –
Details of the specific composition of data files used to create the
chronologies discussed in this analysis.
|
Series of Figures were generated showing the distribution
of trees over time within each site. For each site, series of reports listing
some statistics for the individual trees (or cores) are provided.
Crossdating of the samples
was performed using a cross-dating program, employing the same default options
as used in COFECHA (Holmes 1986), to generate reports showing the levels of
high-frequency common signal within the sites and between sites. Measurement
data and chronology indices are available on the data page.
The Yamal data set used (Briffa 2008) differs from that used in Briffa (2000)
and those used here because the last ring of the last tree was inadvertently
omitted during the creation of the Yamal_AD data set in 2008. This ring is
included in the Yamal_AD data set used here but the chronology shown here is
as published in 2008.
Application of the RCS method in this sensitivity study
A consistent implementation of RCS standardisation is used here throughout.
This involves using mean ring-width aligned by tree age to provide
empirical evidence of expected ring width as a function of tree age.
Where pith-offset estimates are available these were used to
establish relative ring age with greater accuracy (e.g. KHAD site).
The single free method (Melvin 2004, Briffa and Melvin 2008, Melvin
and Briffa 2008) was used to remove the effects of the common
chronology signal on the shape of the RCS curve. In this approach the
estimated values of the chronology indices are removed from each
measurement series by division to create series of "signal-free"
measurements. The statistically-derived mean signal-free ring-width
by age curve is then smoothed using an age-dependent spline (Melvin
et al. 2007) fitted only to the average ring widths for tree ages
represented by at least 4 trees and extrapolated linearly thereafter.
Series of tree-growth indices were created by dividing measured
ring-width values by the appropriate RCS curve values (for that ring age)
and the chronology was created as the arithmetic mean of all
tree indices. None of the chronologies created here have any form
of variance stabilisation applied to them.
Results
Figure C shows the RCS curves produced using only the data from each site in
turn and the chronology values (from 1800 onwards) produced using
these RCS curves. Differences in index values between sites are
apparent. Overall, there is good agreement in the general trends of
tree growth between sites, with growth increasing markedly at all
sites around 1900 and being maintained at a relatively high level
afterwards, except at the KHAD site where the trees show reduced
growth after 1970. The POR and YAD sites exhibit the highest levels
of relative growth after 1950 with the level of growth at the JAH
site somewhat lower but well above that at KHAD.
|
Figure C
This Figure shows the mean RCS indices plotted by site over the period 1801 to the end of
each chronology (1996 for YAD, 1994 for POR, 1991 for JAH, and 1990 for KHAD). In
each case the chronology was constructed using a RCS growth/age model based only on the
tree-ring data for that site (shown in the upper panel). The "signal-free" implementation of
RCS is employed so as to reduce bias in the RCS arising from co-incident climate signal in
any near-equal-aged trees when aligned by life cycle. The upper panel reveals the differences
in the magnitude of expected ring-width as a function of tree age at different sites. The lower
panel shows the differences in the temporal trends of chronology indices between sites. The
comparatively low growth at the KHAD site after 1970 is clear.
|
Figure D illustrates the chronology data at the same sites but standardised
using individual site RCS curves that incorporate the sub-fossil data.
Essentially the same picture of differing relative growth patterns
between sites is revealed. These data imply that the pattern of
growth changes at the KHAD site is most anomalous with respect to the
growth behaviour shown at the other three sites.
|
Figure D
This Figure is equivalent to Figure C except that at each site the RCS curve, and resulting site
indices, are calculated including the Yamal_SF data as well as the measurement data from
living trees. The dominance of the common sub-fossil measurements produces a very similar
RCS curve in each case (upper panel). The indices produced exhibit a similar picture of
recent growth trends varying between sites, as that seen in Figure C, with mean tree-ring
index trends higher for the POR and YAD sites, lowest (even negative after 1970 with respect
to the long-term mean) at KHAD, and at an intermediate level at JAH. The black line in the
lower panel represents the chronology (from 1750) produced using all of the data,
Yamal_All, standardised with a Yamal_All RCS curve.
|
On the assumption that the most conservative indication of overall tree
growth patterns in this region is provided by incorporating all of
the available data, Figures D, E and F present the reworked Yamal_All
chronology (in black) constructed using all of the currently
available data from POR, YAD, JAH and KHAD appended to the Yamal_SF data.
The series of mean-tree indices, i.e. fractional deviations from the single Yamal_All RCS curve
(based on all sub-fossil and available living-tree measurement data) are shown on the data page.
|
Figure E
This Figure provides an illustration of the Yamal_All chronology with a simple indication of chronology confidence.
This is shown (by grey shading) as plus and minus one standard deviation about the mean of 40-year low-pass smoothed
tree indices (in the upper panel) and unsmoothed tree indices from 1800 (in the lower panel).
|
In Figure F, the Yamal_All chronology is compared with the Yamal_AD chronology (data as Briffa 2000),
the Yamal_KHAD chronology, and the Yamal_AD_KHAD chronology
(the last two based on the same data as in McIntyre's alternative versions,
but for consistency processed using the same implementation of RCS used throughout this exercise).
Note that the KHAD data do not extend beyond 1990 so a direct comparison is only
valid up until this date.
|
Figure F
This Figure presents a comparison of different versions of the Yamal larch ring-width
chronology all produced using the same RCS implementation, each comprising the same
"sub-fossil" (Yamal_SF) data but using different recent measurement data collected from
living trees. The blue curve is Yamal_AD which contains the 12 trees removed by McIntyre;
the black curve (Yamal_All) uses all available data from the original POR, YAD and JAH
sites plus those from KHAD;
the green curve (equivalent to McIntyre's 'extreme' case chronology)
is the chronology based only on the KHAD site data;
and the magenta chronology includes the 12 removed trees and the KHAD trees
(equivalent to the other McIntyre version of the chronology).
The upper panels show 40-year low-pass
cubic-spline smoothed data, shown on an expanded time scale in the right hand panel but
truncated in 1990, the last year of the KHAD data. The lower panel shows the equivalent
inter-annual data after 1800. All data are scaled so that yearly data have the same mean
and standard deviation as the Yamal_All chronology over the period 1-1600.
Figure E gives an indication of Yamal_All uncertainty.
|
The data in the upper panels of Figure F are shown smoothed with a
40-year low-pass cubic-smoothing spline; applied to the whole of each
chronology in the left panel and truncated at 1990 in the right.
The annual chronology values are shown from 1800 onwards in the lower panel.
The new Yamal_All chronology presents a
picture from which it is reasonable to conclude that
"tree growth in the 20th century was unusually
high compared to that in previous centuries".
Though the 20th century level is lower
than in our published chronologies, due to the inclusion of the KHAD
data up until 1990, this conclusion better represents the balance of
evidence across the different sites than any inference made on the
basis of the chronology formed using only the more spatially limited,
and apparently atypical data from the KHAD site.
The post-1990 values in the new Yamal_All chronology are based only on data from
the POR and YAD sites, and so are likely somewhat biased by the
greater increase in recent tree growth rates observed there, but we simply do
not know whether the JAH, or even the KHAD site, trees exhibit high
growth rates in these recent years.
|
Figure G
This Figure shows the two earlier versions of the Yamal RCS larch chronology in red
(published in Briffa, 2000) and blue (Briffa et al., 2008) compared to the new version, based
on all of the currently available data (Yamal_All) for the original (POR, YAD and JAH) sites
and including the additional data from the KHAD site (in black). Tree sample counts for this
'new' chronology are shown by the grey shading. The upper panel shows the data smoothed
with a 40-year low-pass cubic smoothing spline. The lower panel shows the yearly data. All
series have been scaled so the yearly data have the same mean and standard deviation as
the Yamal_All series over the period 1-1600.
|
Figure G presents a comparison of the published versions of the Yamal
chronology with the newly created chronology (Yamal_All),
incorporating all data from all 4 living-tree sites. Remembering the
caveat regarding the possible positive post-1990 bias, the picture of
unusually high 20th century tree growth at the Yamal larch
tree-line is essentially the same in the reworked chronology as was
shown in our previously published versions.
References
Briffa, K. R. 2000. Annual climate variability in the Holocene: interpreting the
message of ancient trees. Quaternary Science Reviews 19:87-105.
Briffa, K.
R., P. D. Jones, F. H. Schweingruber, W. Karlén, and S. G. Shiyatov. 1996.
Tree-ring variables as proxy-climate indicators: Problems with low frequency
signals. Pages 9-41 in P. D. Jones, R. S. Bradley, and J. Jouzel,
editors. Climatic Variations and Forcing Mechanisms of the Last 2000 Years.
Springer-Verlag, Berlin.
Briffa, K.
R., and T. M. Melvin. 2008. A closer look at Regional Curve Standardisation of
tree-ring records: justification of the need, a warning of some pitfalls, and
suggested improvements in its application. Pages (in press) in M. K.
Hughes, H. F. Diaz, and T. W. Swetnam, editors. Dendroclimatology: Progress and
Prospects. Springer Verlag.
Briffa, K.
R., V. V. Shishov, T. M. Melvin, E. A. Vaganov, H. Grudd, R. M. Hantemirov, M.
Eronen, and M. M. Naurzbaev. 2008. Trends in recent temperature and radial tree
growth spanning 2000 years across northwest Eurasia. Philosophical Transactions
of the Royal Society B-Biological Sciences 363:2271-2284.
Cook, E. R.,
K. R. Briffa, D. M. Meko, D. A. Graybill, and G. Funkhouser. 1995. The Segment
Length Curse in Long Tree-Ring Chronology Development for Paleoclimatic
Studies. Holocene 5:229-237.
Cook, E. R.,
K. R. Briffa, S. Shiyatov, and V. Mazepa. 1990. Tree-Ring Standardisation and
Growth Trend Estimation. Pages 104-123 in E. R. Cook and L. A.
Kairiukstis, editors. Methods of Dendrochronology. Kluwer Academic Publishers.
Cook, E. R.,
and L. A. Kairiukstis. 1990. Methods of Dendrochronology. International
Institute for Applied Systems Analysis, Kluwer Academic Publishers, Dordrecht.
Cook, E. R.,
and K. Peters. 1981. The Smoothing Spline: A new approach to standardizing
forest interior tree-ring width series for dendroclimatic studies. Tree-Ring
Bulletin 41:45-53.
Devi, N., F.
Hagedorn, P. Moiseev, H. Bugmann, S. Shiyatov, V. Mazepa, and A. Rigling. 2008.
Expanding forests and changing growth forms of Siberian larch at the Polar
Urals treeline during the 20th century. Global Change Biology 14:1581-1591.
Fritts, H. C.
1976. Tree Rings and Climate. Academic Press, London.
Hantemirov,
R. M., and S. G. Shiyatov. 2002. A continuous multi-millennial ring-width
chronology in Yamal, northwestern Siberia. Holocene 12:717-726.
Holmes, R. L.
1986. COFECHA. in. Laboratory of Tree Ring Research, University of
Arizona, Tuscon.
MacDonald, G. M., K. V. Kremenetski, and D. W. Beilman. 2008.
Climate change and the northern Russian treeline zone. Philosophical
Transactions of the Royal Society B-Biological Sciences 363:2285-2299.
Melvin, T. M.
2004. Historical growth rates and changing climatic sensitivity of boreal
conifers. Thesis. University of East Anglia, Norwich.
(full text)
Melvin, T.
M., and K. R. Briffa. 2008. A "Signal-Free" approach to
Dendroclimatic Standardisation. Dendrochronologia 26:71-86.
Melvin, T.
M., K. R. Briffa, K. Nicolussi, and M. Grabner. 2007. Time-varying-response
smoothing. Dendrochronologia 25:65-69.
Osborn, T.
J., K. R. Briffa, and P. D. Jones. 1997. Adjusting variance for sample-size in
tree-ring chronologies and other regional timeseries. Dendrochronologia 15:89-99.
Schweingruber,
F. H., and K. R. Briffa. 1996. Reconstruction of summer temperatures with a
circumpolar tree ring network. Pages 105-111 in Fire in Ecosystems of
Boreal Eurasia.
Shiyatov, S. G. 2009.
Dynamics of tree and bush vegetation in the polar Ural Mountains under
the influence of recent climate changes, 216p, Ekaterinburg.
Text and diagrams copyright Climatic Research Unit, University of East Anglia