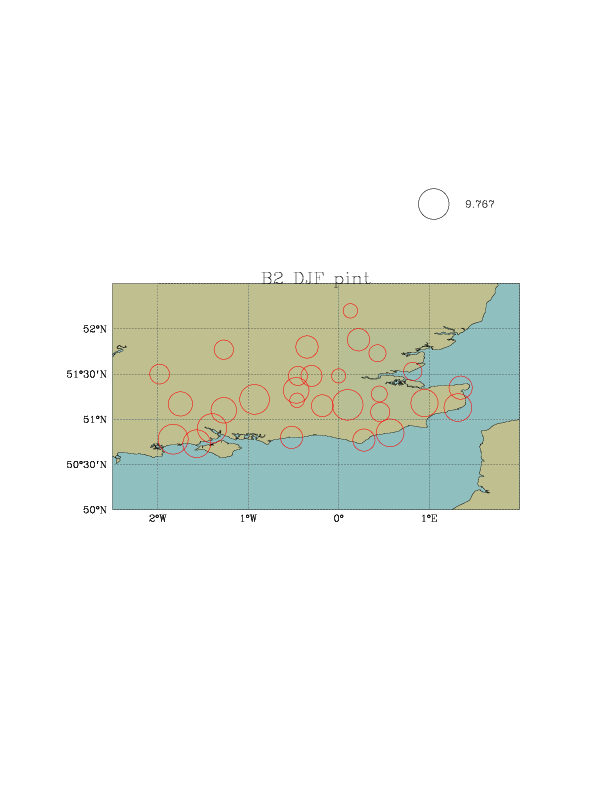
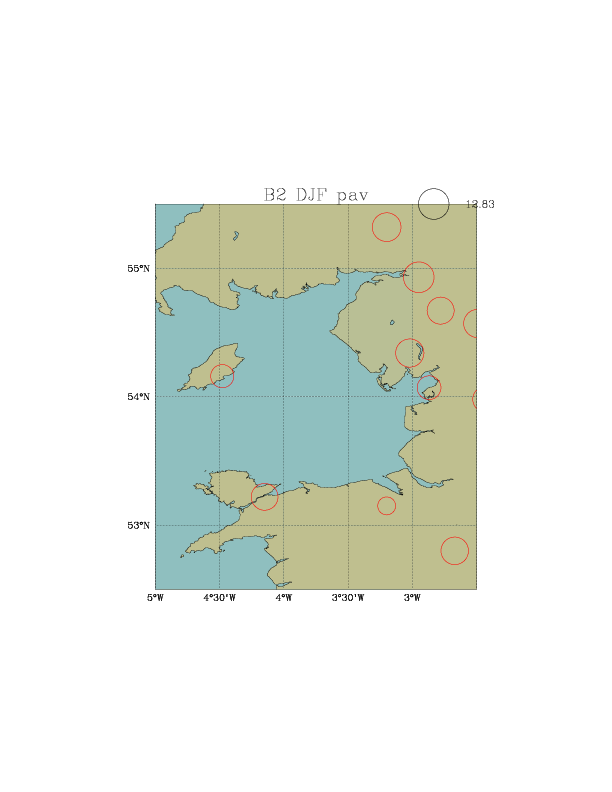
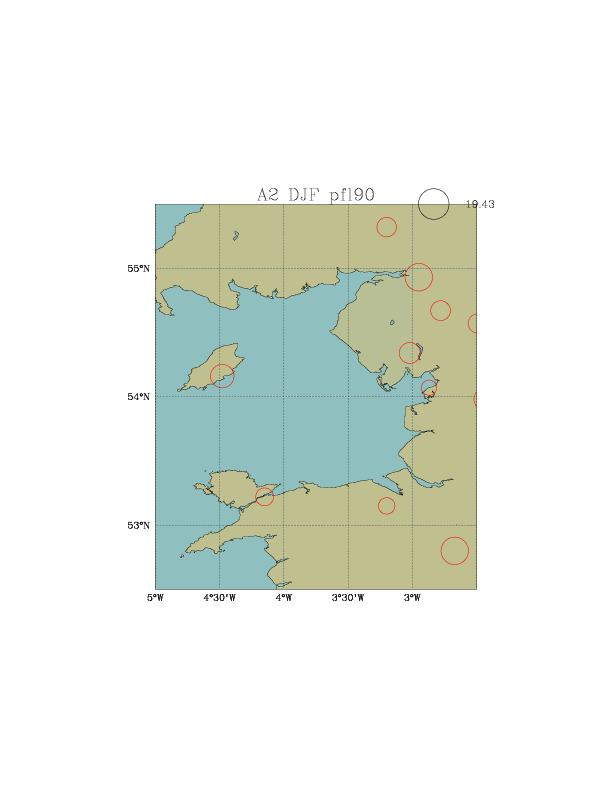
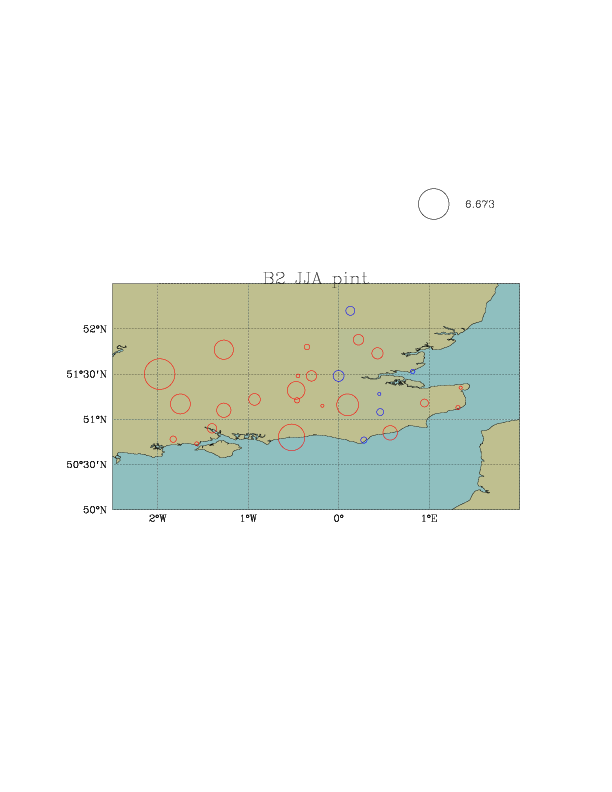
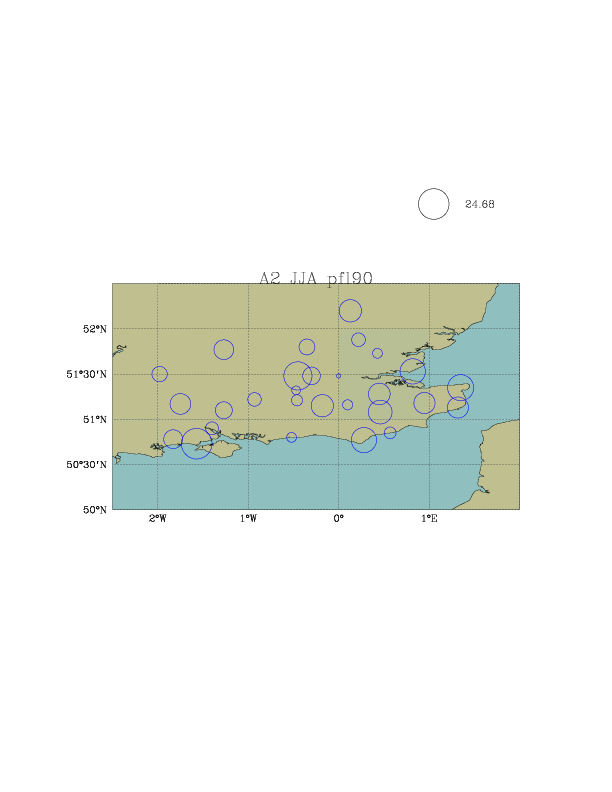
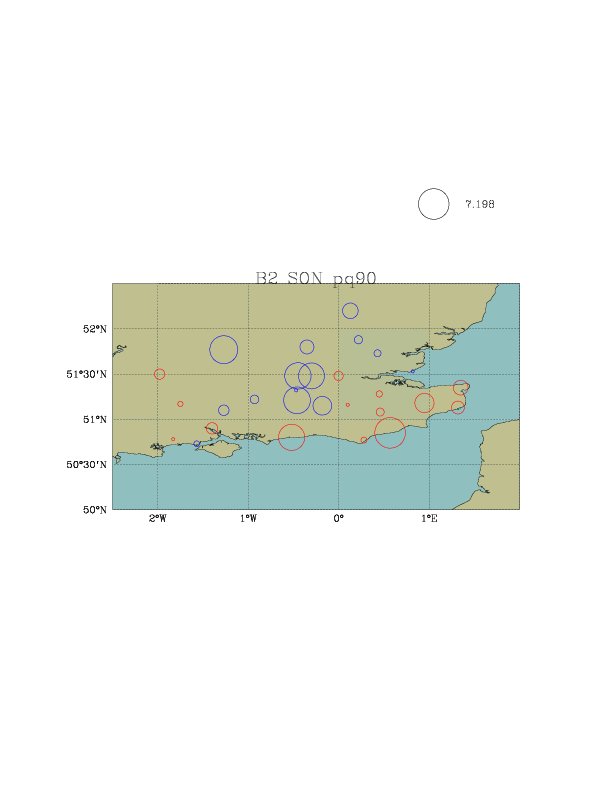
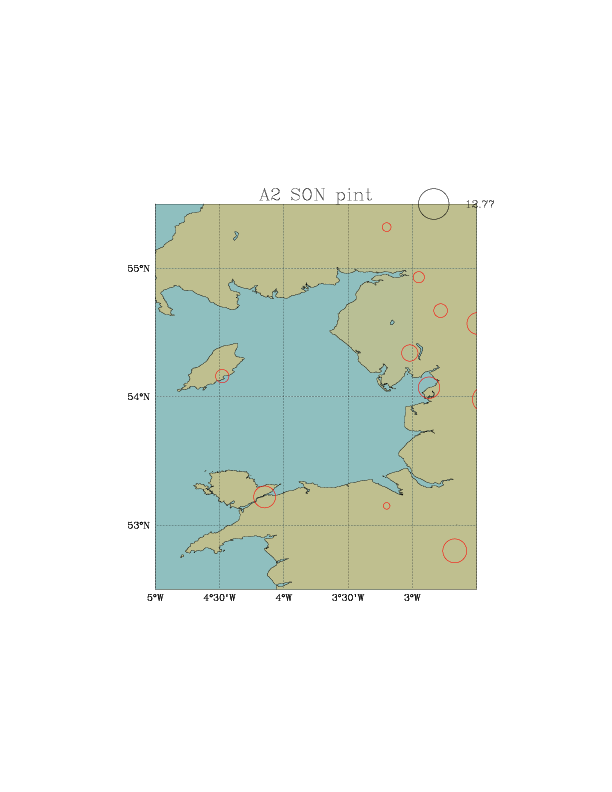
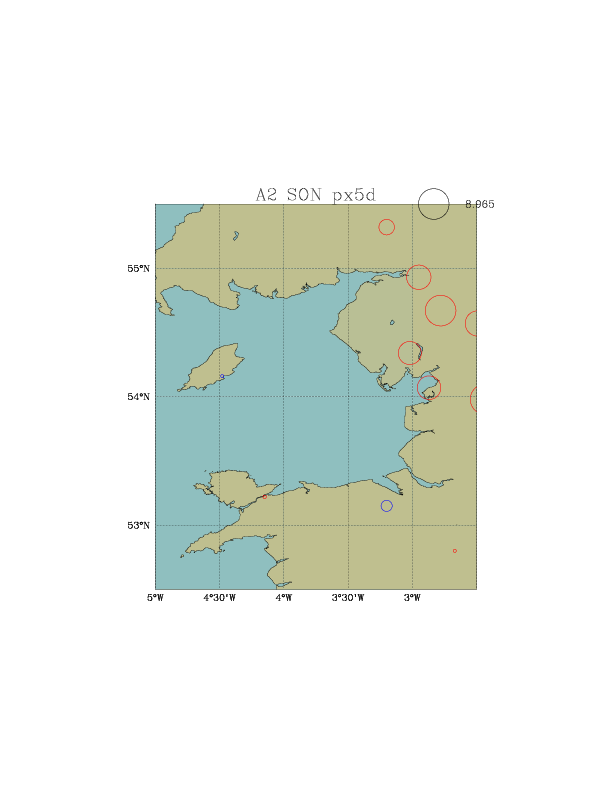
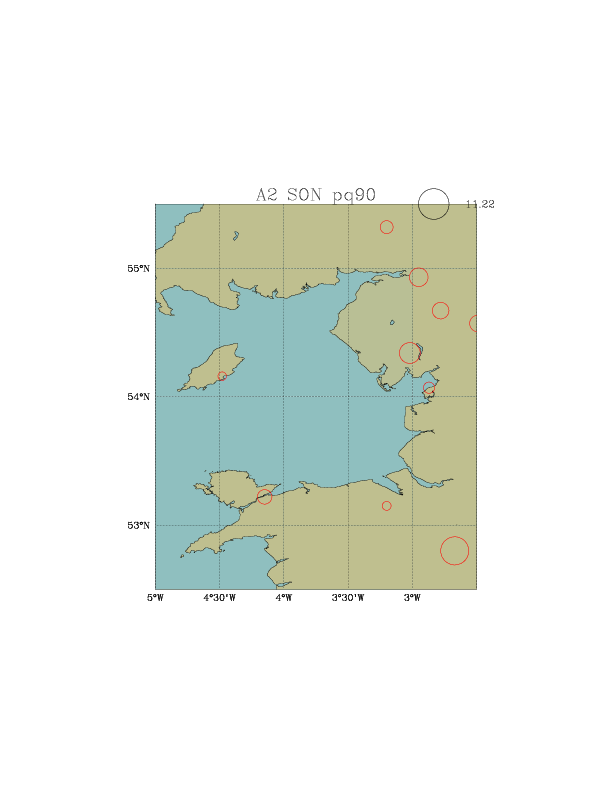
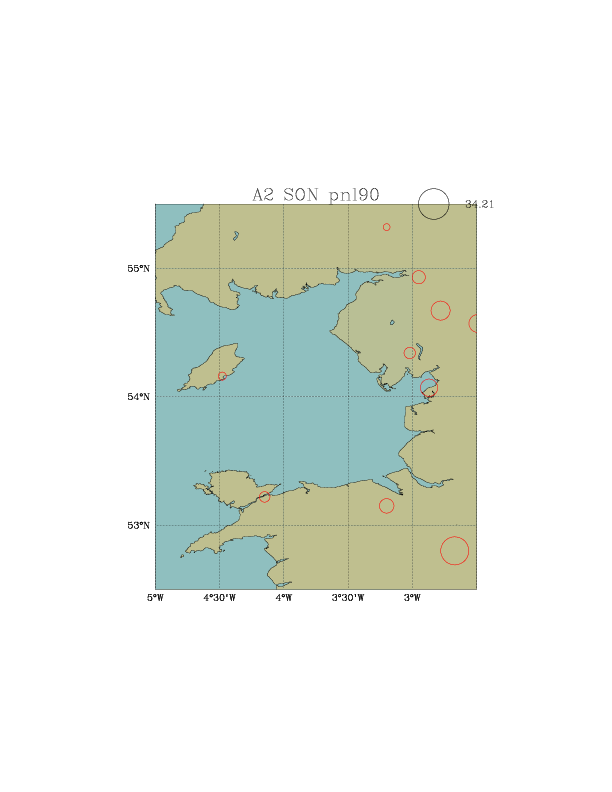
Change between 1961-1990 and 2071-2100.
A2 is average change between three ensembles in each time slice.
For SRES emission scenarios A2 and B2.
Driving GCM: HadAM3P
The following are changes (in %) of each index averaged over 6 downscaling methods. Blue is a decrease and red is an increase. Max circle size corresponds with scale in top right.
Method |
pav |
pint |
px5d |
pq90 |
pnl90 |
pfl90 |
pxcdd |
|---|---|---|---|---|---|---|---|
6-model mean SE England |
|||||||
6-model mean NW England |
Method |
pav |
pint |
px5d |
pq90 |
pnl90 |
pfl90 |
pxcdd |
|---|---|---|---|---|---|---|---|
6-model mean SE England |
|||||||
6-model mean NW England |
Method |
pav |
pint |
px5d |
pq90 |
pnl90 |
pfl90 |
pxcdd |
|---|---|---|---|---|---|---|---|
6-model mean SE England |
|||||||
6-model mean NW England |
Method |
pav |
pint |
px5d |
pq90 |
pnl90 |
pfl90 |
pxcdd |
|---|---|---|---|---|---|---|---|
6-model mean SE England |
|||||||
6-model mean NW England |