EcoChange : climate data
Data description
1. Observed climate
Data files of observed climate were compiled using data from the
CRU CL 2.0 data bank
(New et al., 2002).
The data bank provides mean monthly climatology of surface climate
over global land areas over a 10° lat/lon grid developed from
meteorological station observations for the period 1961–1990. The
station network is particularly dense over Europe. The climate
parameters, which are provided for each calendar month, comprise
daily mean temperature, daily minimum temperature, daily maximum
temperature, number of days with ground-frost, precipitation rate,
rainy days (days with >0.1 mm precipitation total), potential
evapotranspiration (or "reference evapotranspiration"), vapour
pressure, sunshine duration, and wind speed at 10-meter height
(see tabulated list).
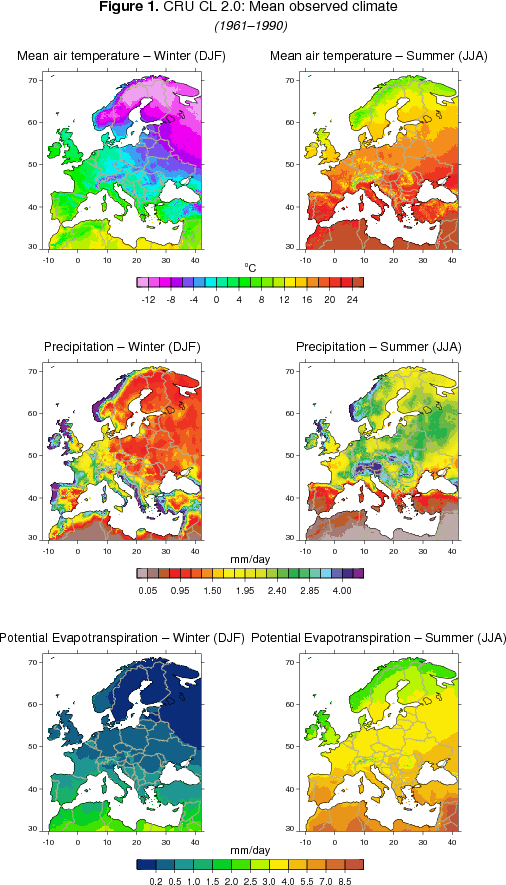
The patterns of the surface climate parameters vary with latitude,
mean atmospheric circulation, orography, proximity to water bodies
(lakes and seas), and of course with the season (Figure 1).
|
|
Figure 1. Observed mean climate (temperature, precipitation and potential
evapotranspiration fields) over 1961–1990 extracted from the CRU CL
2.0 dataset for winter and summer.
|
2. PRUDENCE modelled climate
Data files of modelled climate from regional climate model (RCM)
experiments produced in the frame-work of the
PRUDENCE project
(Christensen et al., 2002; 2007a; 2007b)
were compiled. The model runs simulate the historical 1961–1990
climate and also project the future 2071–2100 climate for two IPCC
SRES scenarios: A2 & B2 (i.e. a high- and a moderate-emissions
scenario; Nakićenović et al., 2000).
From three different RCMs (SMHI-RCAO, CNRM-Arpège and Hadley
Centre-HadRM3P) driven by different global-scale general circulation
models (GCMs; ECHAM4/OPYC, Arpège/OPA and HadAM3P, respectively)
mean fields for each calendar month were estimated for the parameters
of daily mean temperature, daily minimum temperature, daily maximum
temperature, precipitation, snow water-equivalent, evaporation,
potential evapotranspiration, sunshine duration and 10-meter wind
speed (see tabulated list).
These fields are available over a 0.50 deg (i.e. 30 min) lat/lon
grid. One of the models (HC-HadRM3P) has been used to generate A2
scenario projections under three different initial conditions. The
use of multiple model and simulations aims to provide some basis for
estimating of the modelling uncertainty.
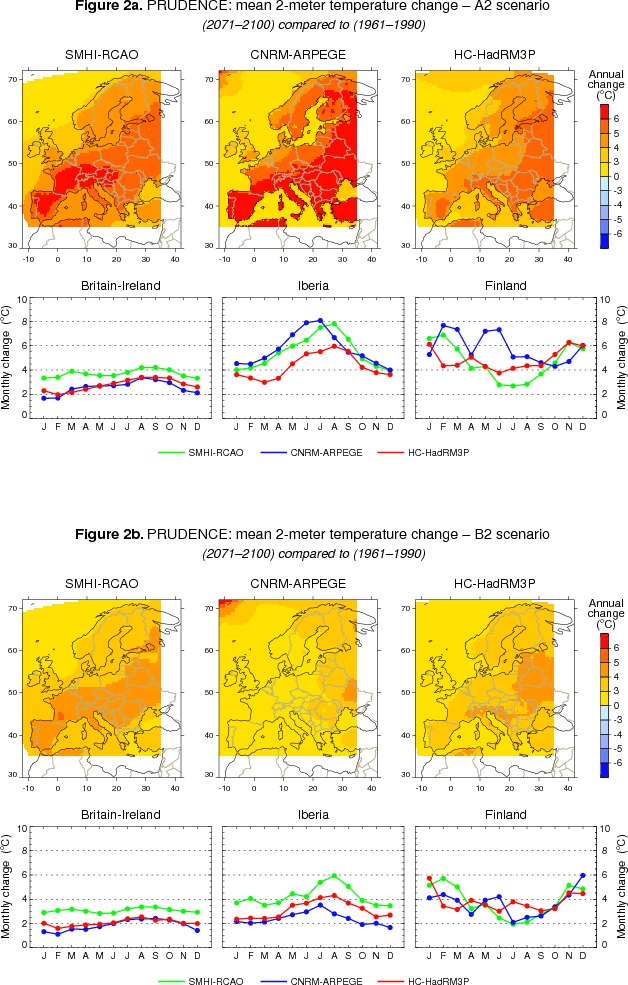
The climate projections vary with the particular models. However, they
share some common broad-scale features regarding the character of the
projected climate changes. For temperature, a general temperature
rise, stronger for A2 scenario (Figure 2a) and modest for B2 scenario
(Figure 2b) is observed across Europe with north-western Europe being
the region with the smallest change. The intra-annual cycle change
exhibit a geographical dependence: a) Britain & Ireland have a
small change being nearly constant through the annual cycle, although
the summer is slightly warmer than the other seasons, b) Southern
Europe becomes warmer, prominently in summer, c) North-eastern Europe
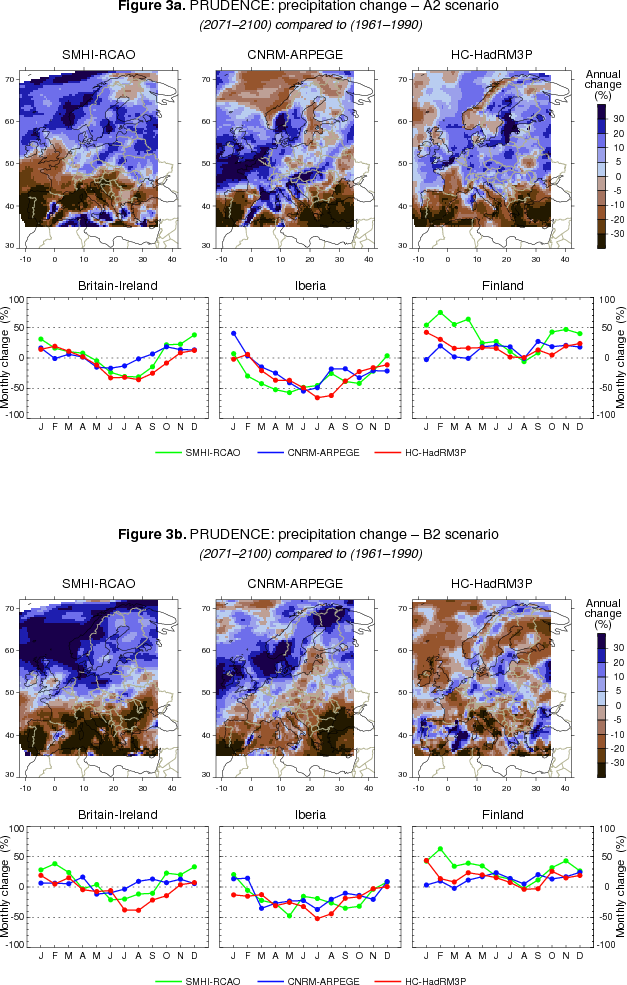
also gets warmer, but more in winter. For precipitation, a north to
south Europe differential change is found with (a) the Mediterranean
region becoming dryer and (b) Scandinavia becoming in general wetter,
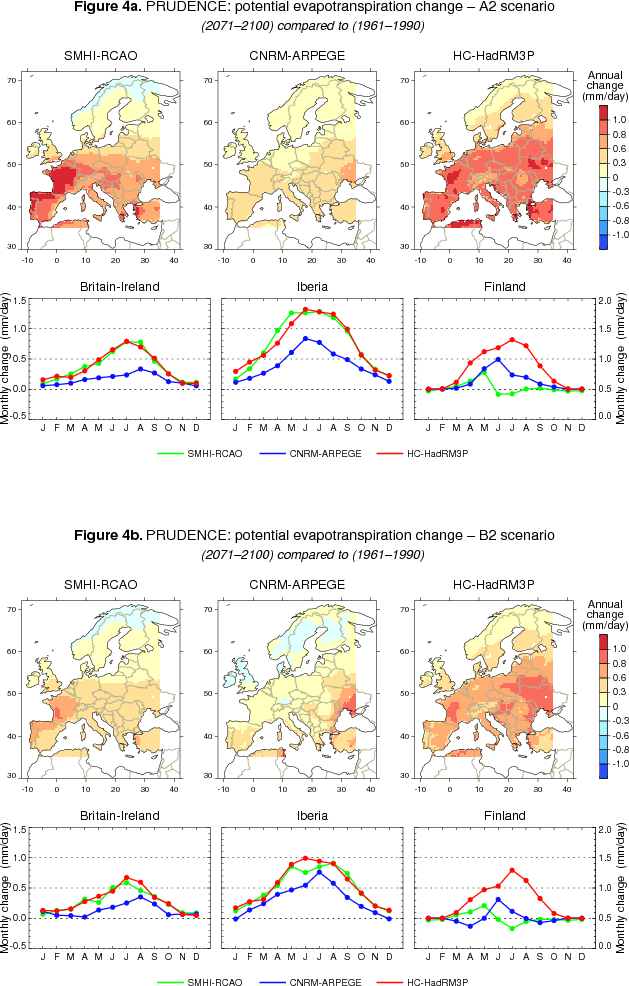
more in winter (Figures 3a & 3b). The potential
evapotranspiration appears to increase almost everywhere in
Europe (since it depends considerably on temperature change) and
mainly in summer. However, Northern Scandinavia exhibits some
decrease in summer (in the SMHI-RCAO simulation) due to increased
cloudiness (which reduces the solar radiation reaching the surface)
and also due to more humid air conditions there which both favour a
diminution of evaporation that dominates the effects of the
temperature increase.
|
|
Figure 2. PRUDENCE model projections of mean temperature change for (a) A2 scenario, and (b) B2 scenario.
|
|
|
Figure 3. PRUDENCE model projections of precipitation change for (a) A2 scenario, and (b) B2 scenario.
|
|
|
Figure 4. PRUDENCE model projections of potential evapotranspiration change for (a) A2 scenario, and (b) B2 scenario.
|
2. ENSEMBLES modelled climate
Data files of modelled climate from transient climate simulations for
1950–2100 from the
ENSEMBLES project
(Hewitt and Griggs, 2004)
were compiled in addition to the PRUDENCE model runs (see previous
subsection). The climate simulations were produced by high-resolution
(~25km) regional climate models (RCMs) using boundary conditions
taken from various general circulation model (GCM) experiments
focusing on the SRES A1B scenario. These simulations make it possible
to study possible climate change at various stages of its evolution
up to the end of 21st century. Three different RCMs developed by
independent modelling groups (KNMI-RACMO2, DMI-HIRHAM5 and
HC-HadRM3Q0) and driven by different GCMs (ECHAM5, ARPEGE and
HadCM3Q0, respectively) were selected, as for the PRUDENCE
experiments. The output from the RCM experiments was used to estimate
mean fields (over 1961–1990 and 2071–2100) for each calendar
month for the parameters of daily mean temperature, daily minimum
temperature, daily maximum temperature, precipitation, snowfall,
evaporation, potential evapotranspiration, surface snow amount,
fractional snow cover, vapour pressure (and relative humidity),
sunshine duration and 10-meter wind speed (see tabulated list).
The climatic fields are available over a 0.25 deg (i.e. 15 min)
lat/lon grid. Long-term monthly series of these fields are also
available.
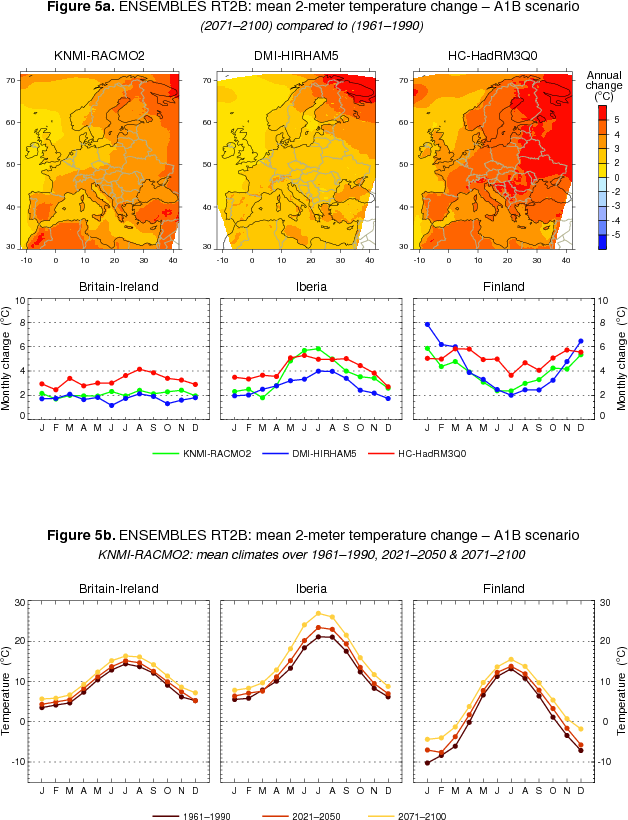
Projected climate changes by the end of the 21st century (2071–2100) with
respect to 20th century (1961–1990) exhibit general similarities to
the results from the PRUDENCE experiments. All models exhibit a
general warming across Europe in all seasons, although less strong
than for the A2 scenario (PRUDENCE experiments). Again, north-west
Europe experiences a moderate warming, Mediterranean Europe becomes
particularly hot in summer, whereas north-east Europe is affected
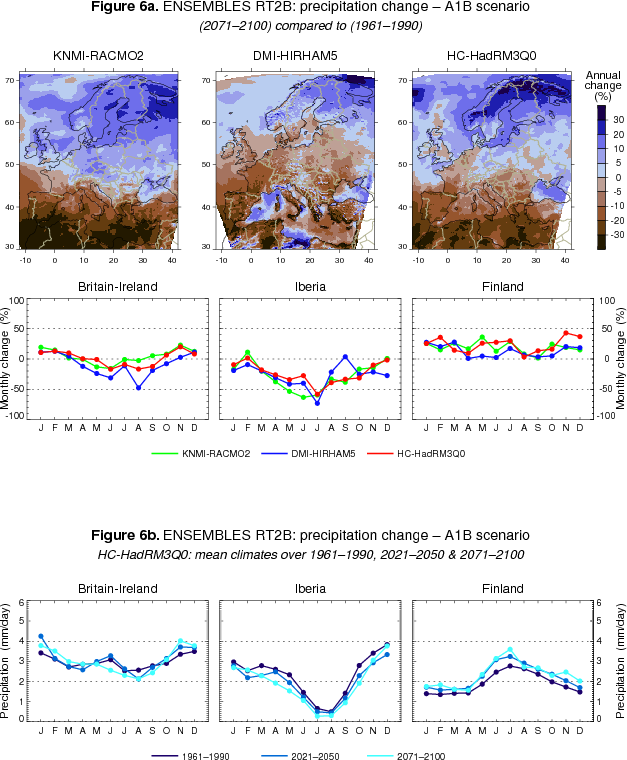
mainly in winter (Figure 5). Precipitation changes have different
signs between northern and southern parts of Europe. In the
Mediterranean, dryer conditions are found. At high latitudes, in
contrast, wetter conditions are projected in the future, with a more
consistent precipitation increase in winter (Figure 6).
|
|
Figure 5. ENSEMBLES model projections of mean temperature change for the A1B scenario (a) by the end (2071–2100) and the middle (2021–2050) of 21st century.
|
|
|
Figure 6. ENSEMBLES model projections of precipitation change for the A1B scenario (a) by the end (2071–2100) and the middle (2021–2050) of 21st century.
|