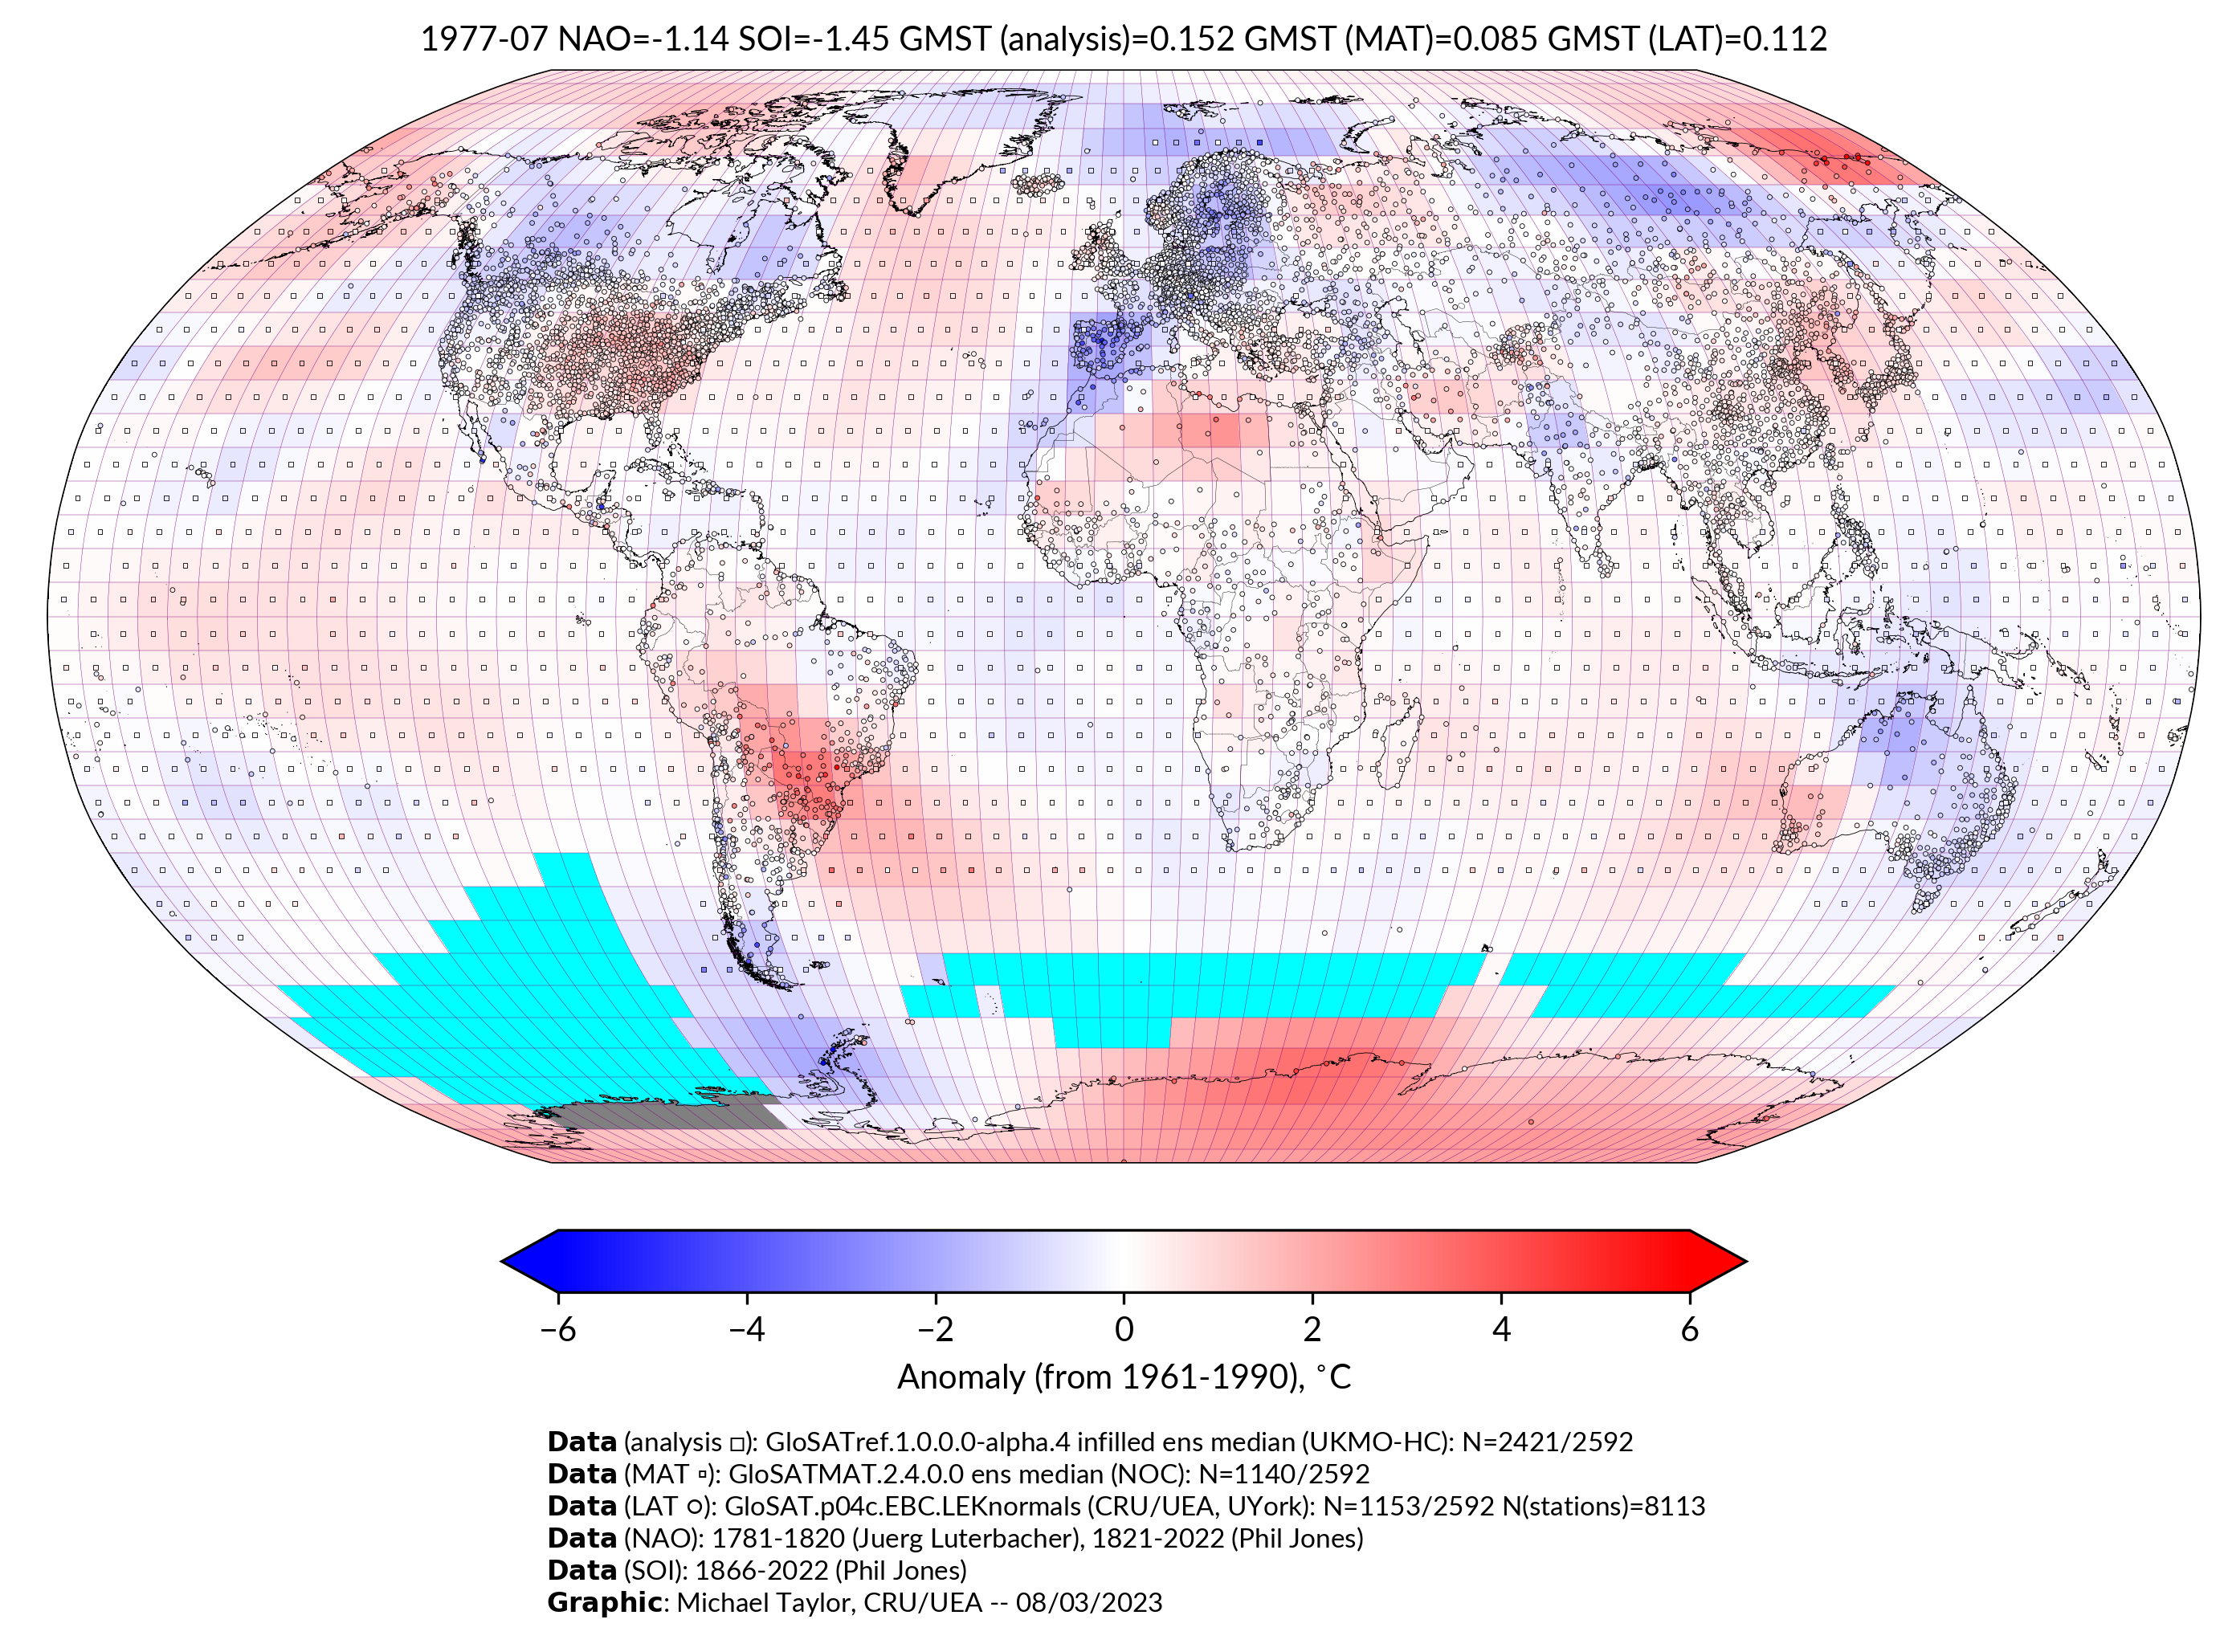
These maps show gridded temperature anomalies from GloSATref together with the underlying observed temperature anomalies (small squares: marine air temperature observations, small circles: land air temperature from weather stations)
Jump earlier (begins Jan 1781)
Jump later (ends Dec 2021)
License
We hope that these datasets and images/figures are used widely.
Graphs and maps. These images are made available under the Creative Commons Attribution 4.0 International License (CC-BY-4.0). You may freely share, copy, adapt and redistribute these images for both commercial and non-commercial purposes provided that you give credit to UEA. If the image already says it is from UEA, then just use it. If the image doesn't already credit UEA or if you adapt it so the UEA name is removed, then you should specifically credit UEA (e.g. "Used with permission from the University of East Anglia (UEA)").
Datasets. These datasets are made available under the Open Database License. Any rights in individual contents of the datasets are licensed under the Database Contents License under the conditions of Attribution and Share-Alike.