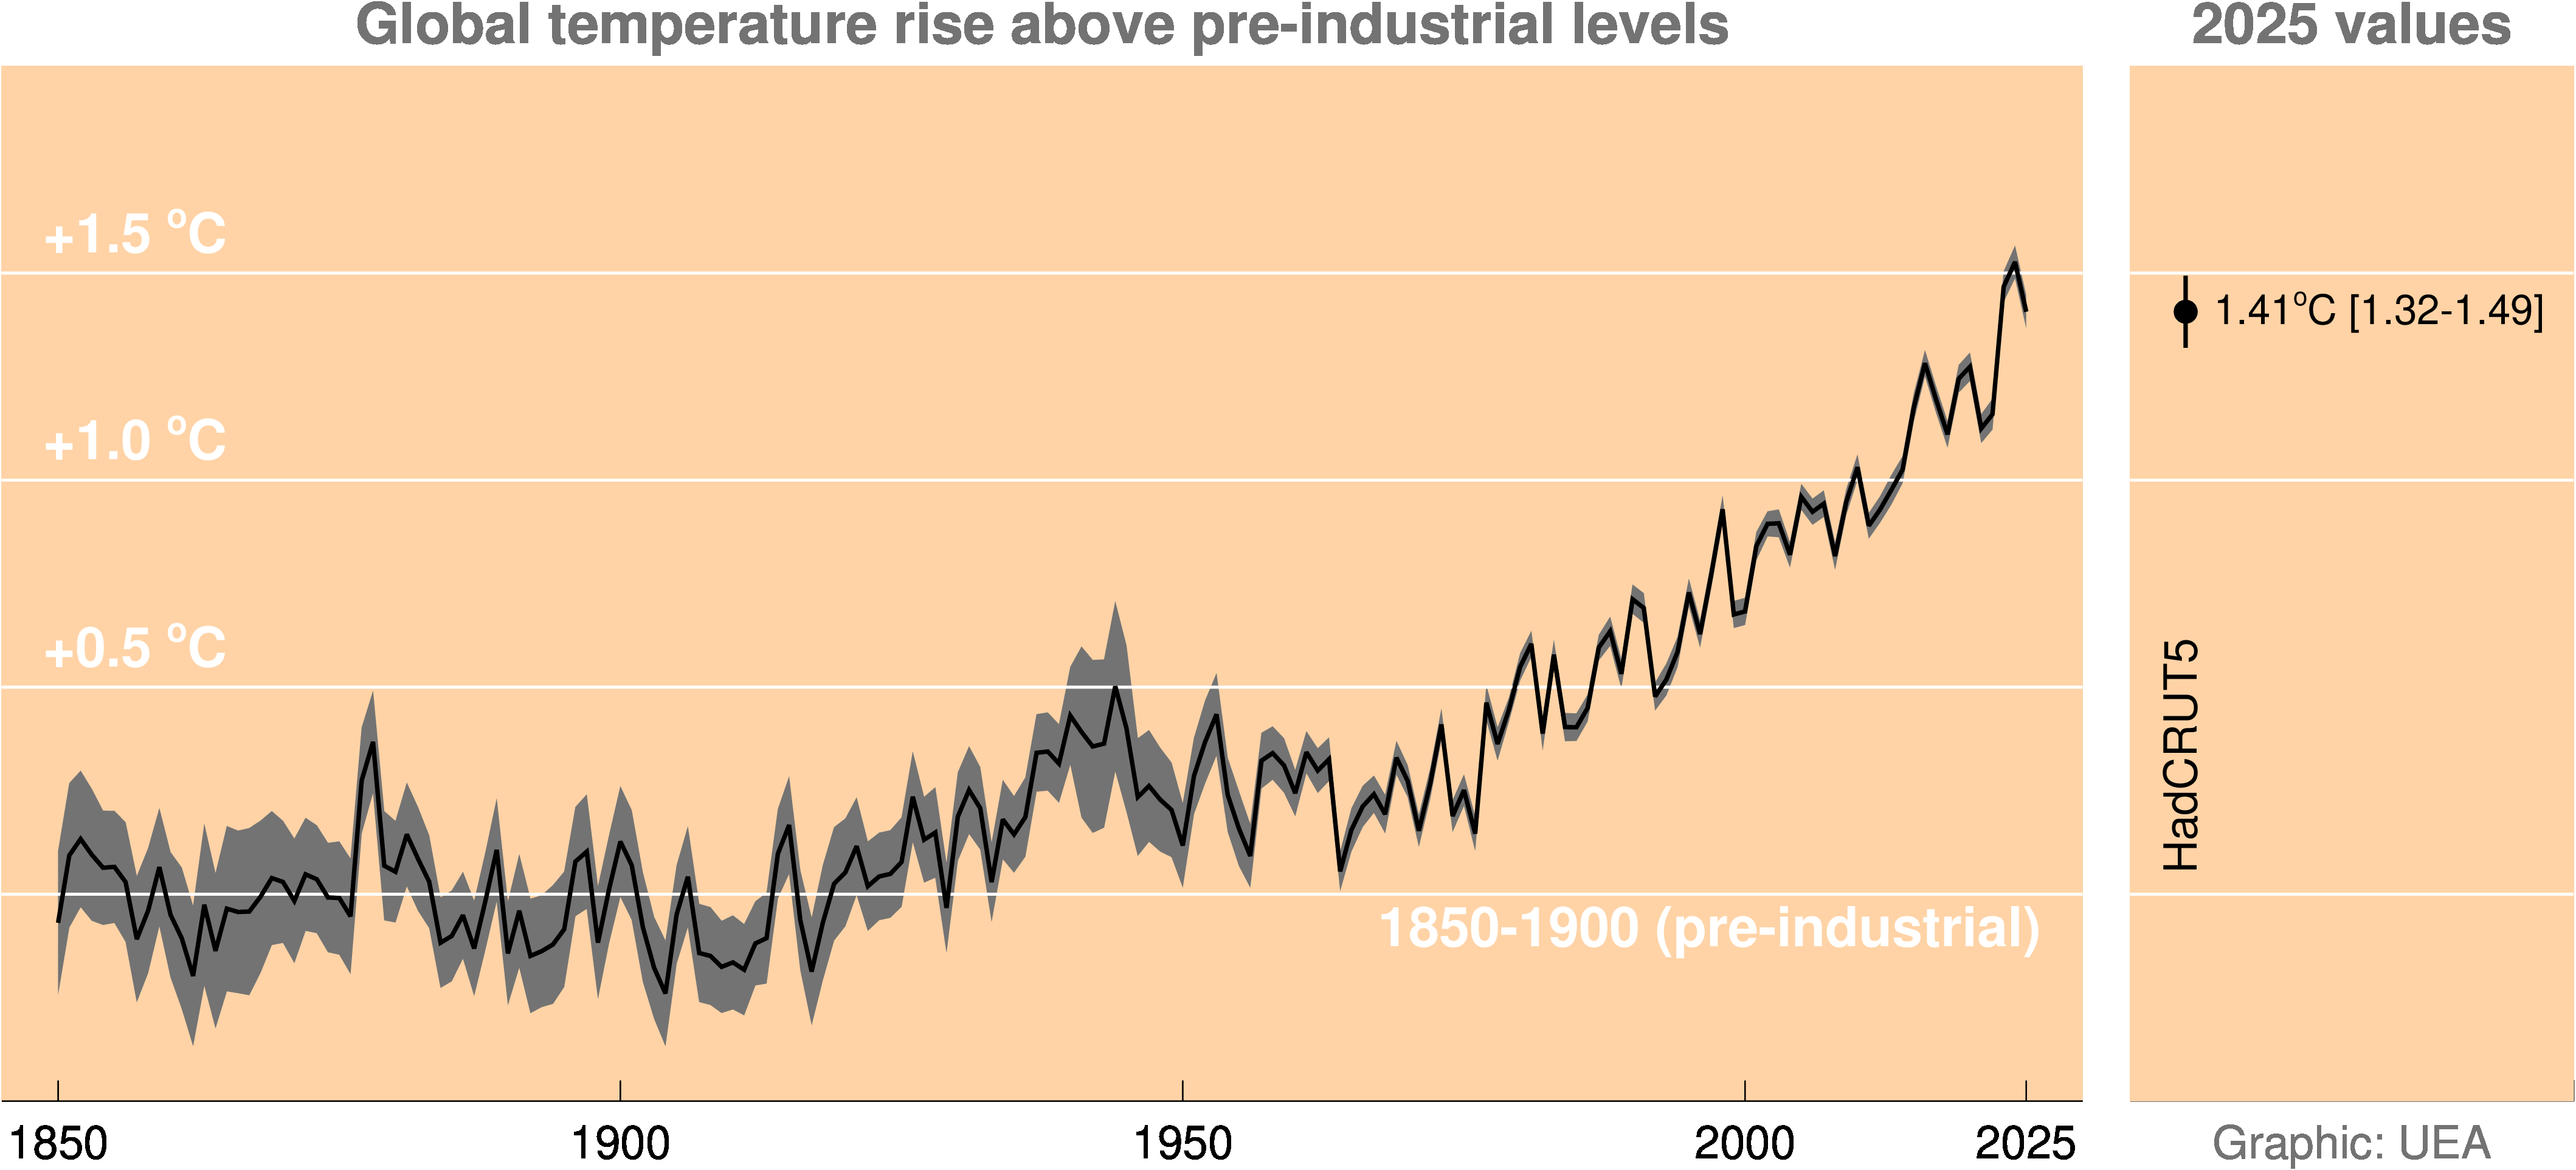
The 2025 data values mentioned in the text and shown in the graphs/maps are still preliminary and subject to minor changes. Finalised data will be provided on 14 January.
Media enquiries and interview requests can be directed to the UEA media centre.
Click each heading to expand a section.
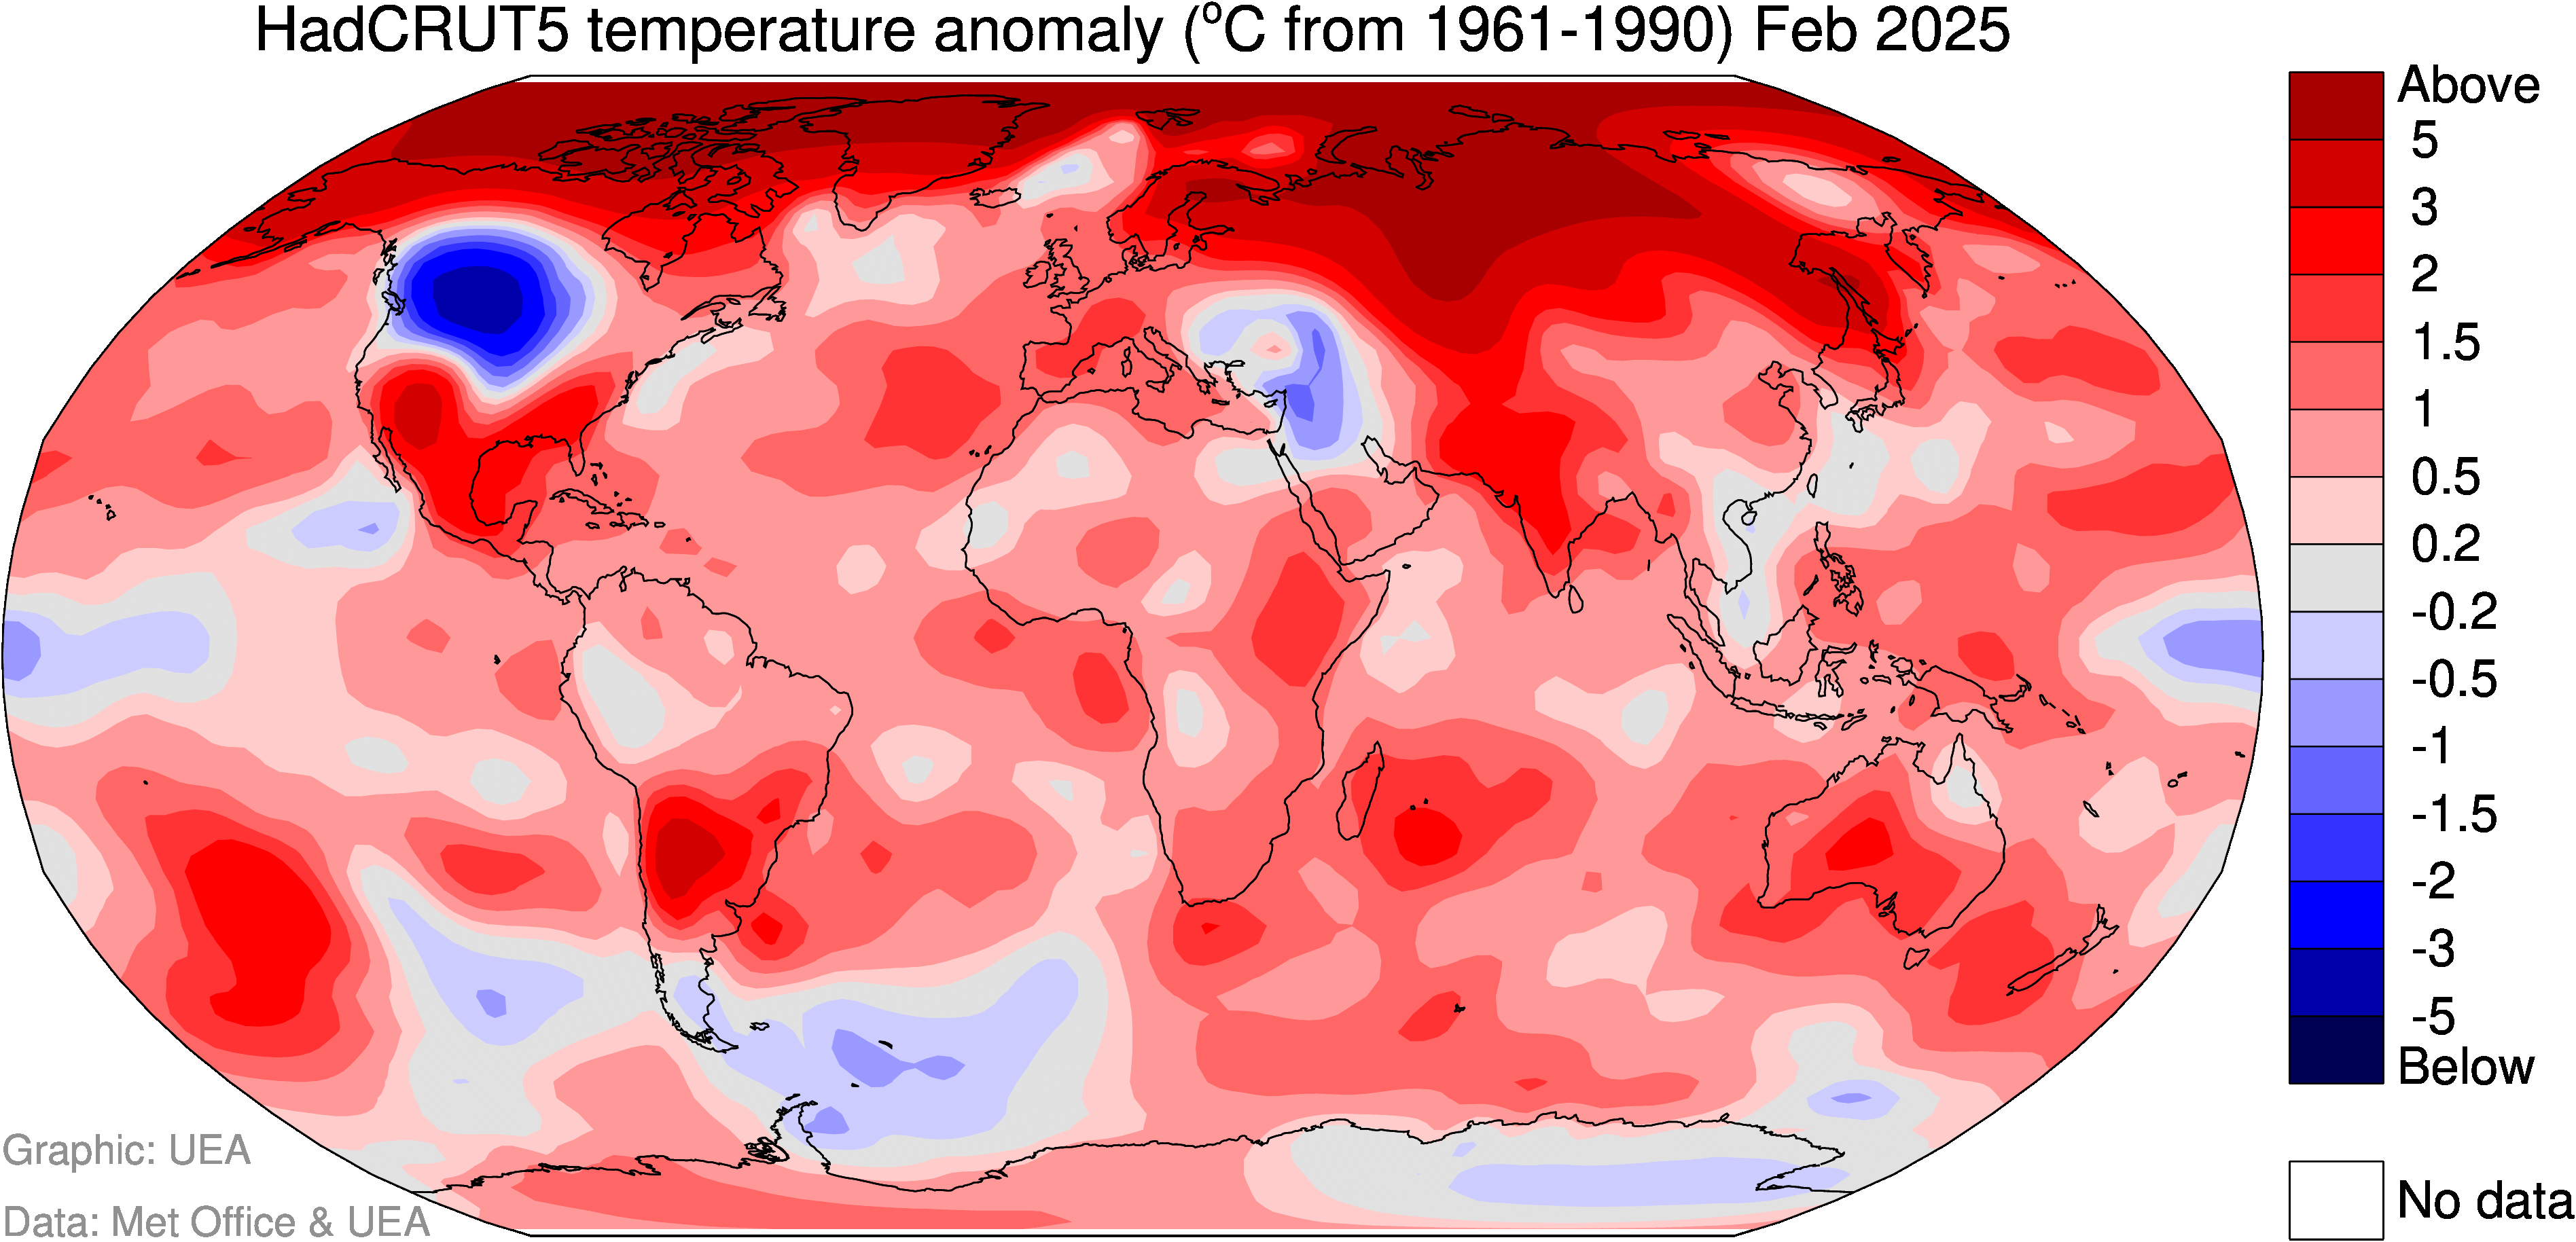
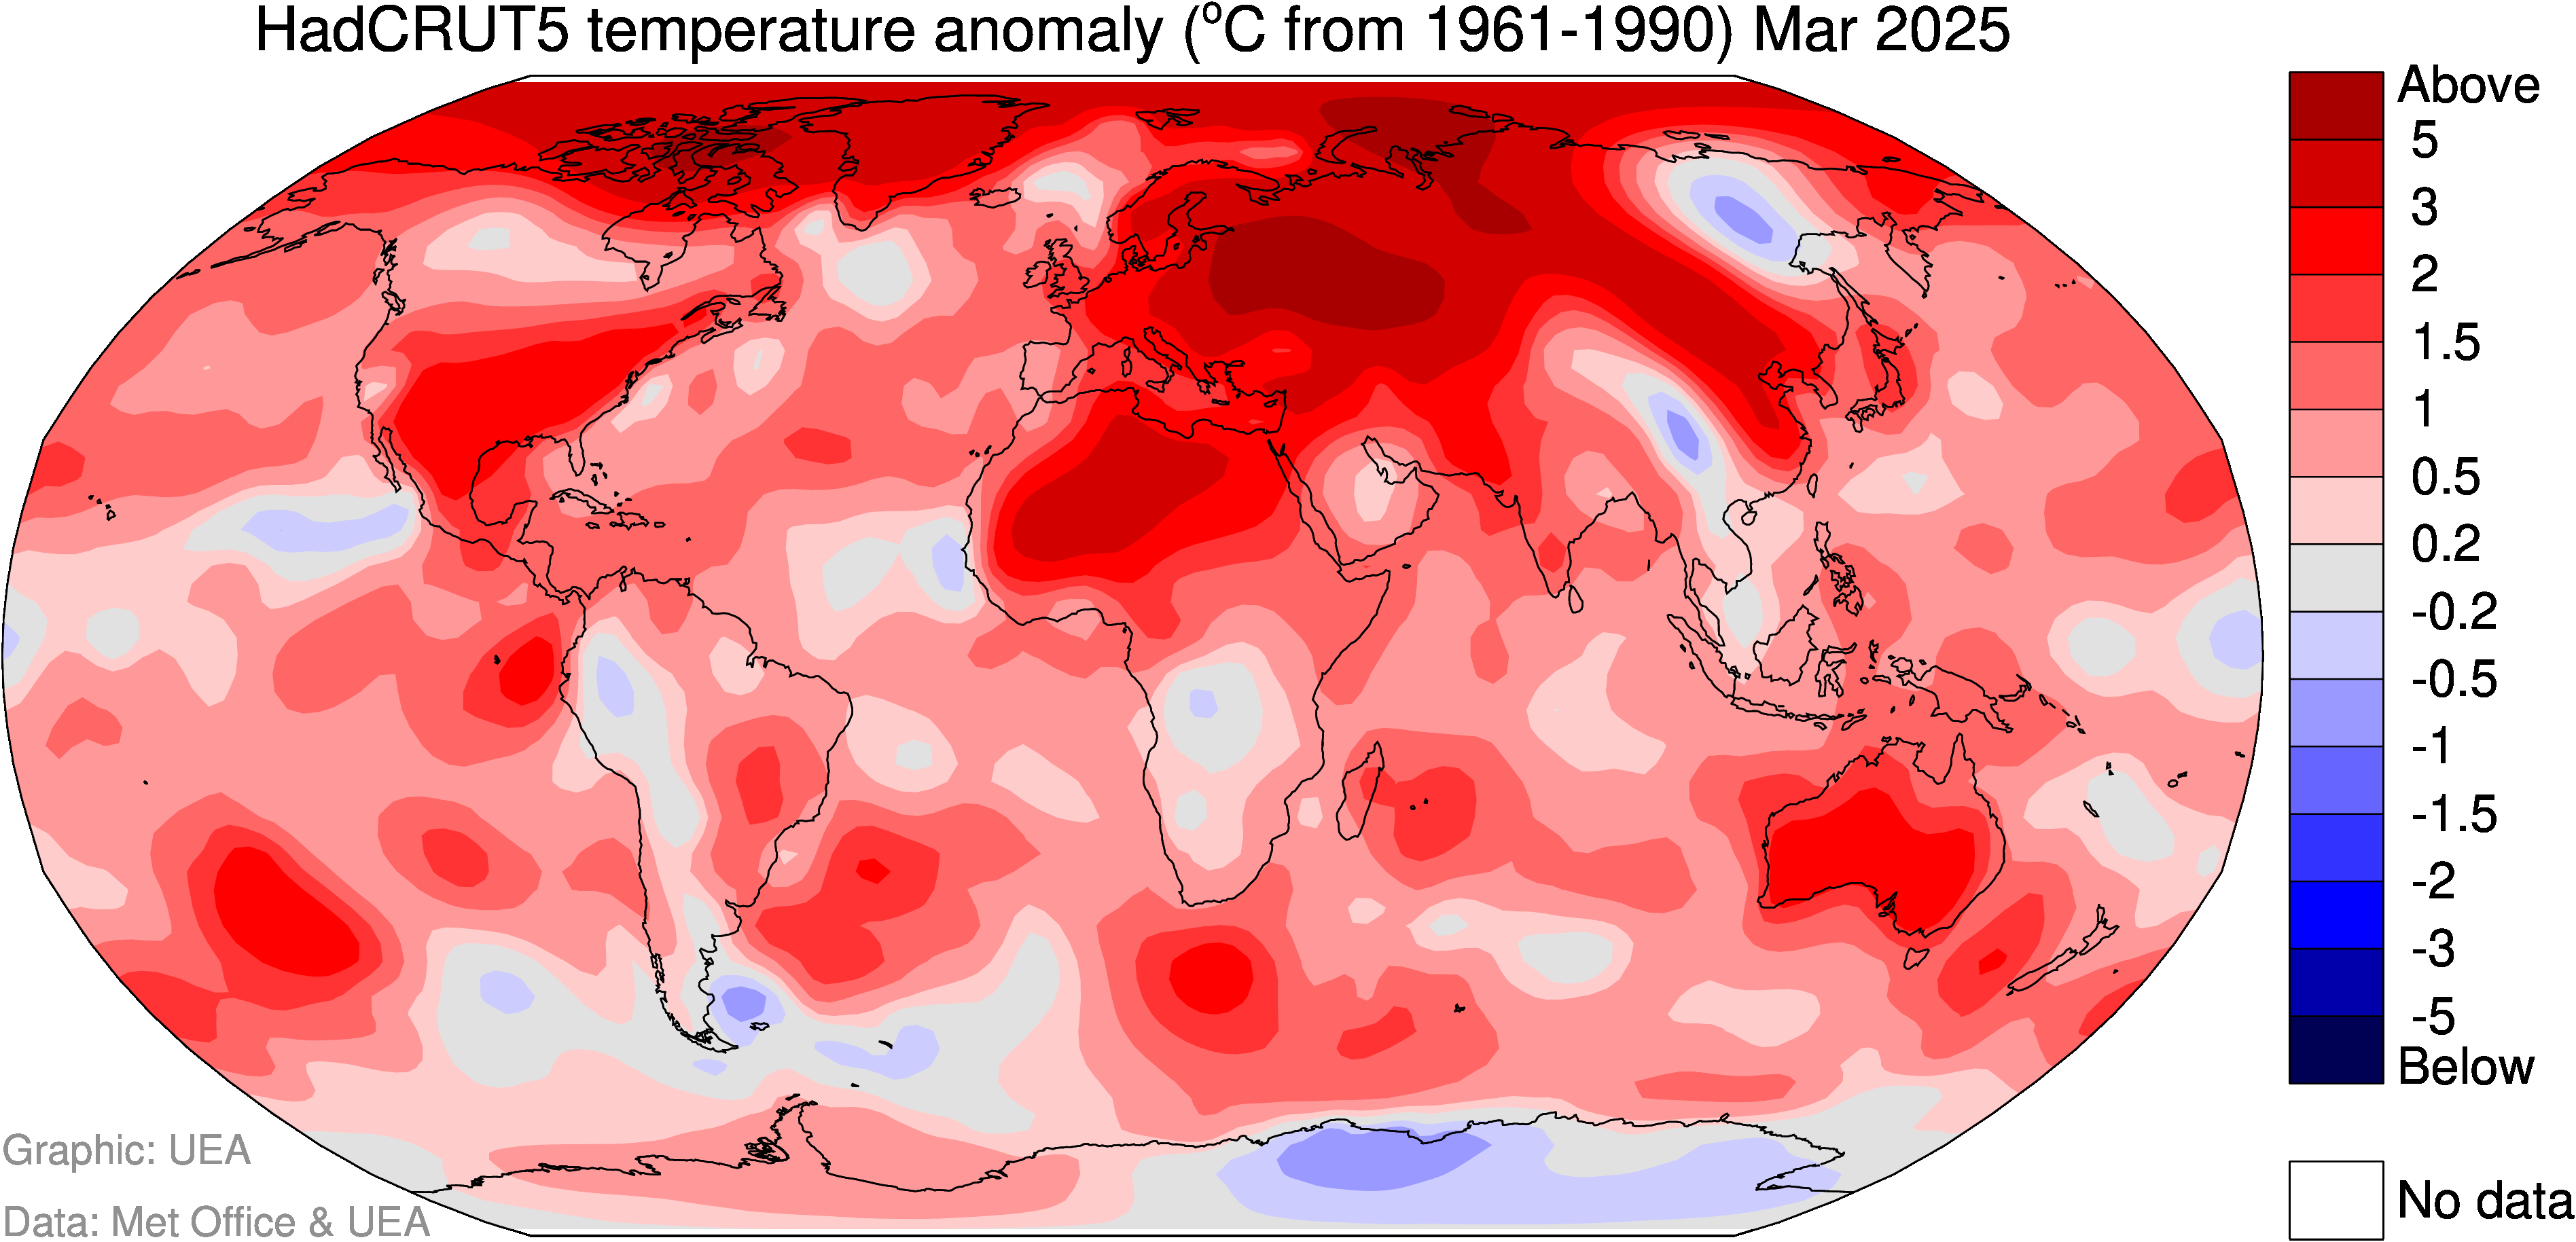
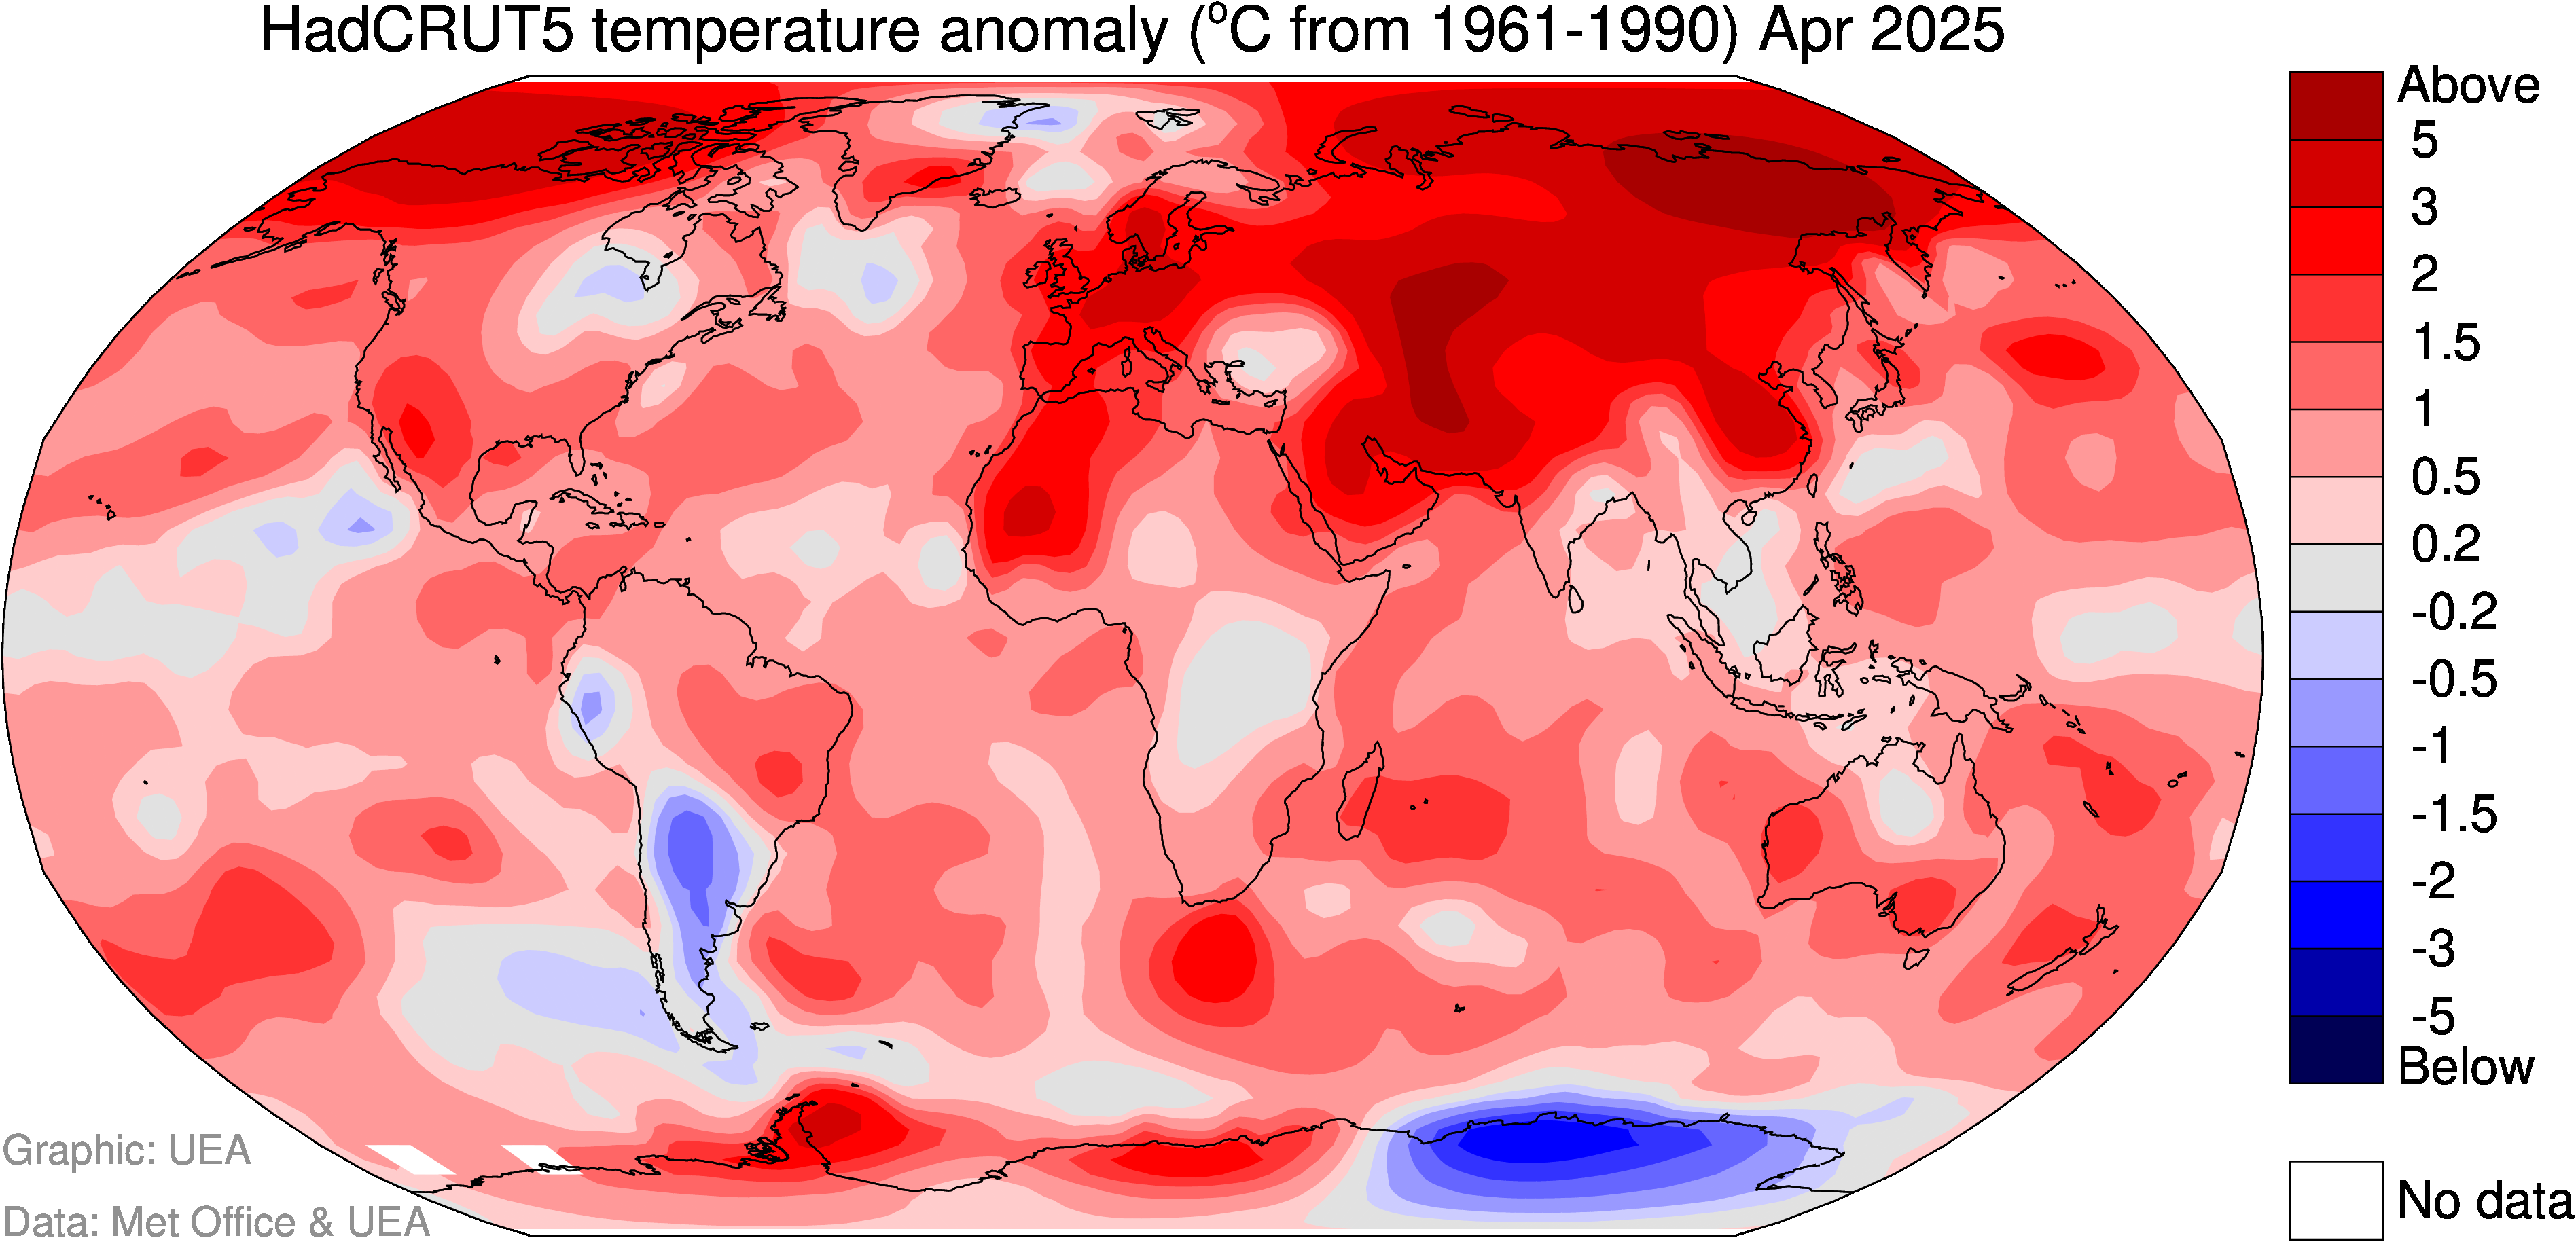
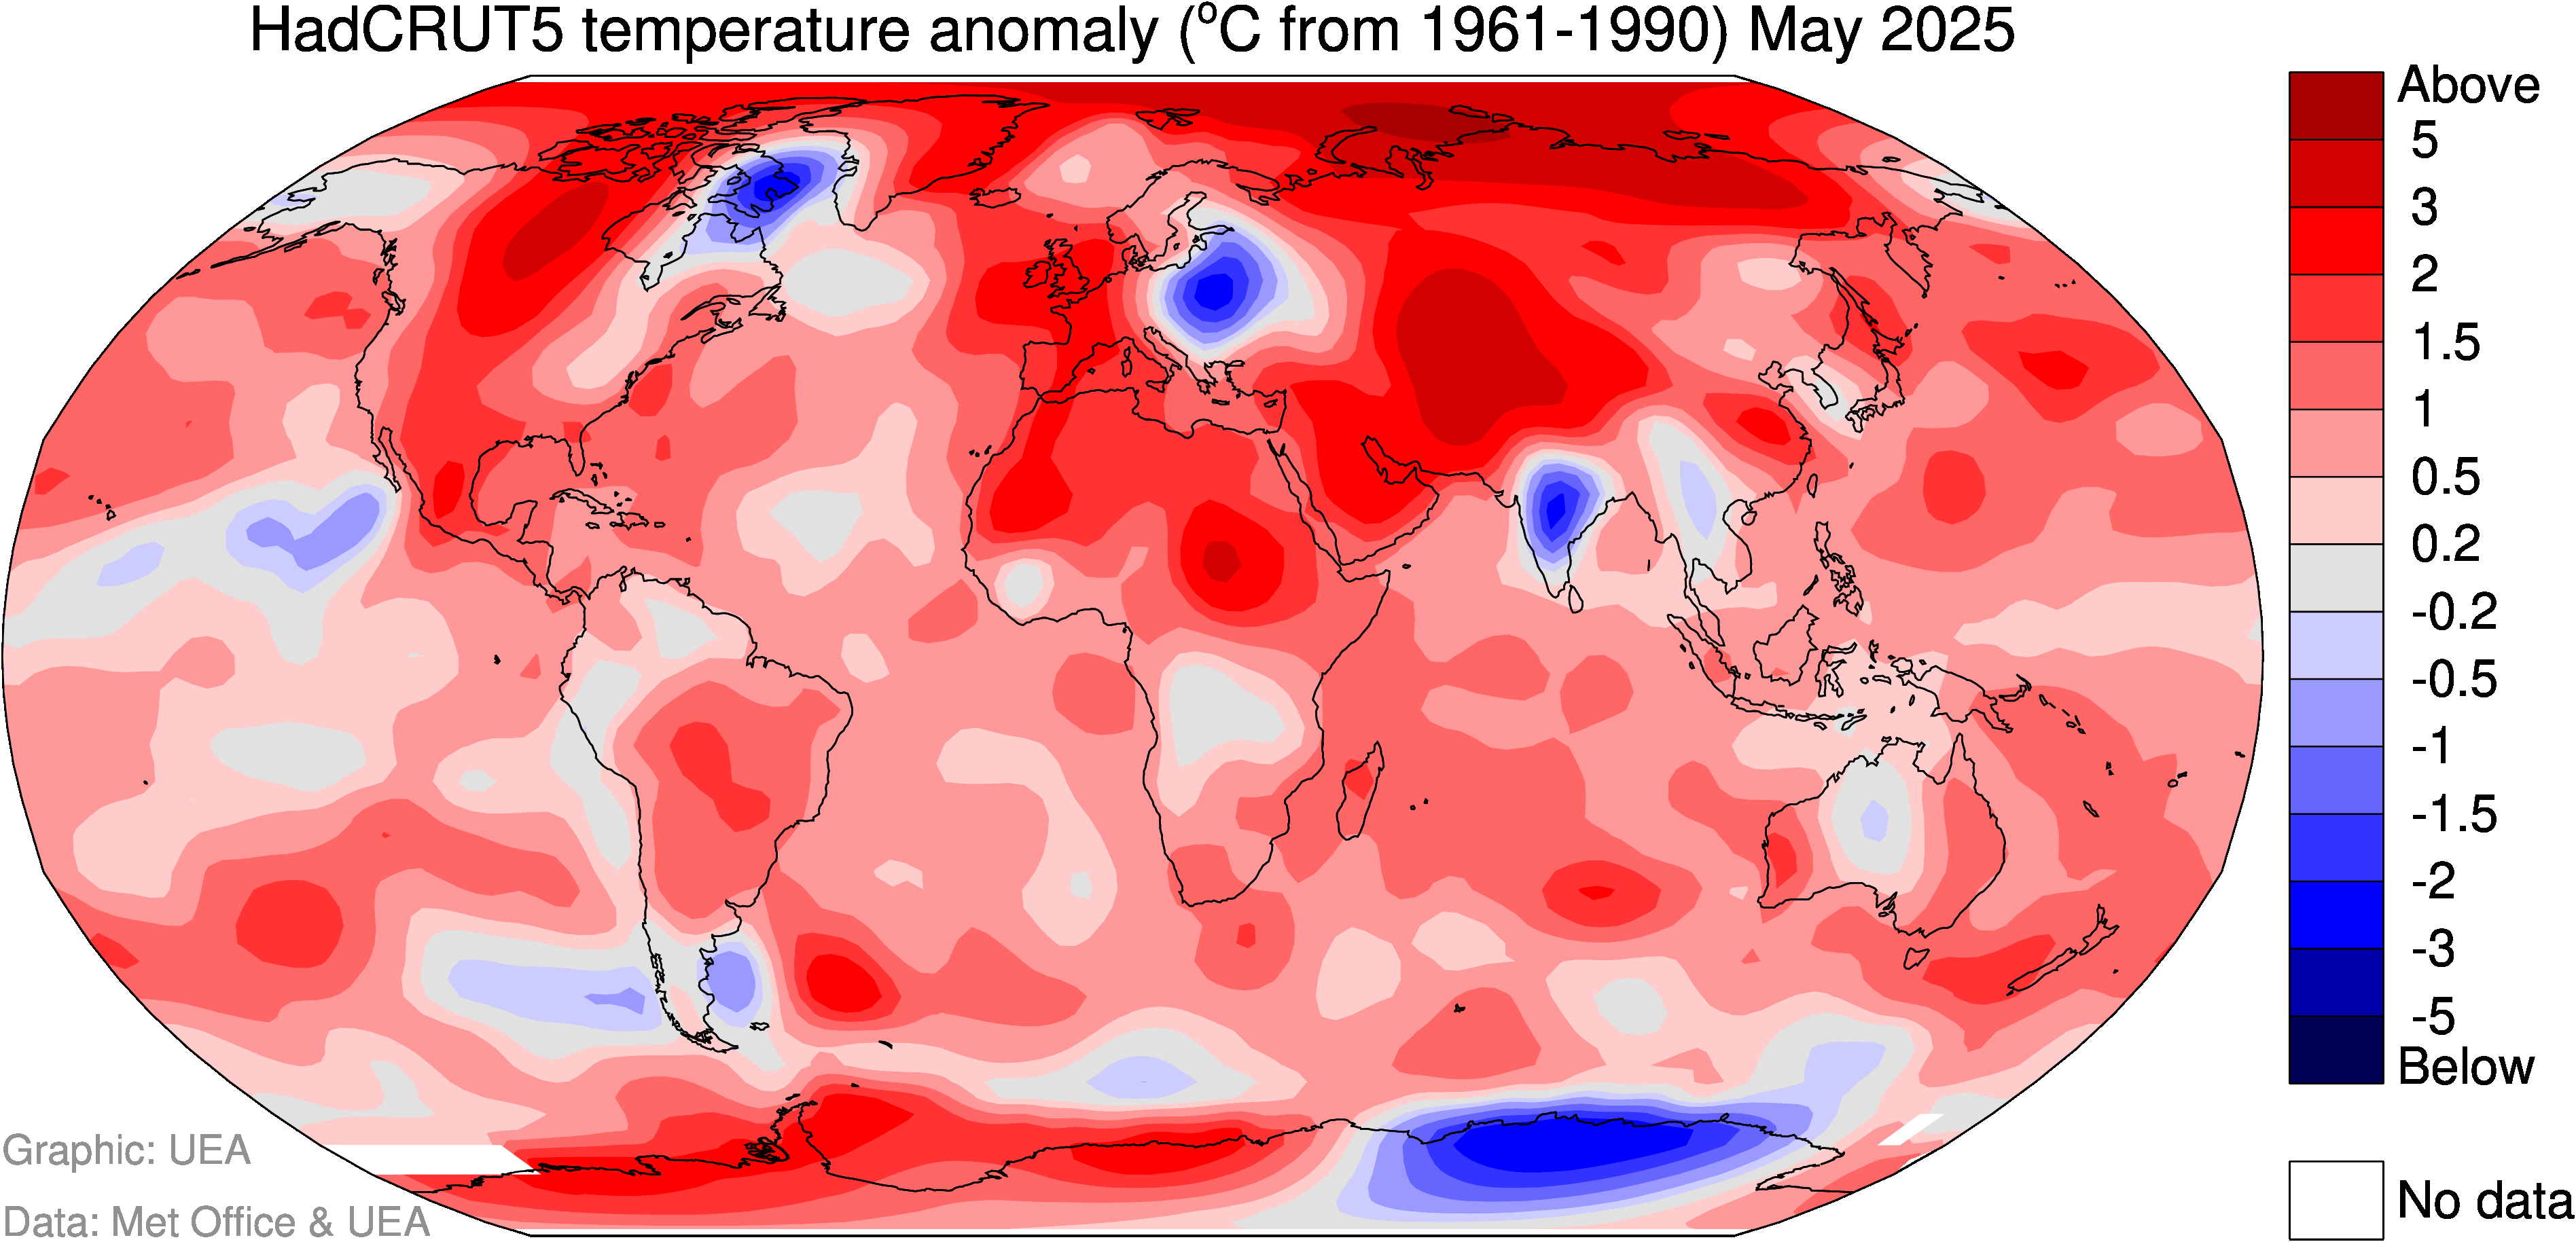
Click image for a larger version
Data available here: csv and xslx formats
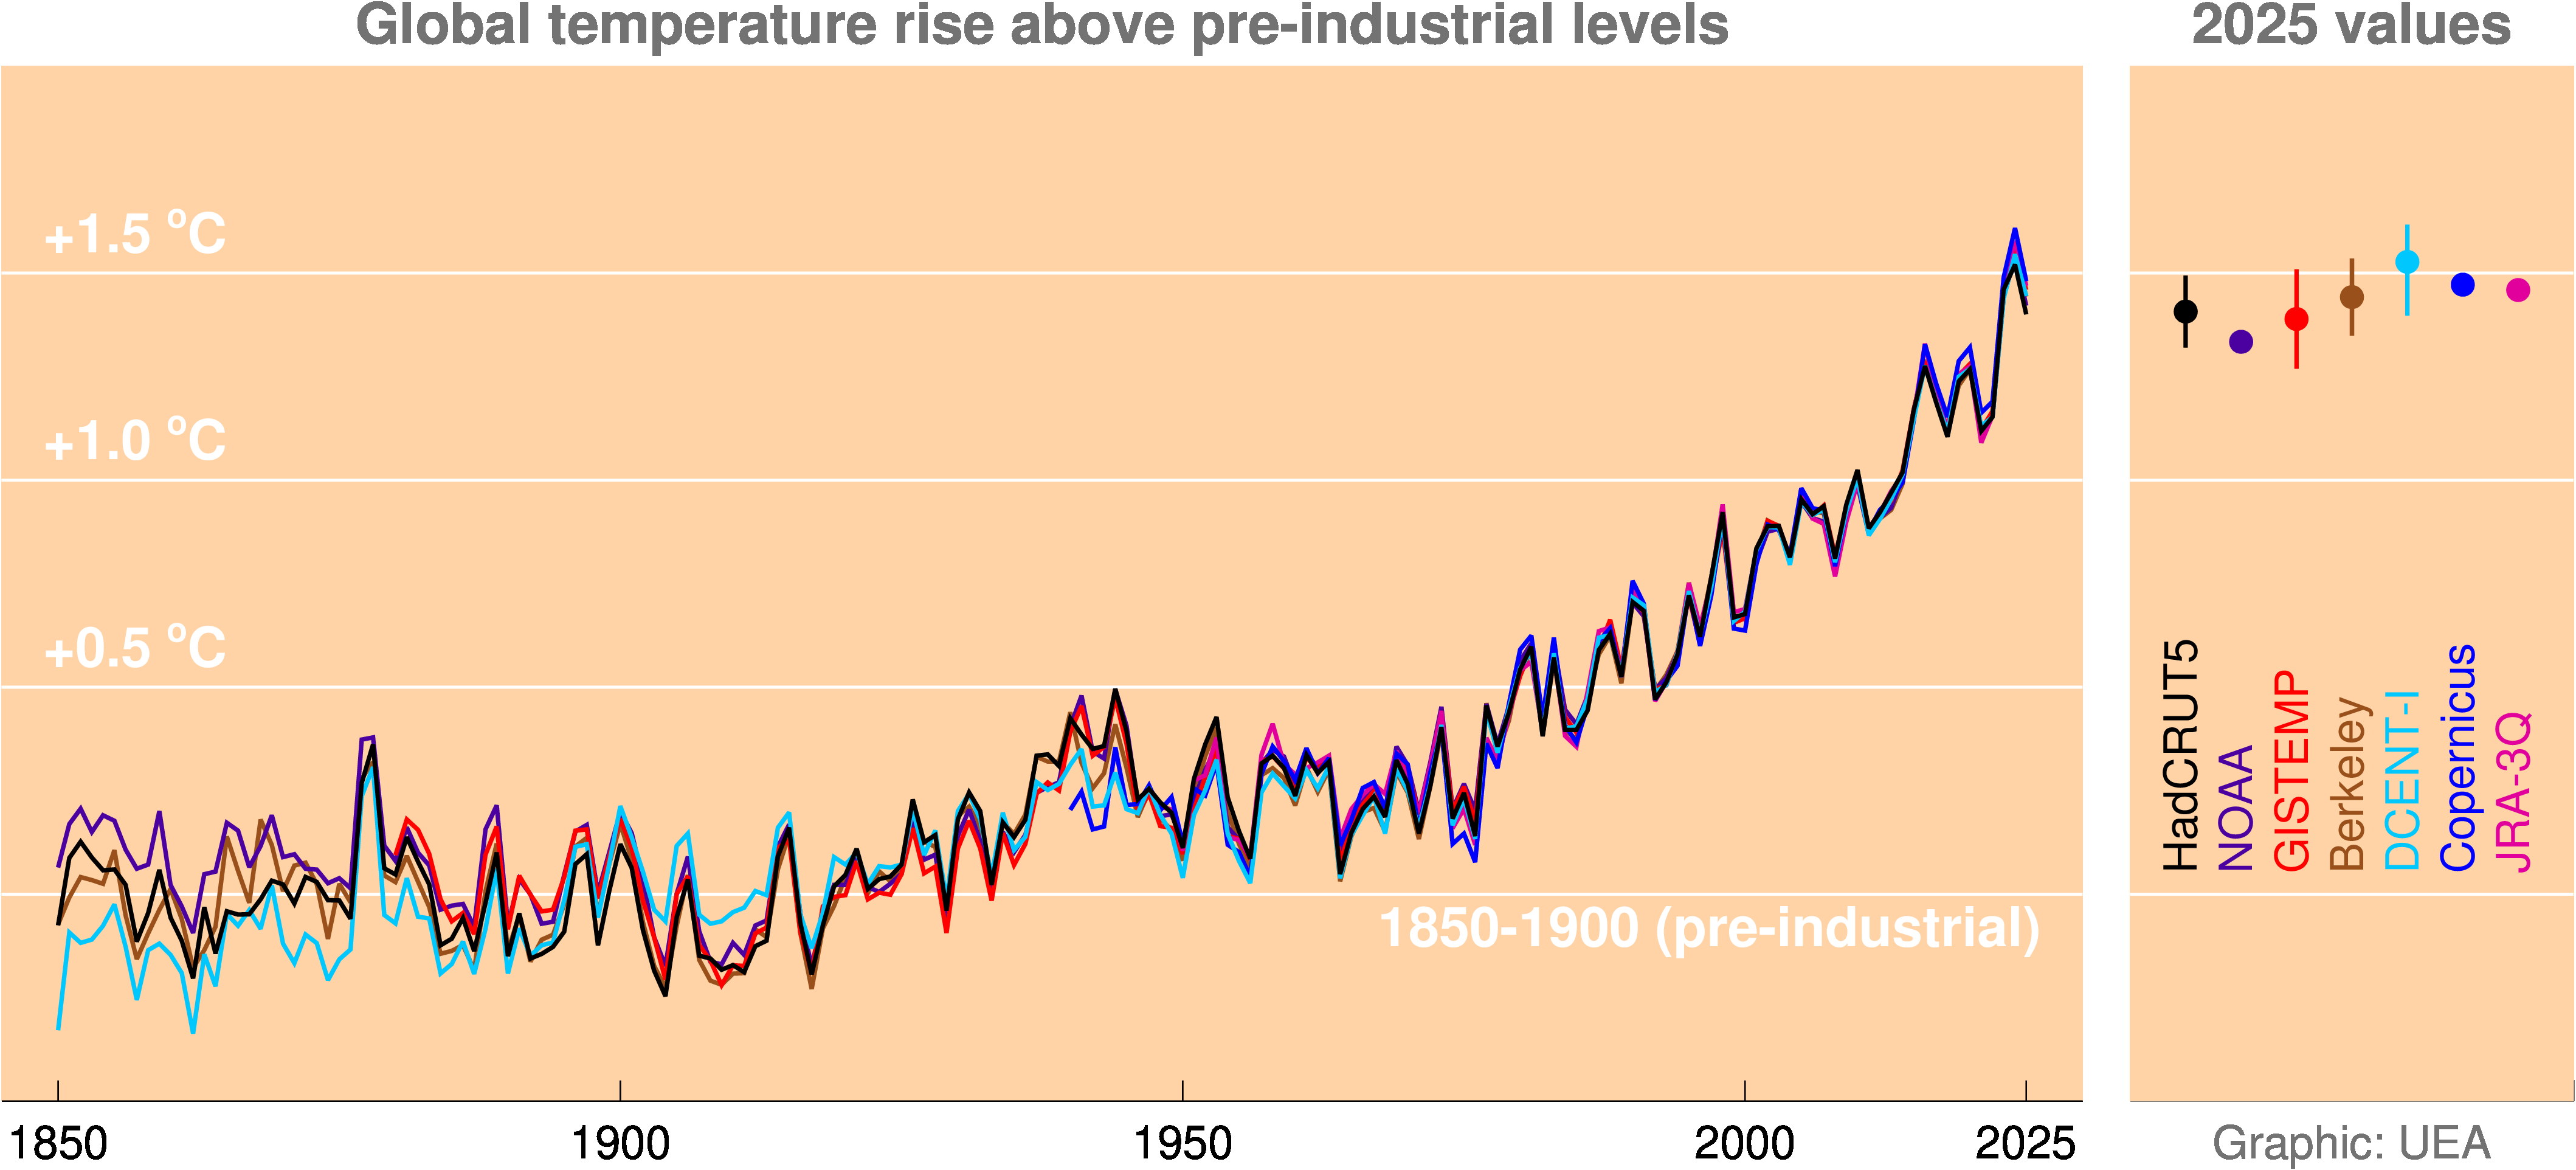
Note: in the left panel of this graph, the individual series have been offset so that they all have the same mean during 1981-2010 and the average of the HadCRUT5, NOAA, Berkeley and DCENT-I 1850-1900 baselines is also zero. Each individual series' pre-industrial baseline is then no longer zero, but it illustrates that the overall uncertainty (indicated by the spread between datasets) is greatest pre-1950, and especially pre-1900, and there is very strong agreement between datasets in the last 50 years.
Click image for a larger version
Click image for a larger version
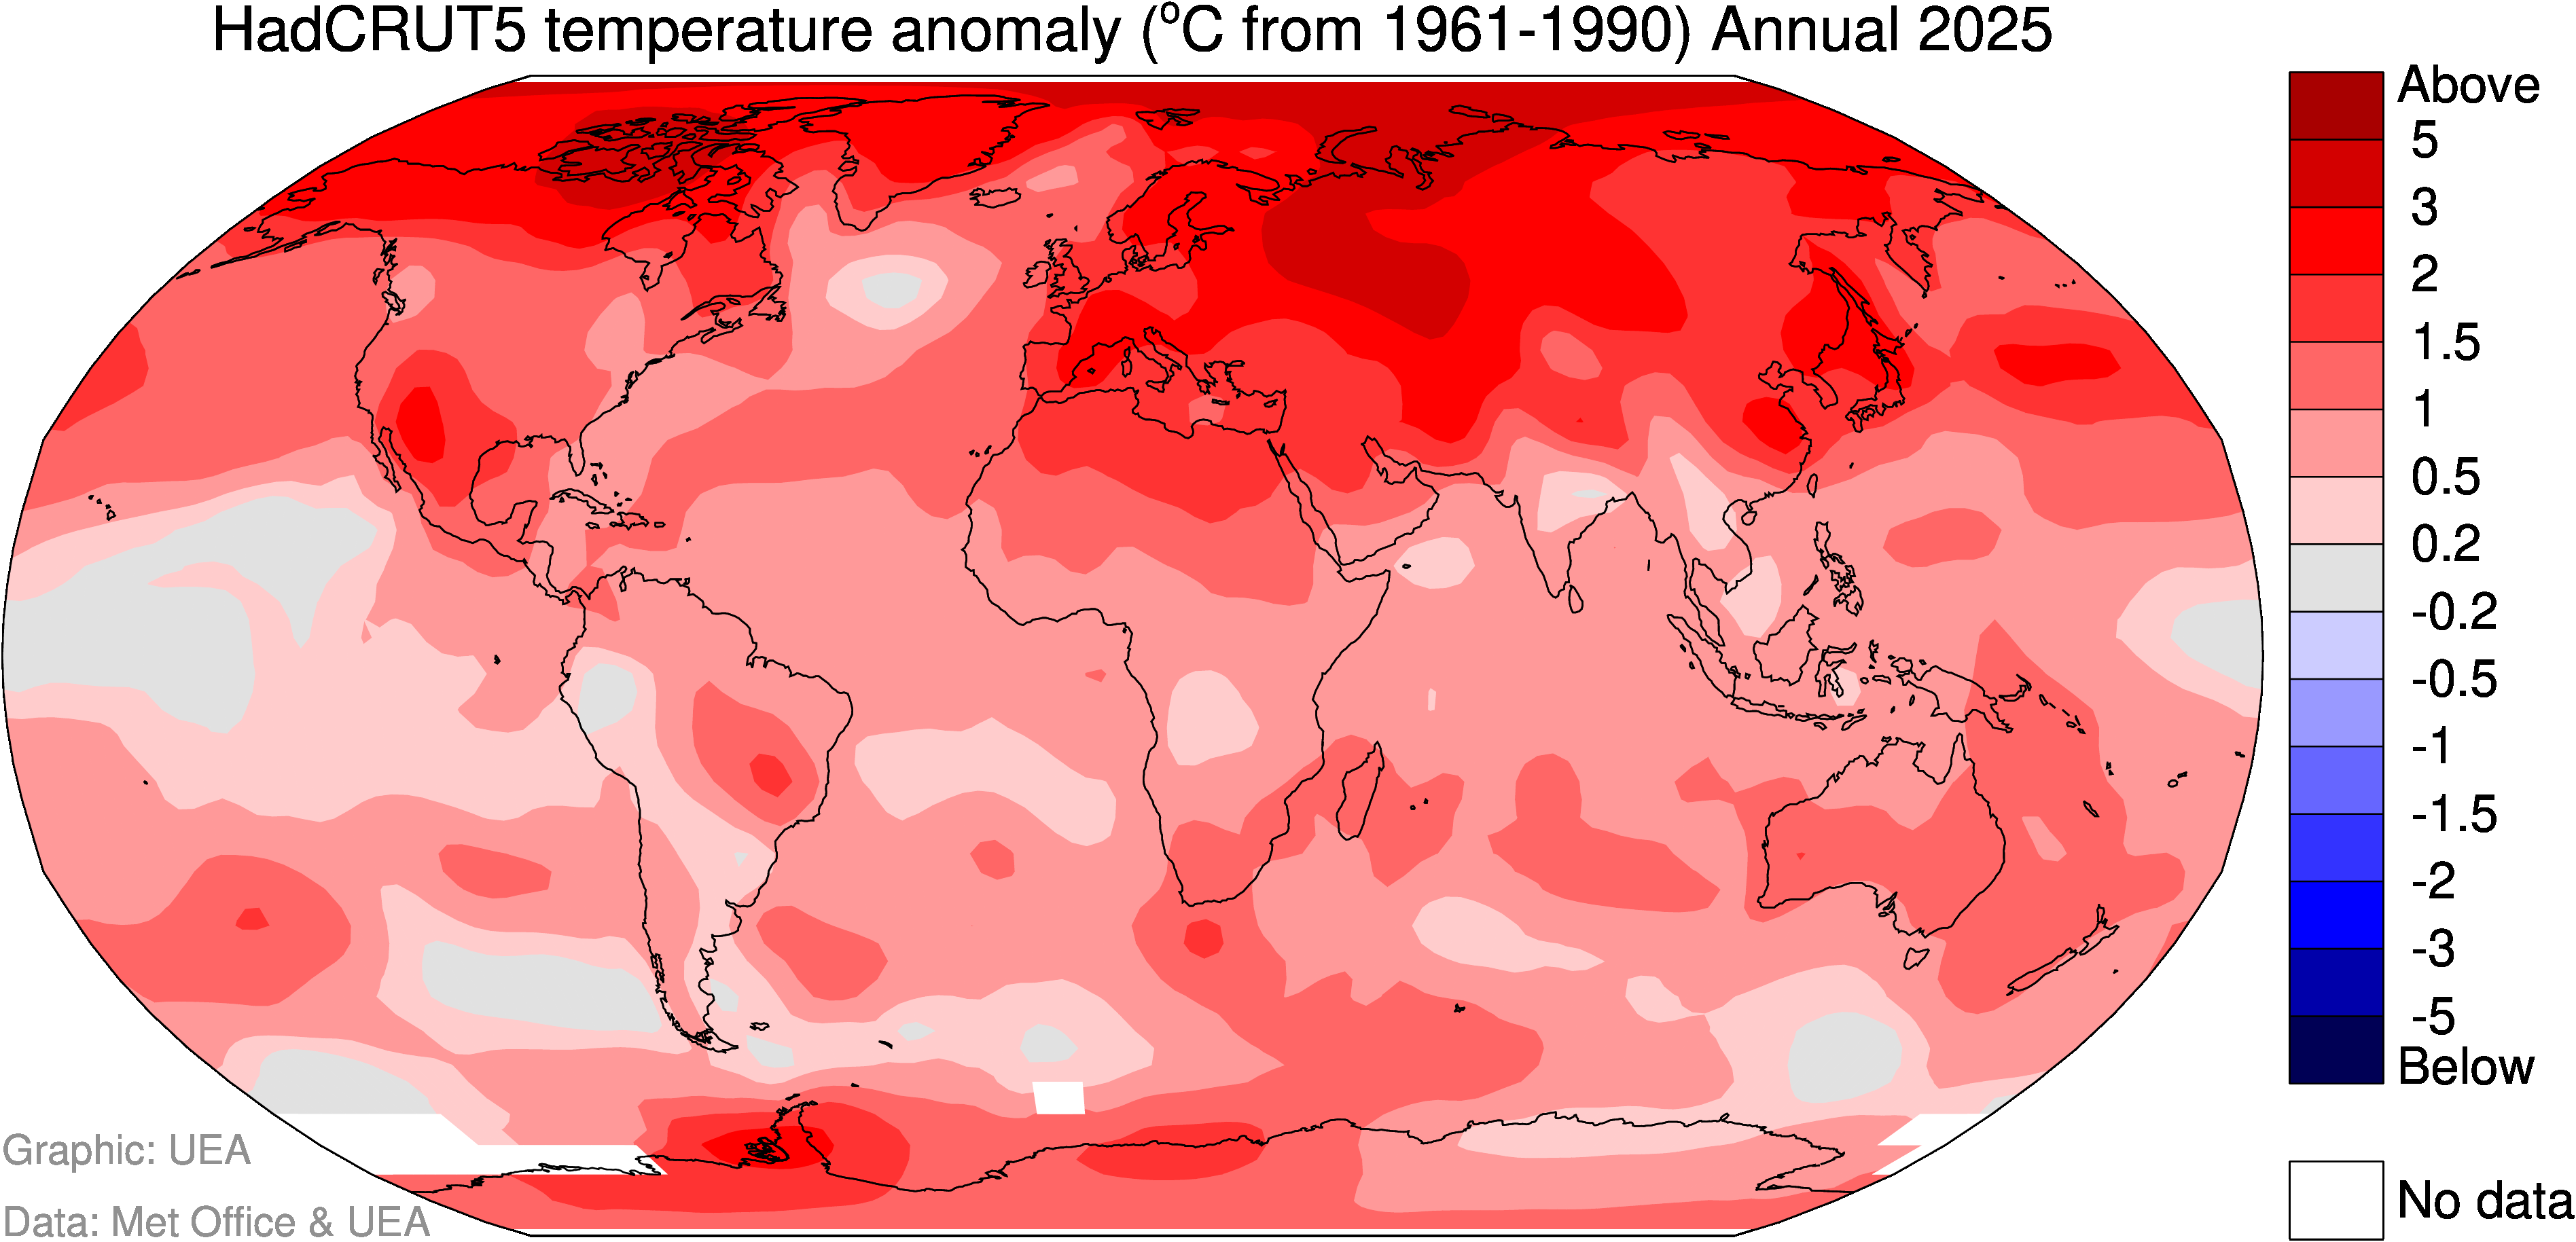
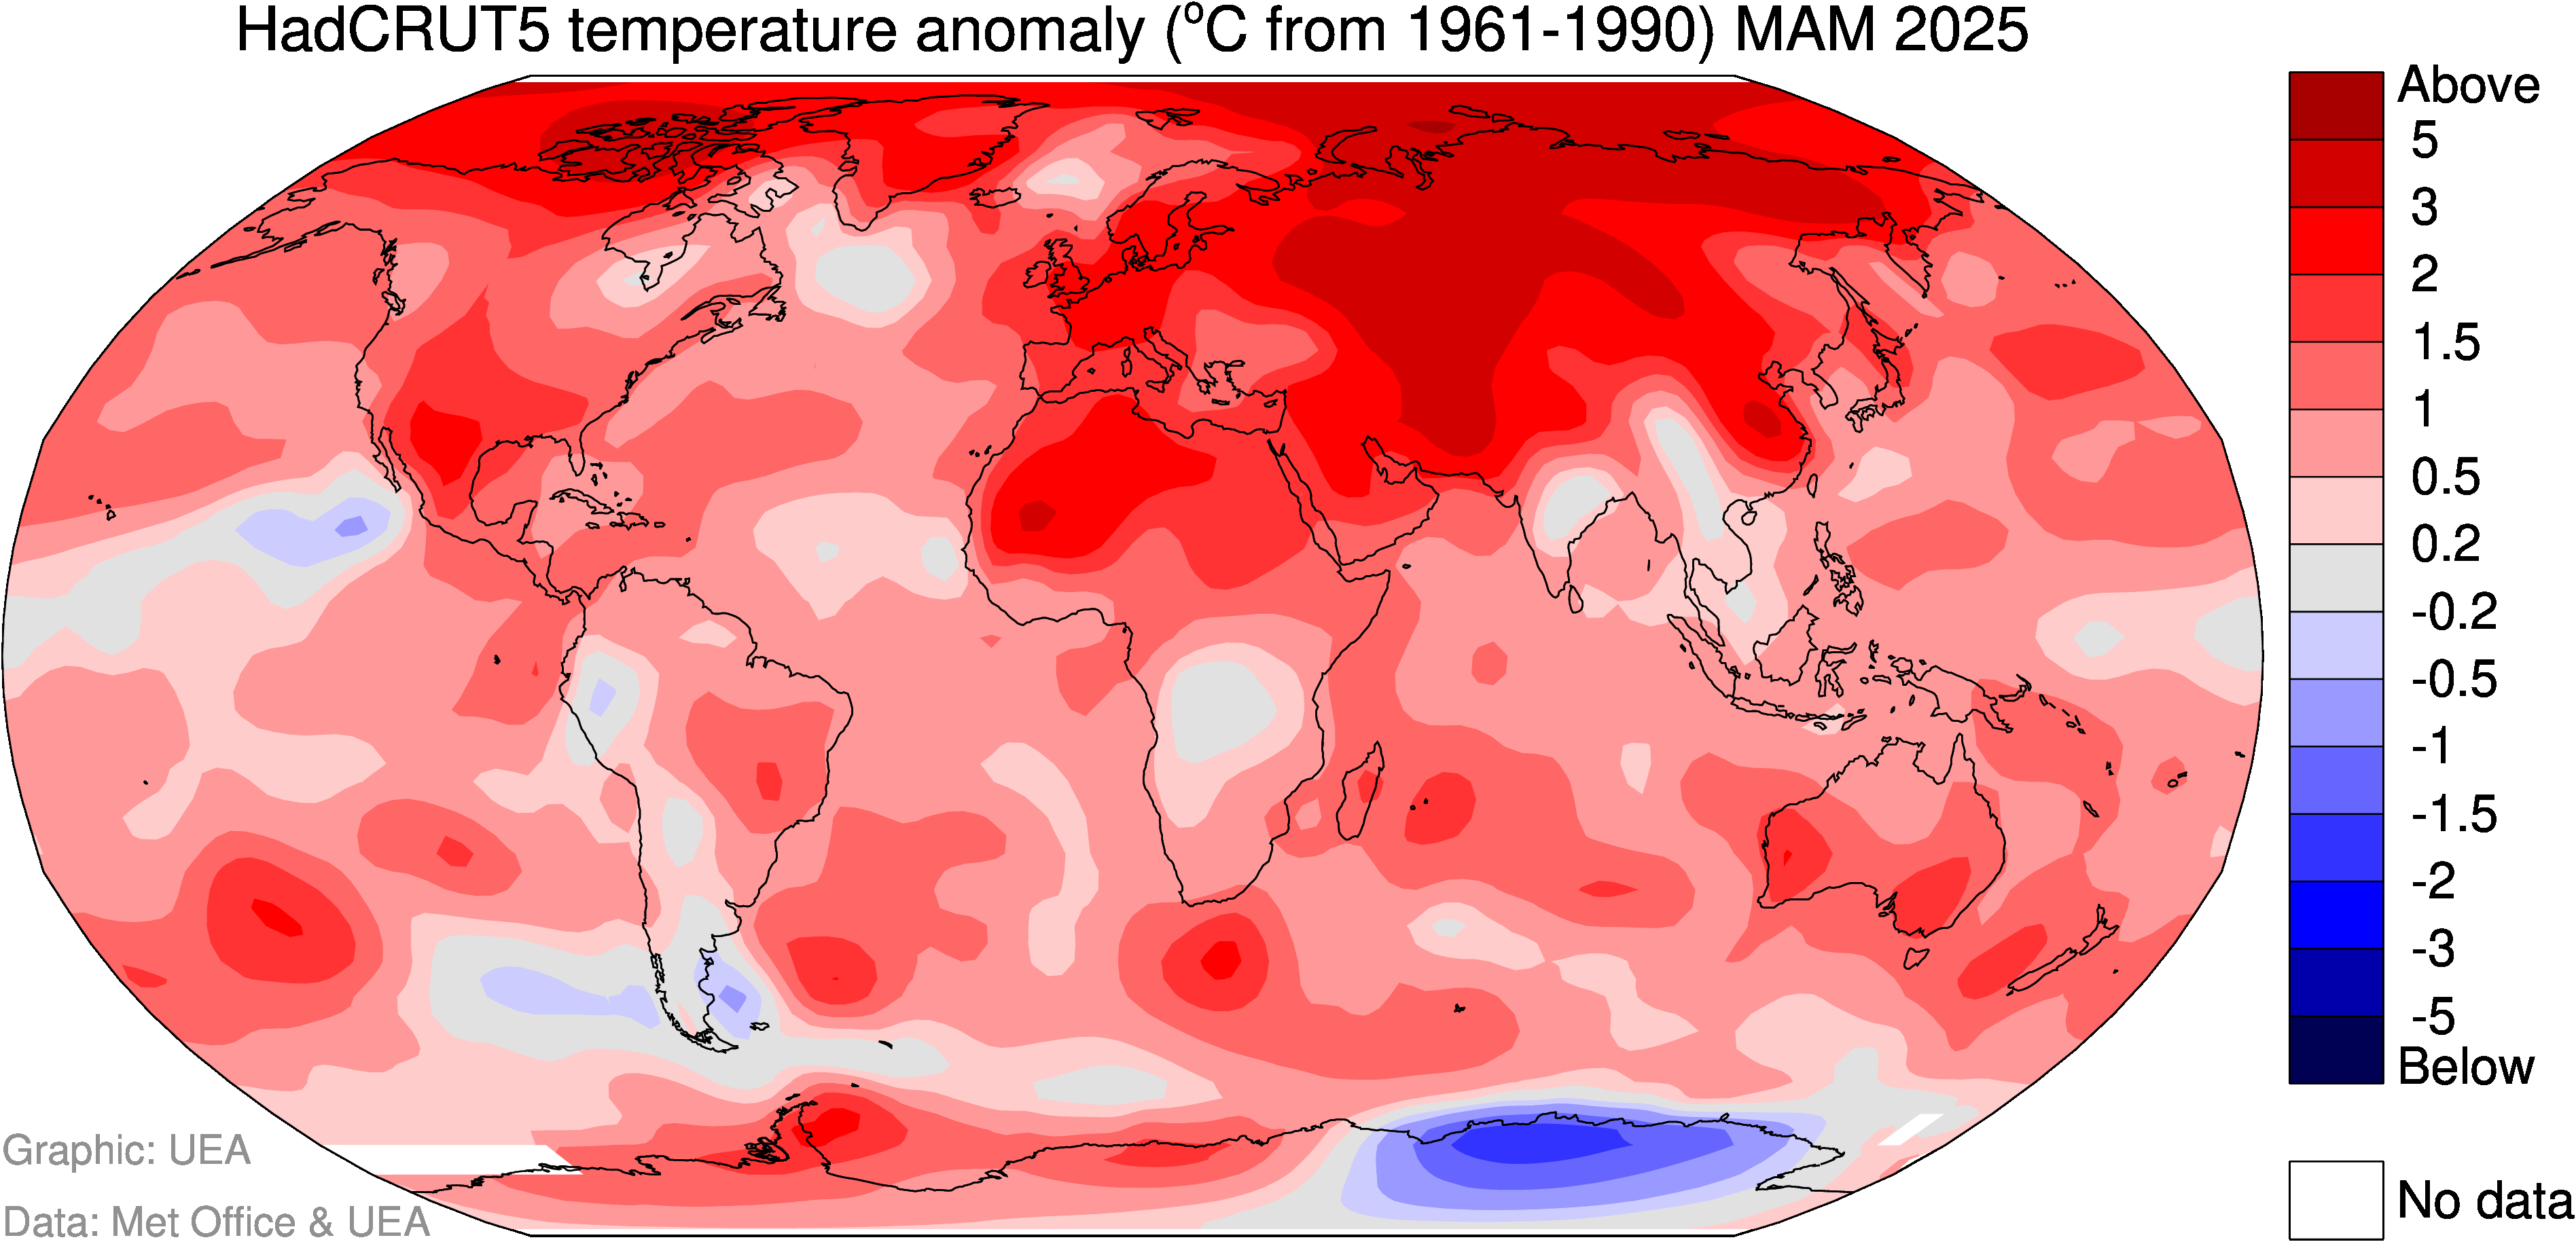
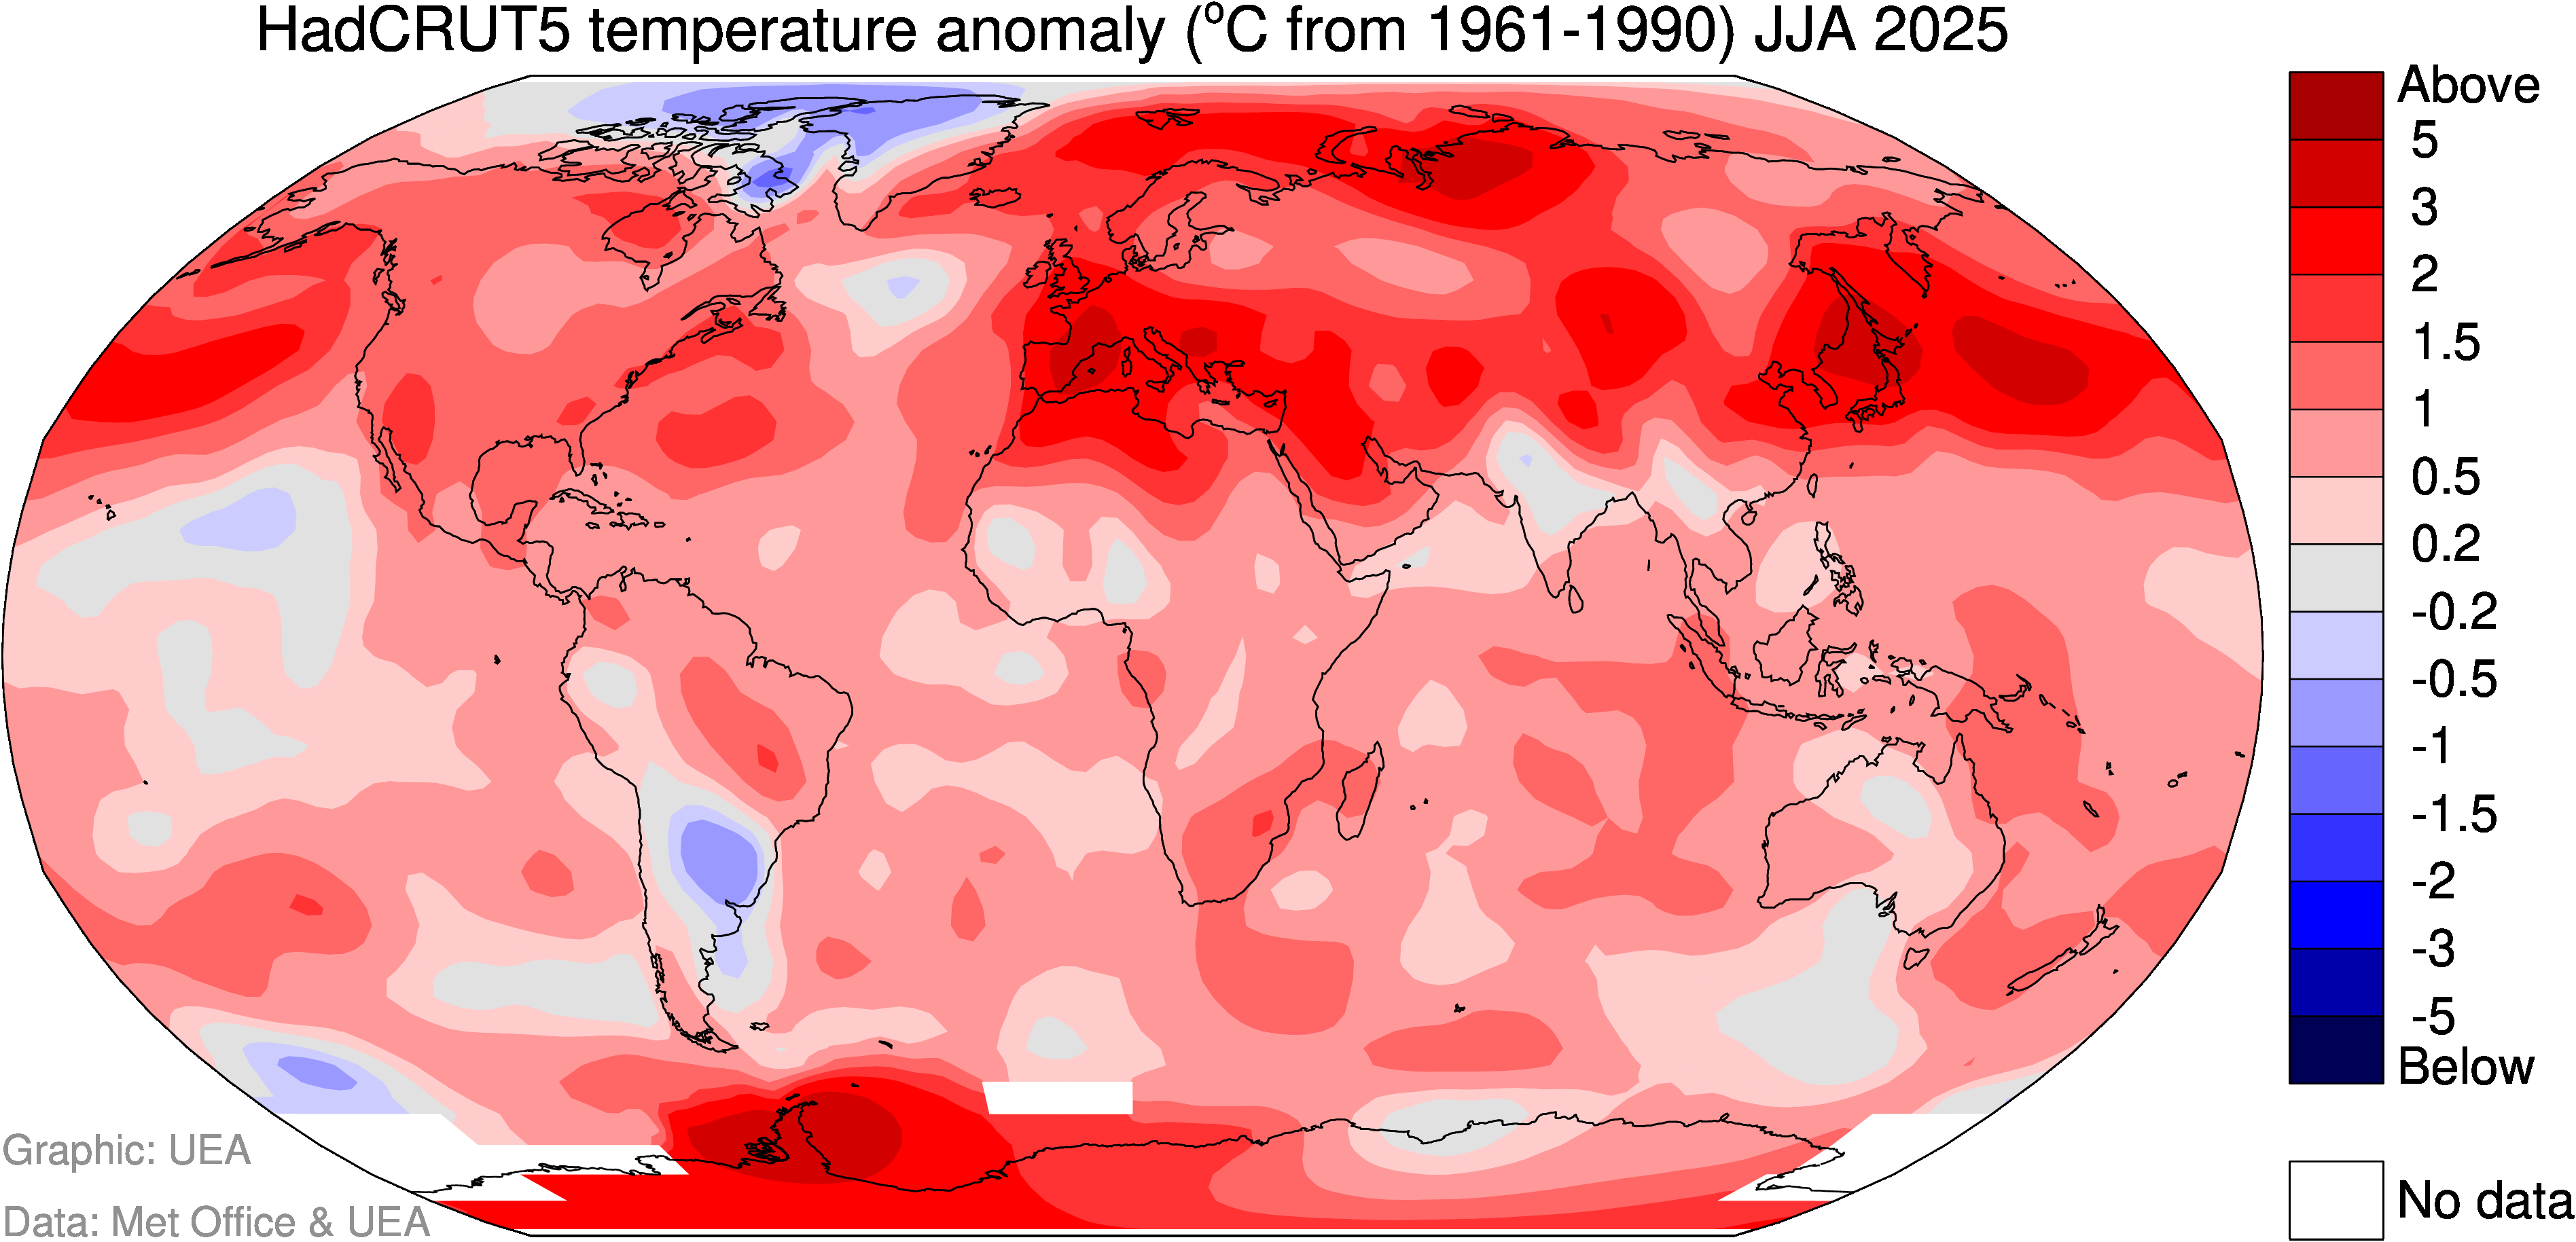
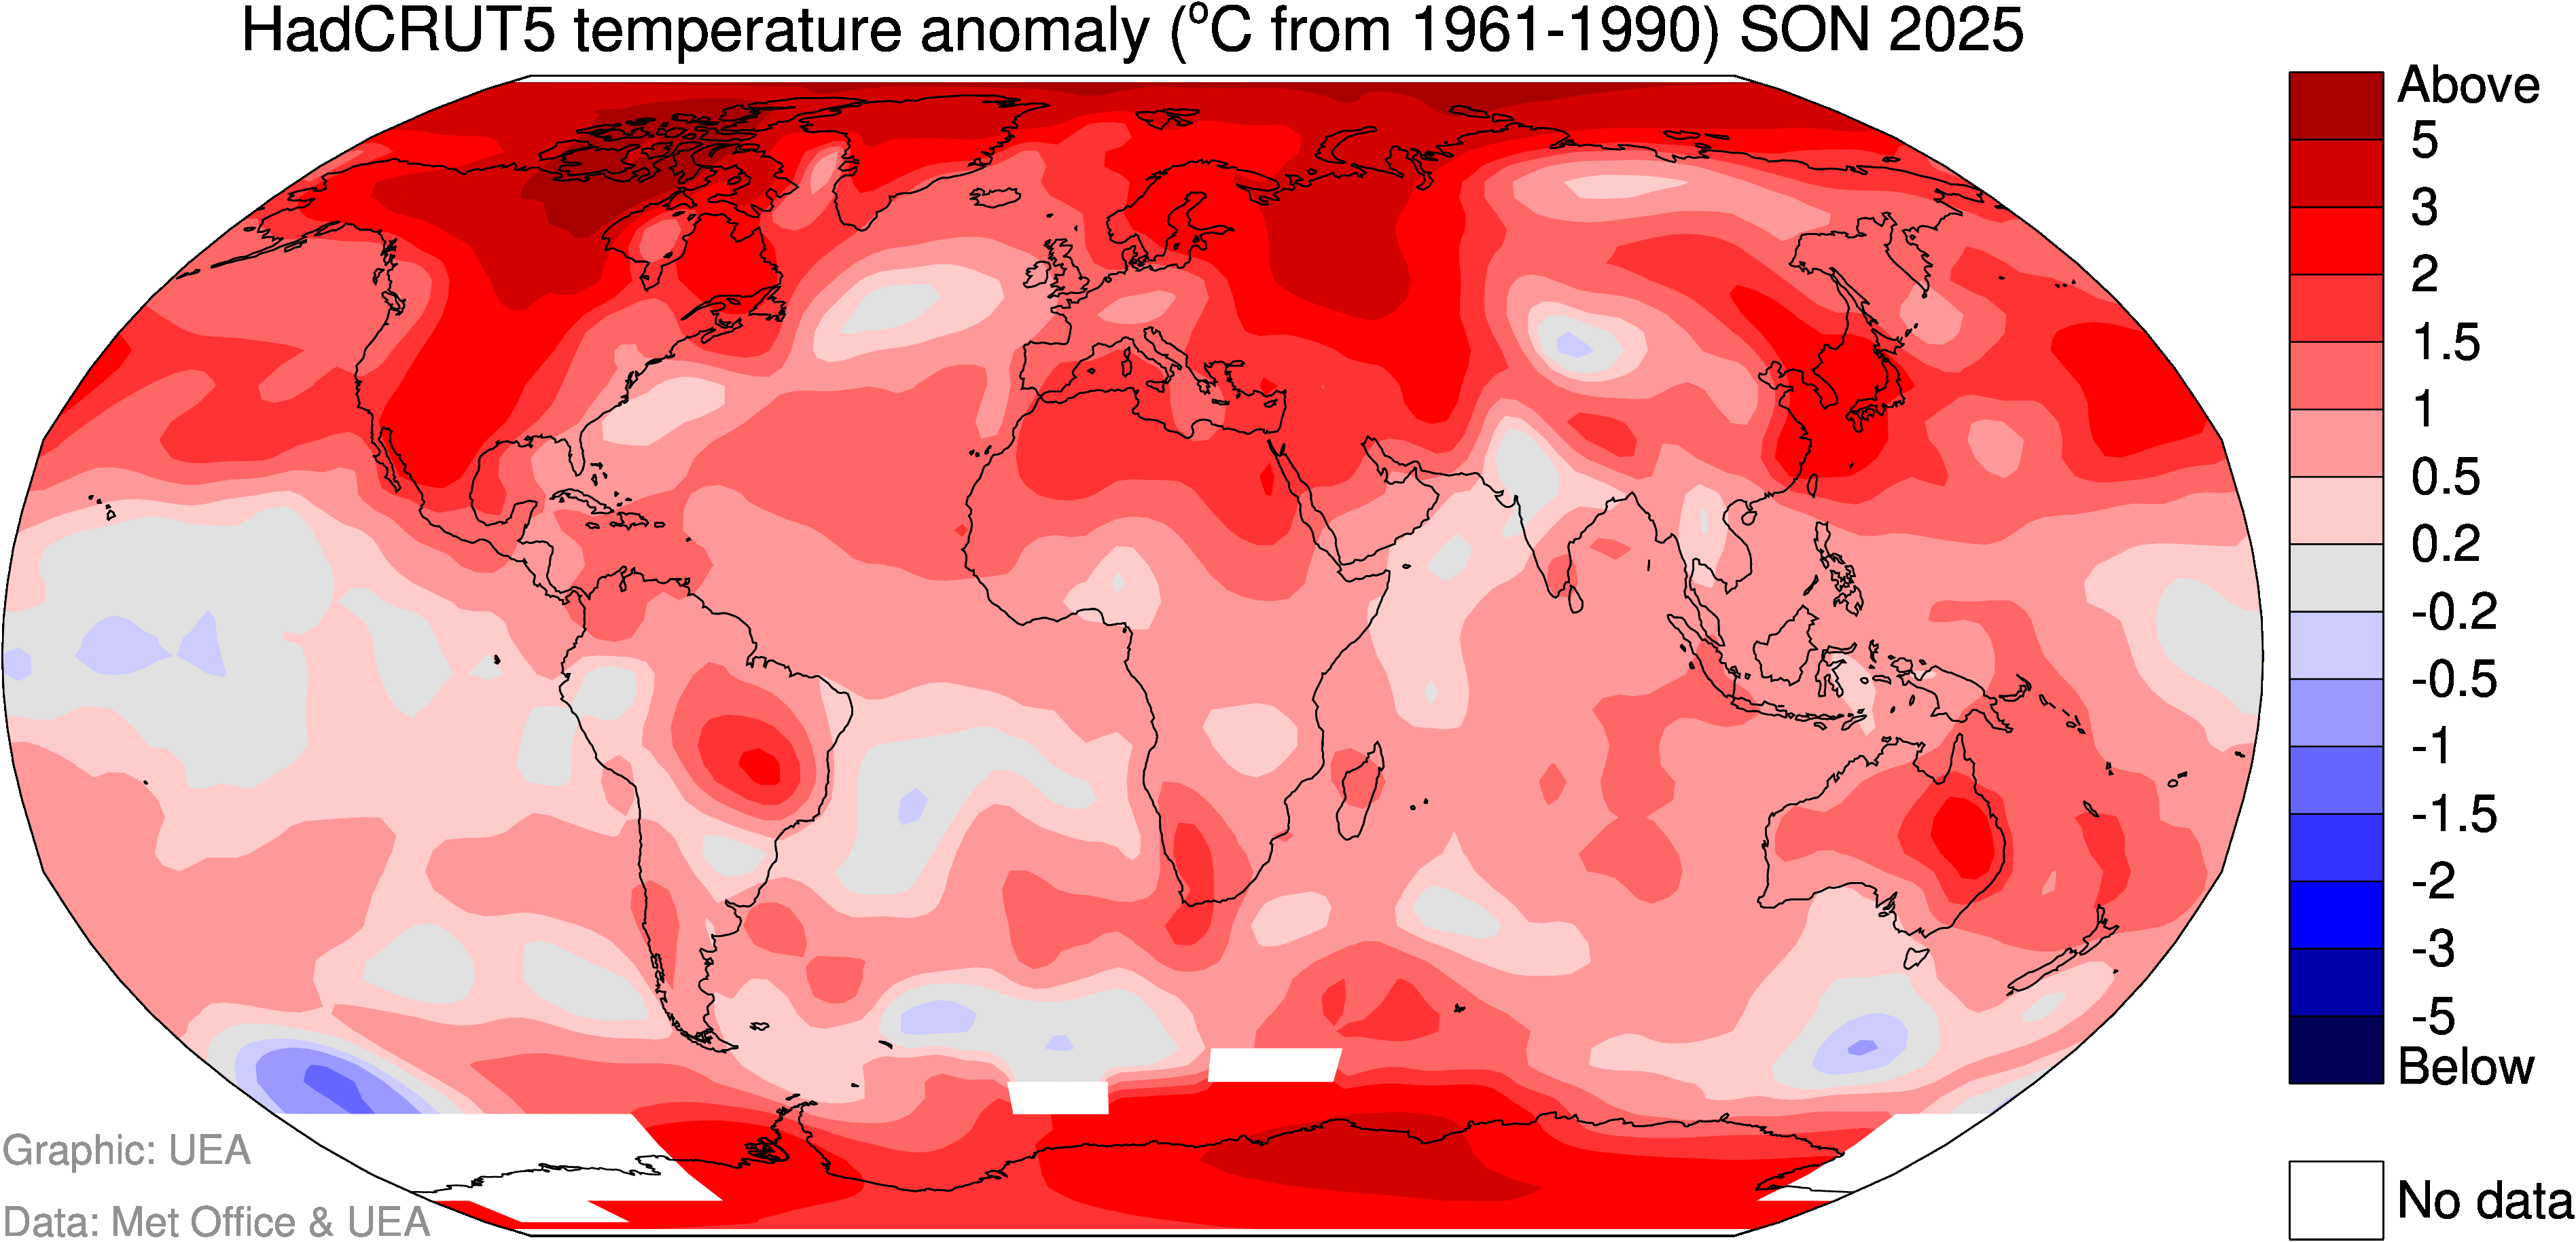
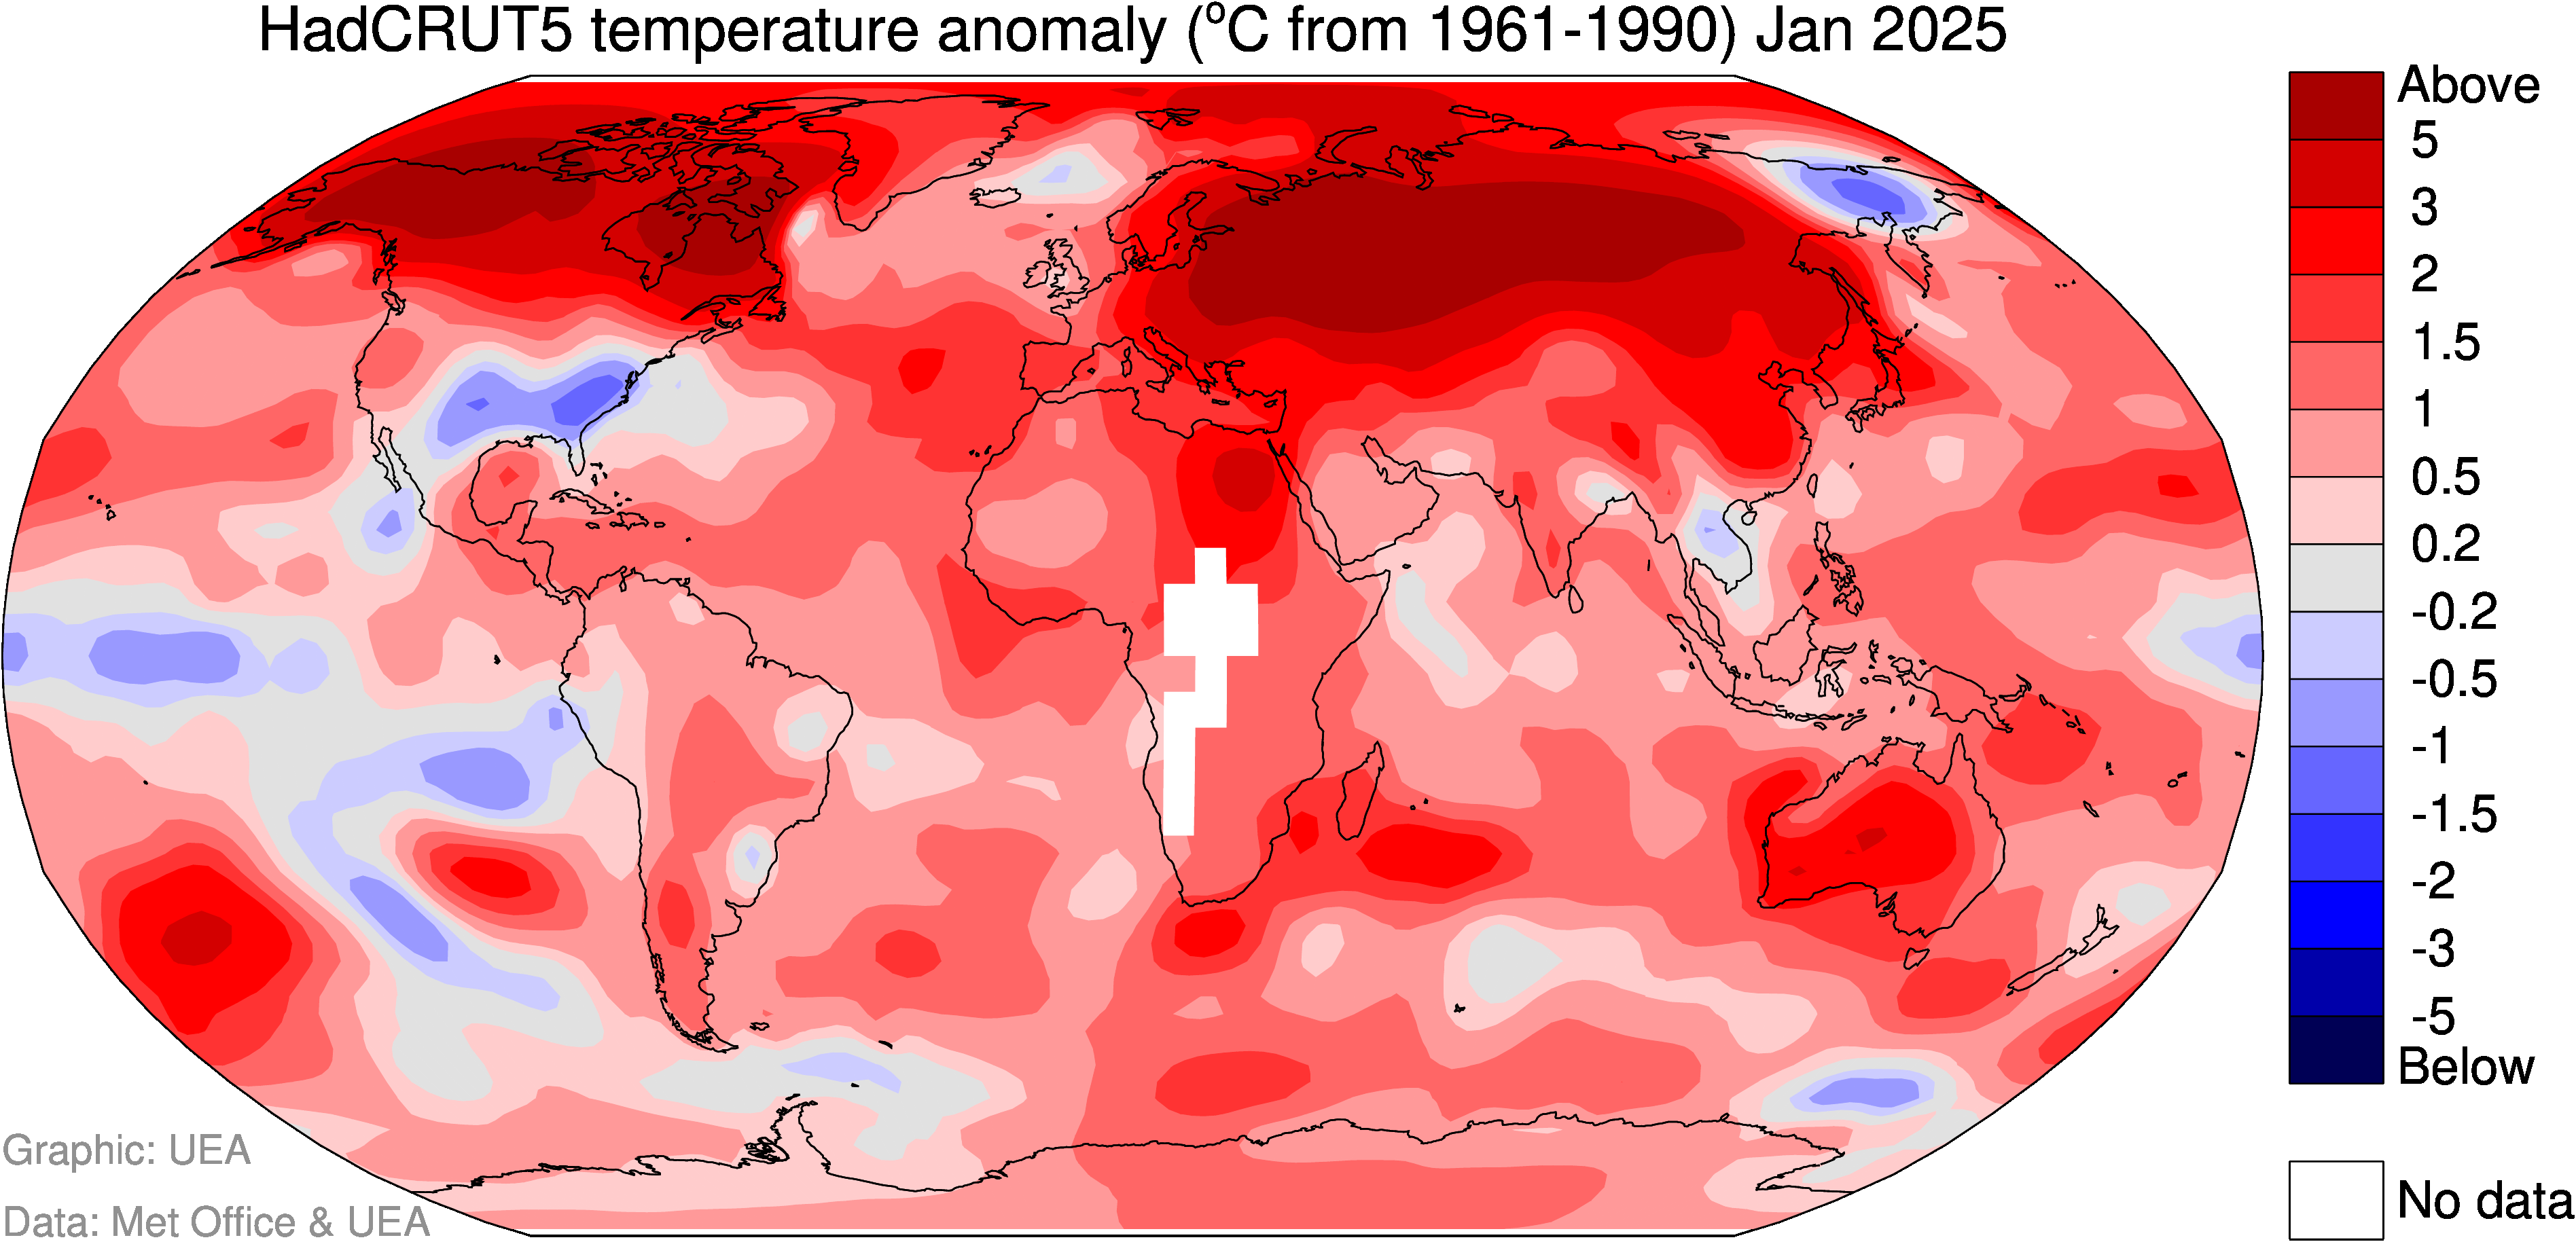
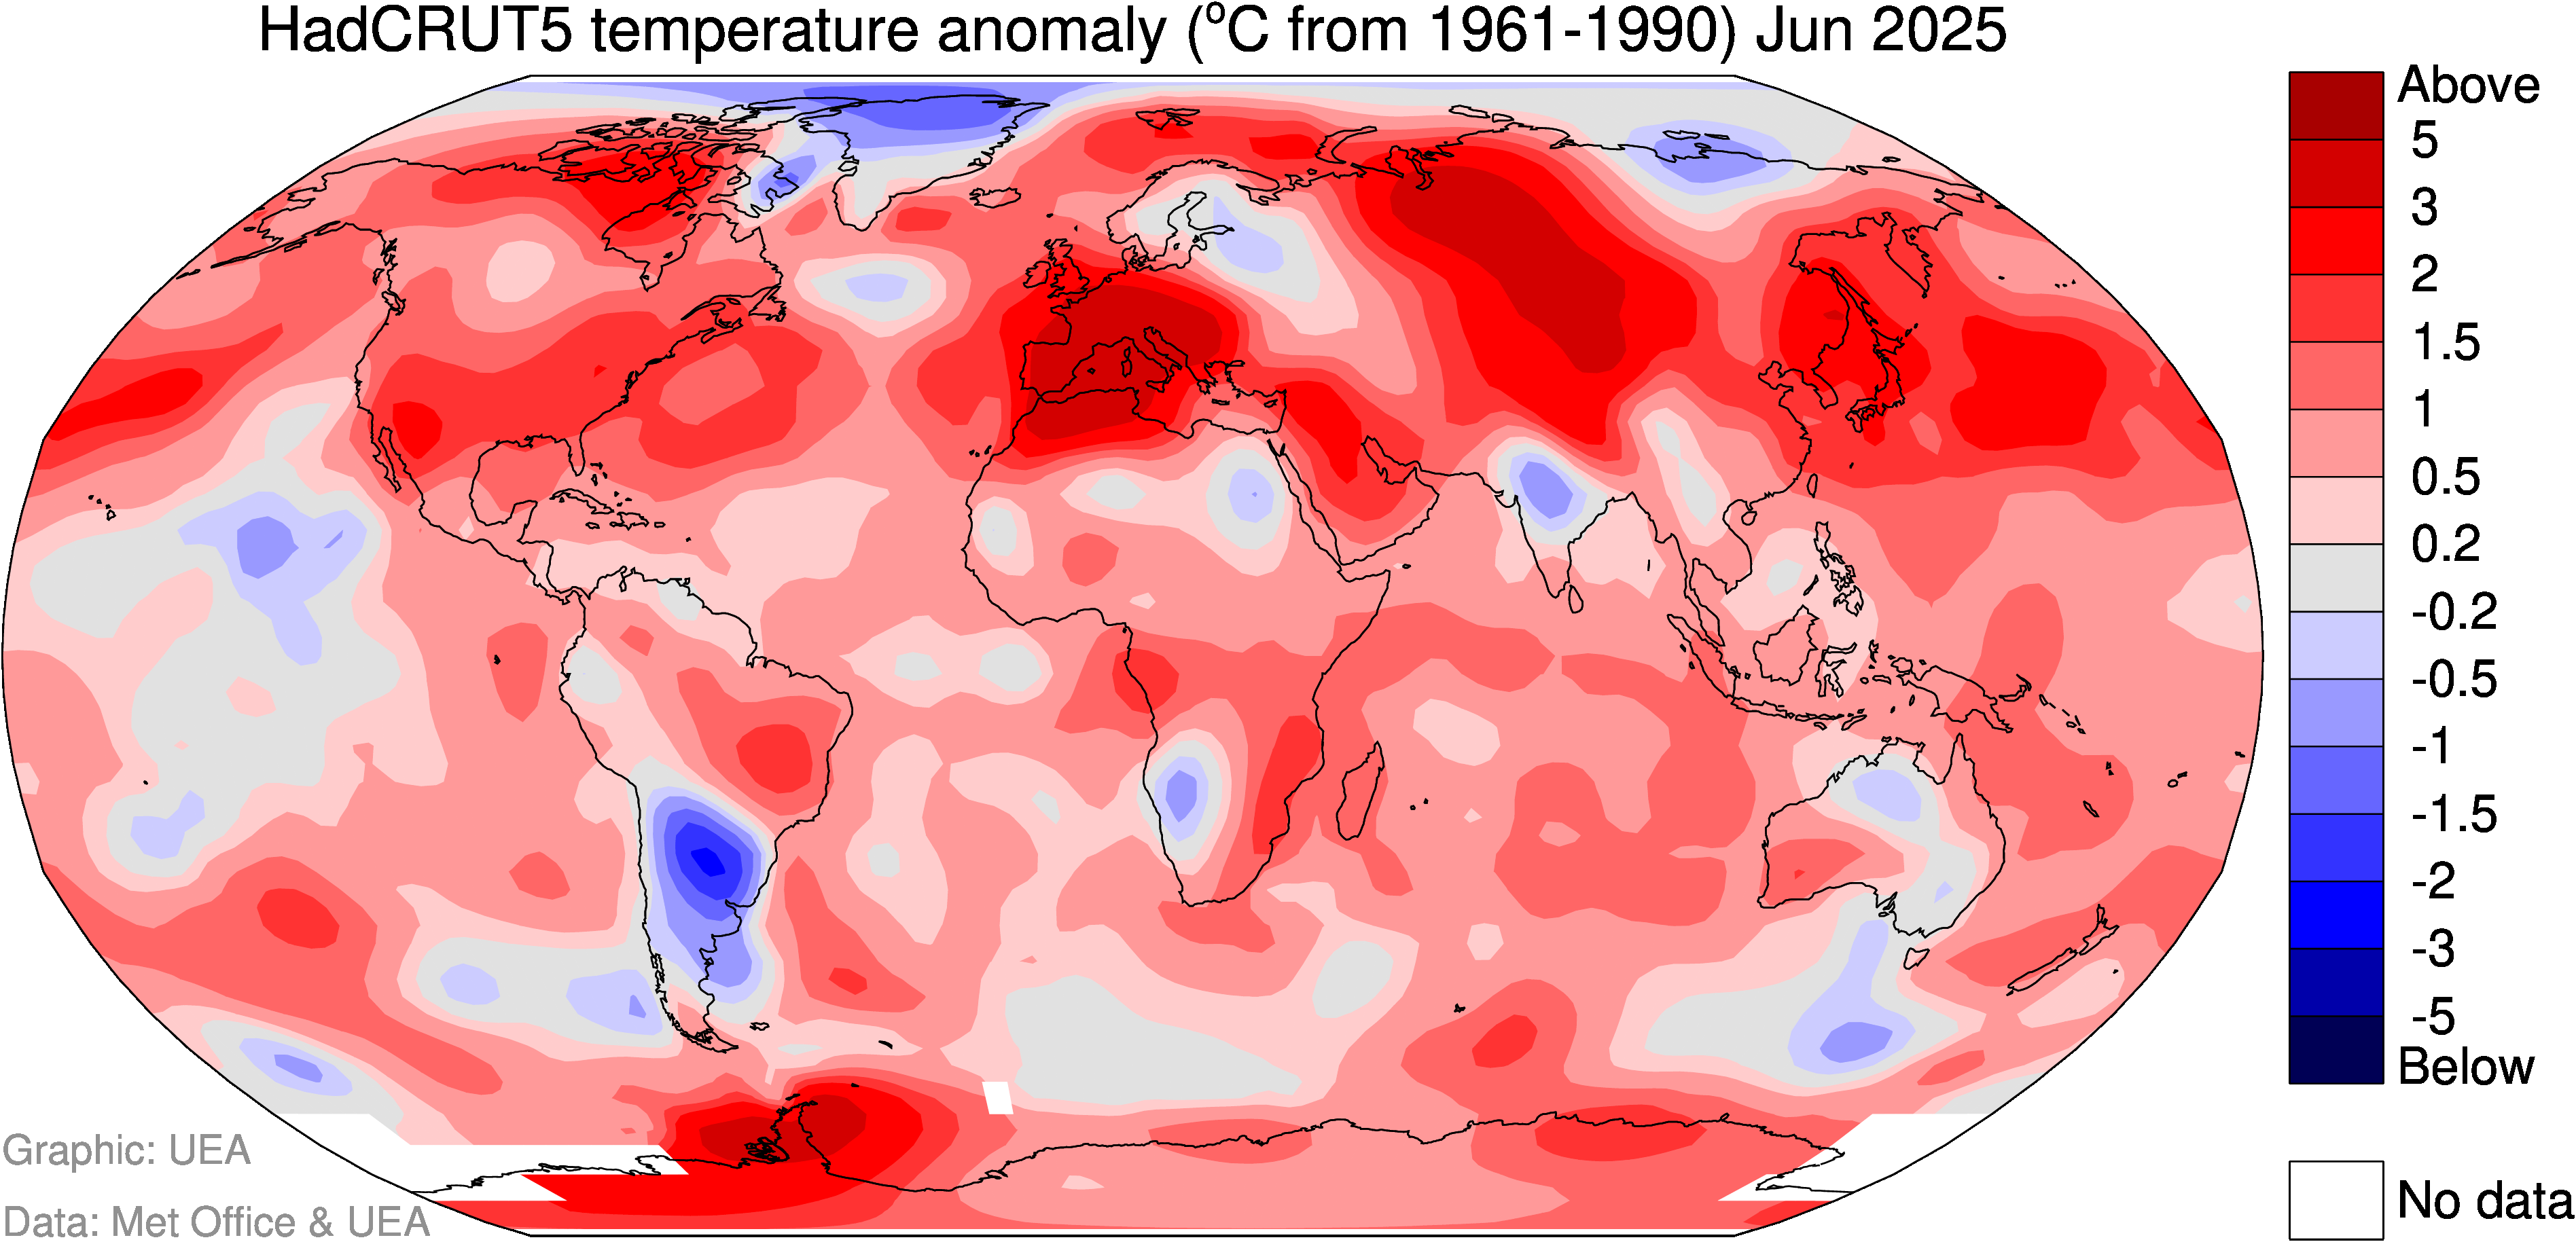
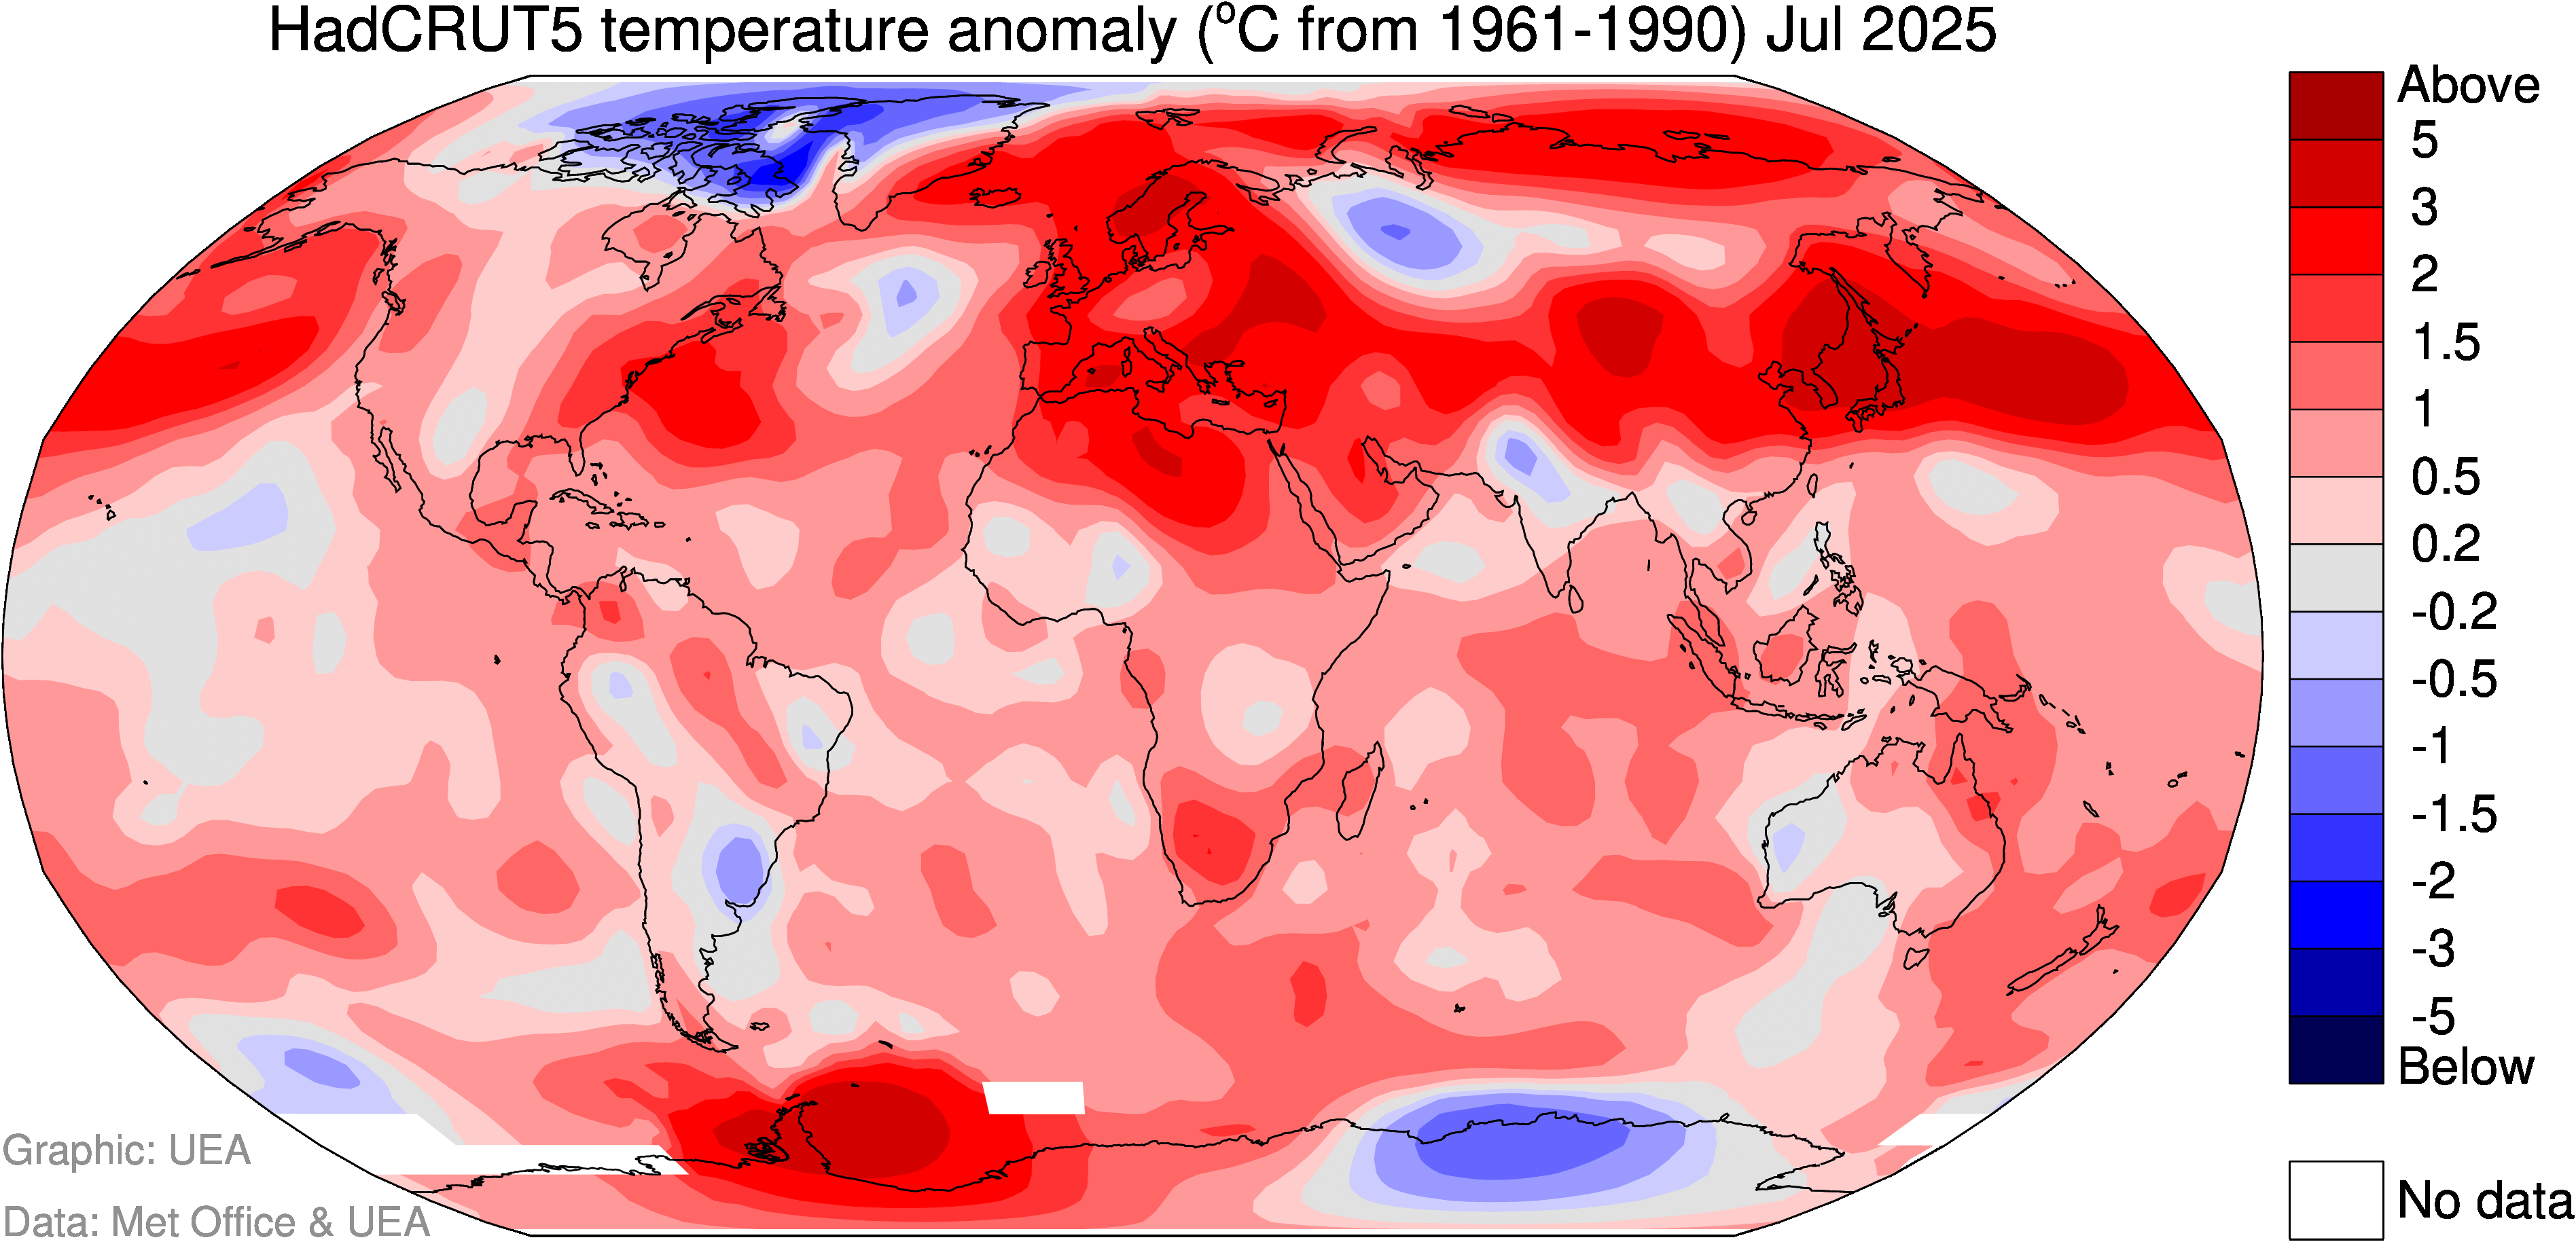
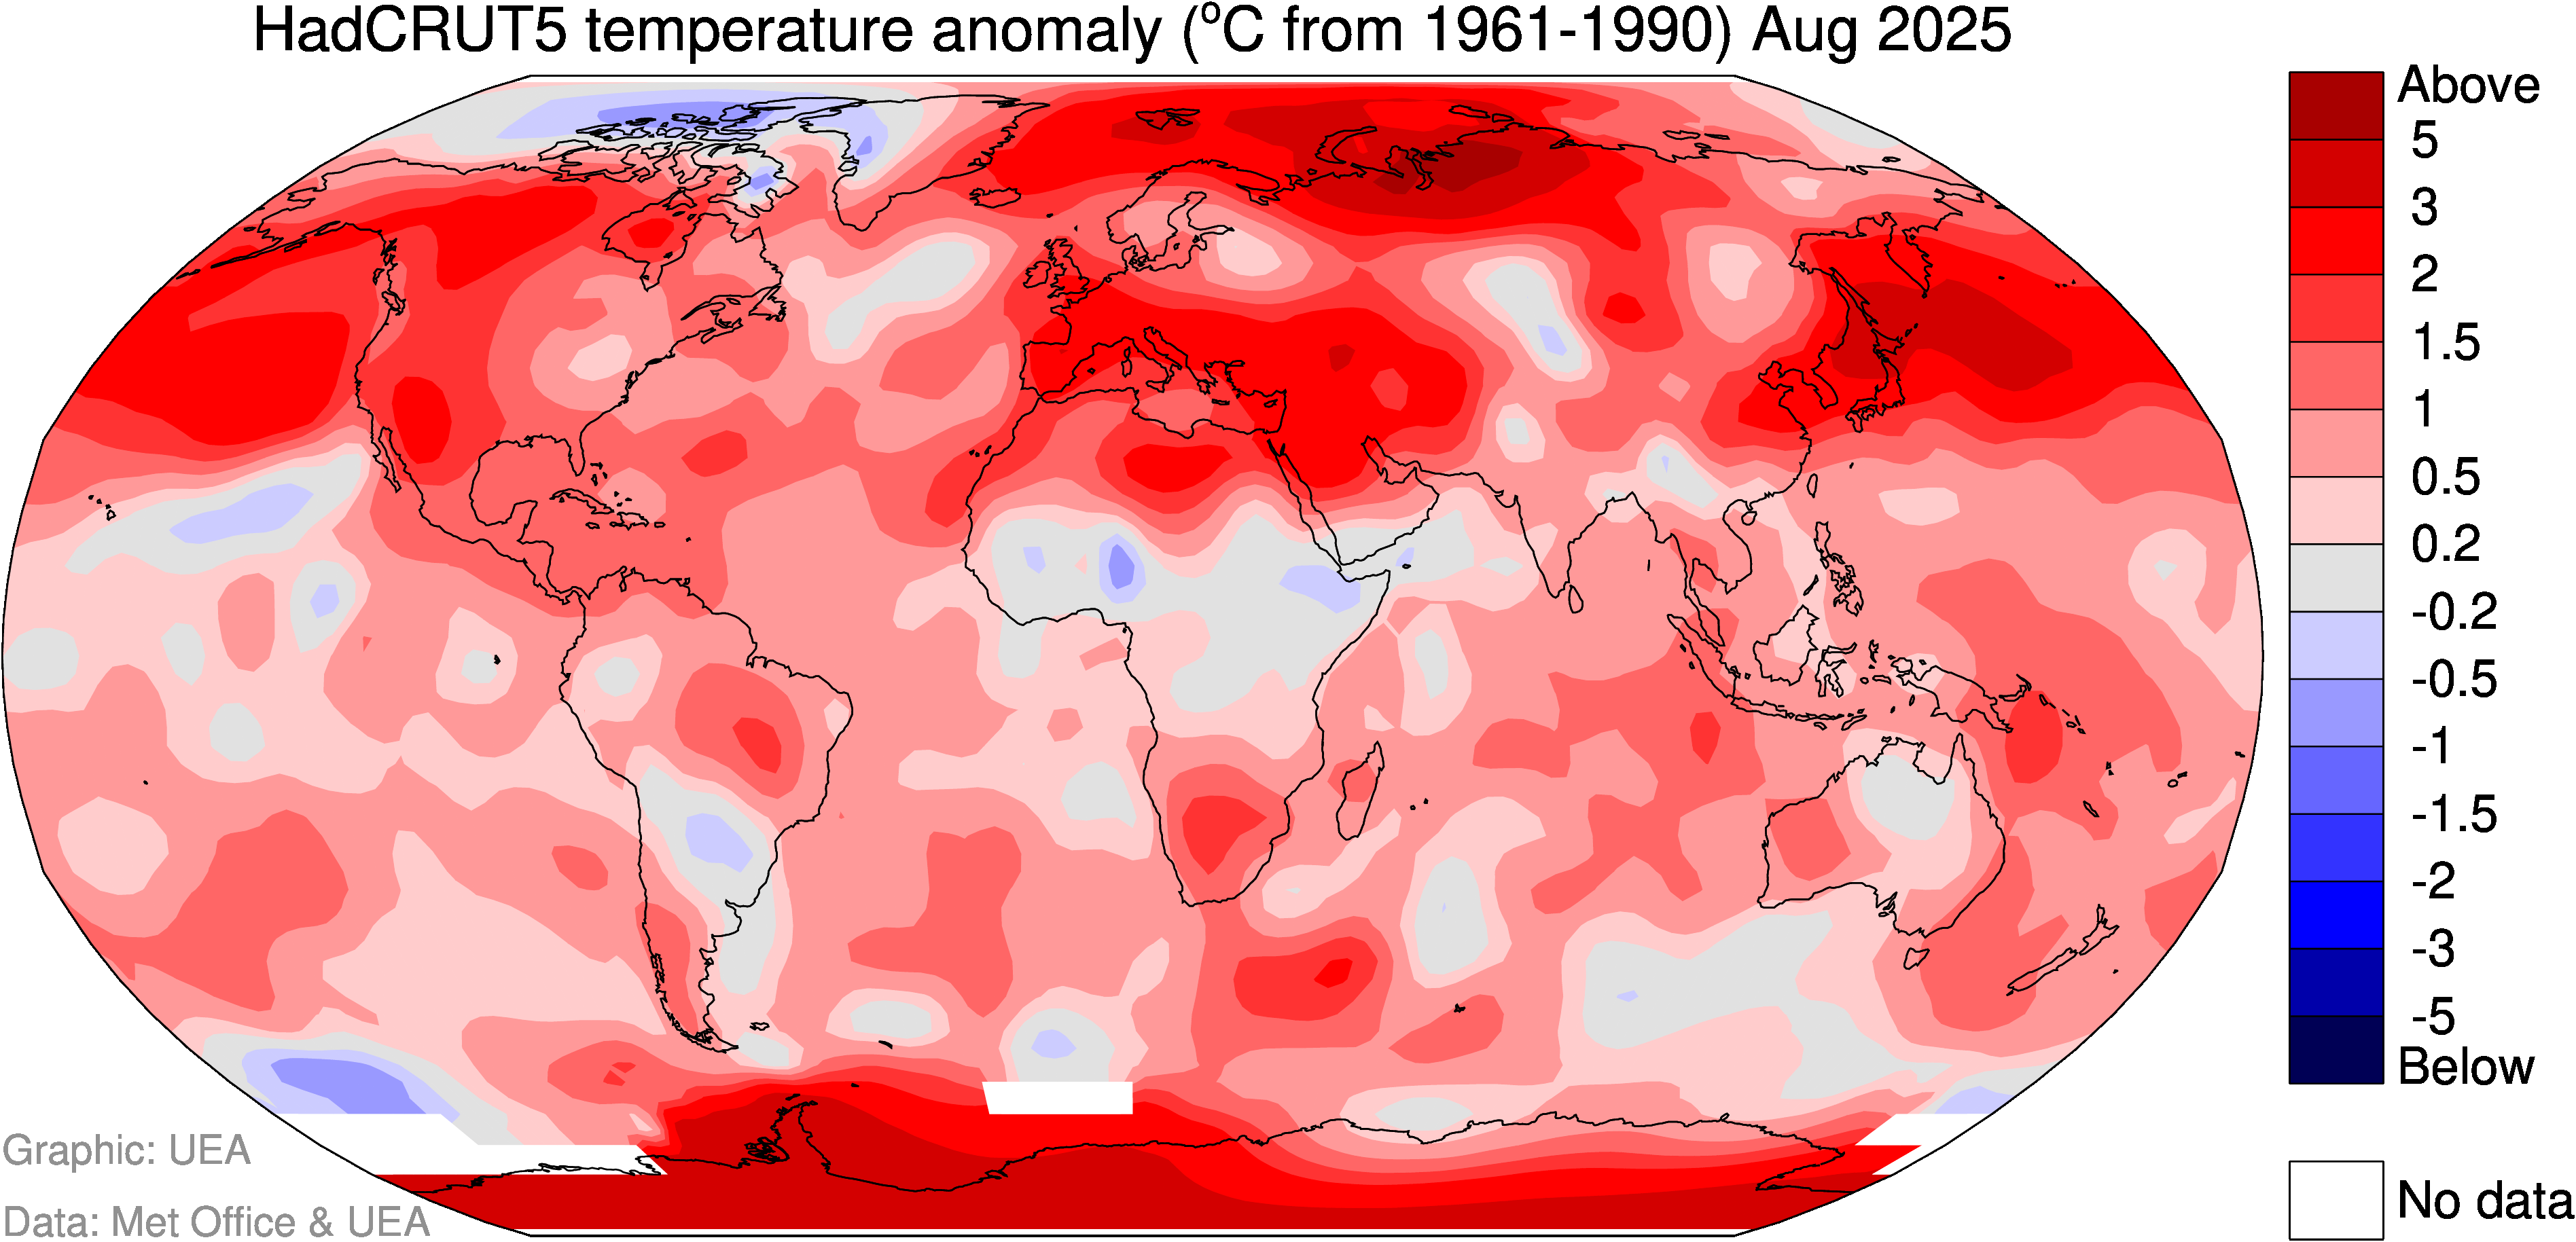
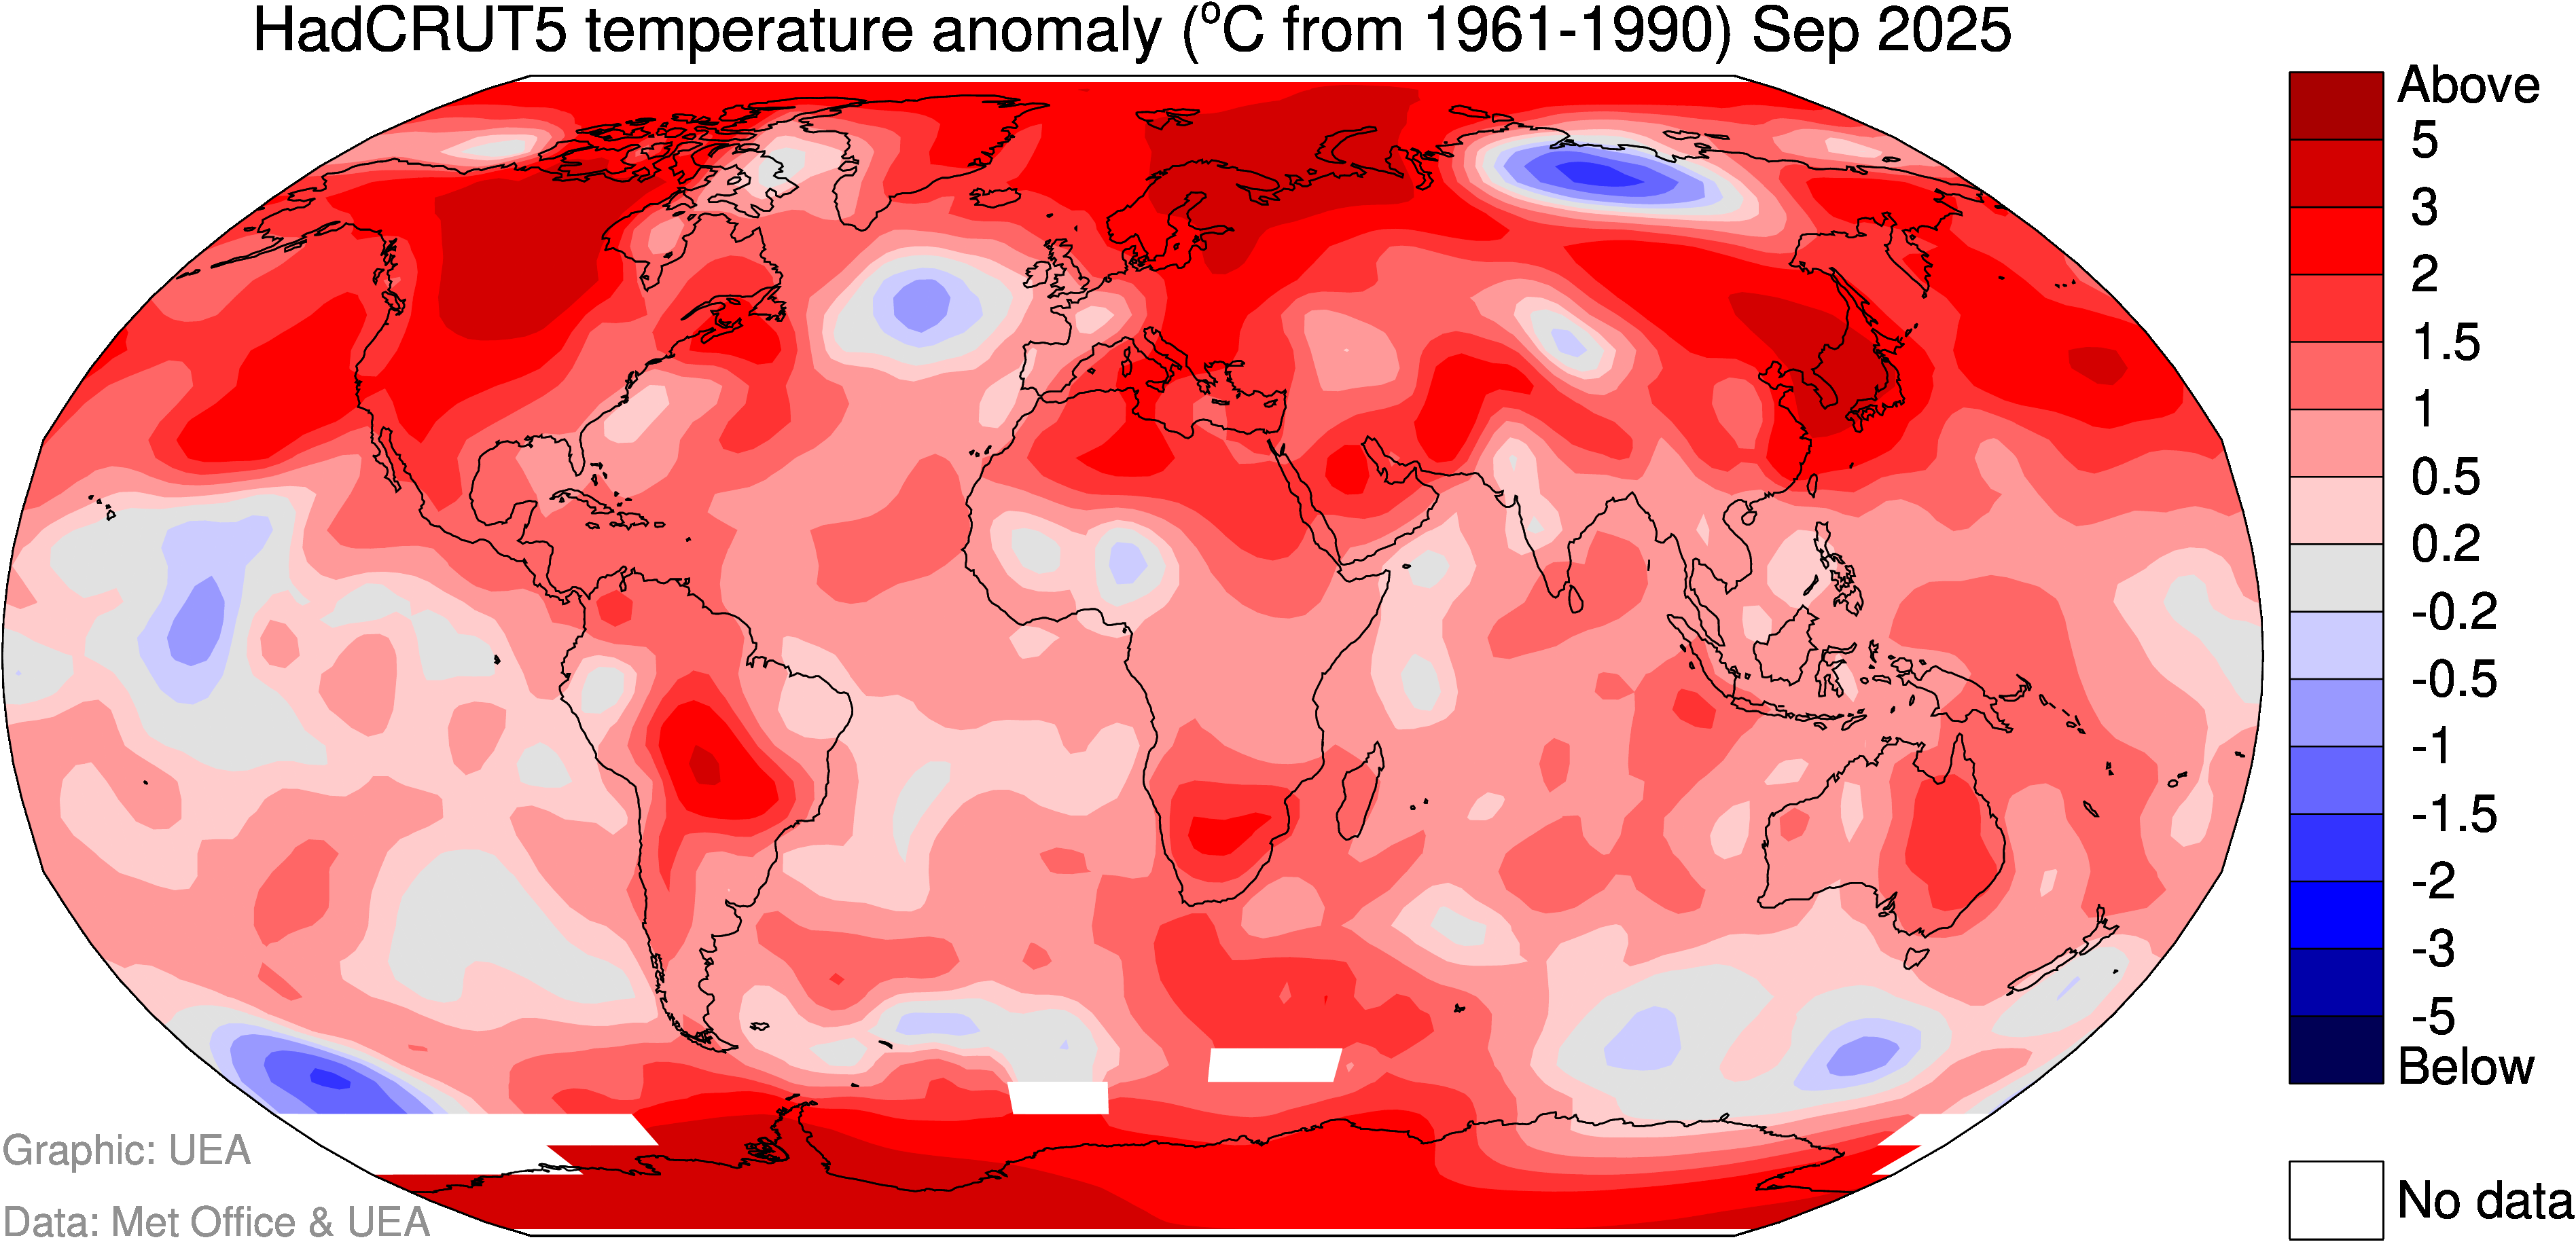
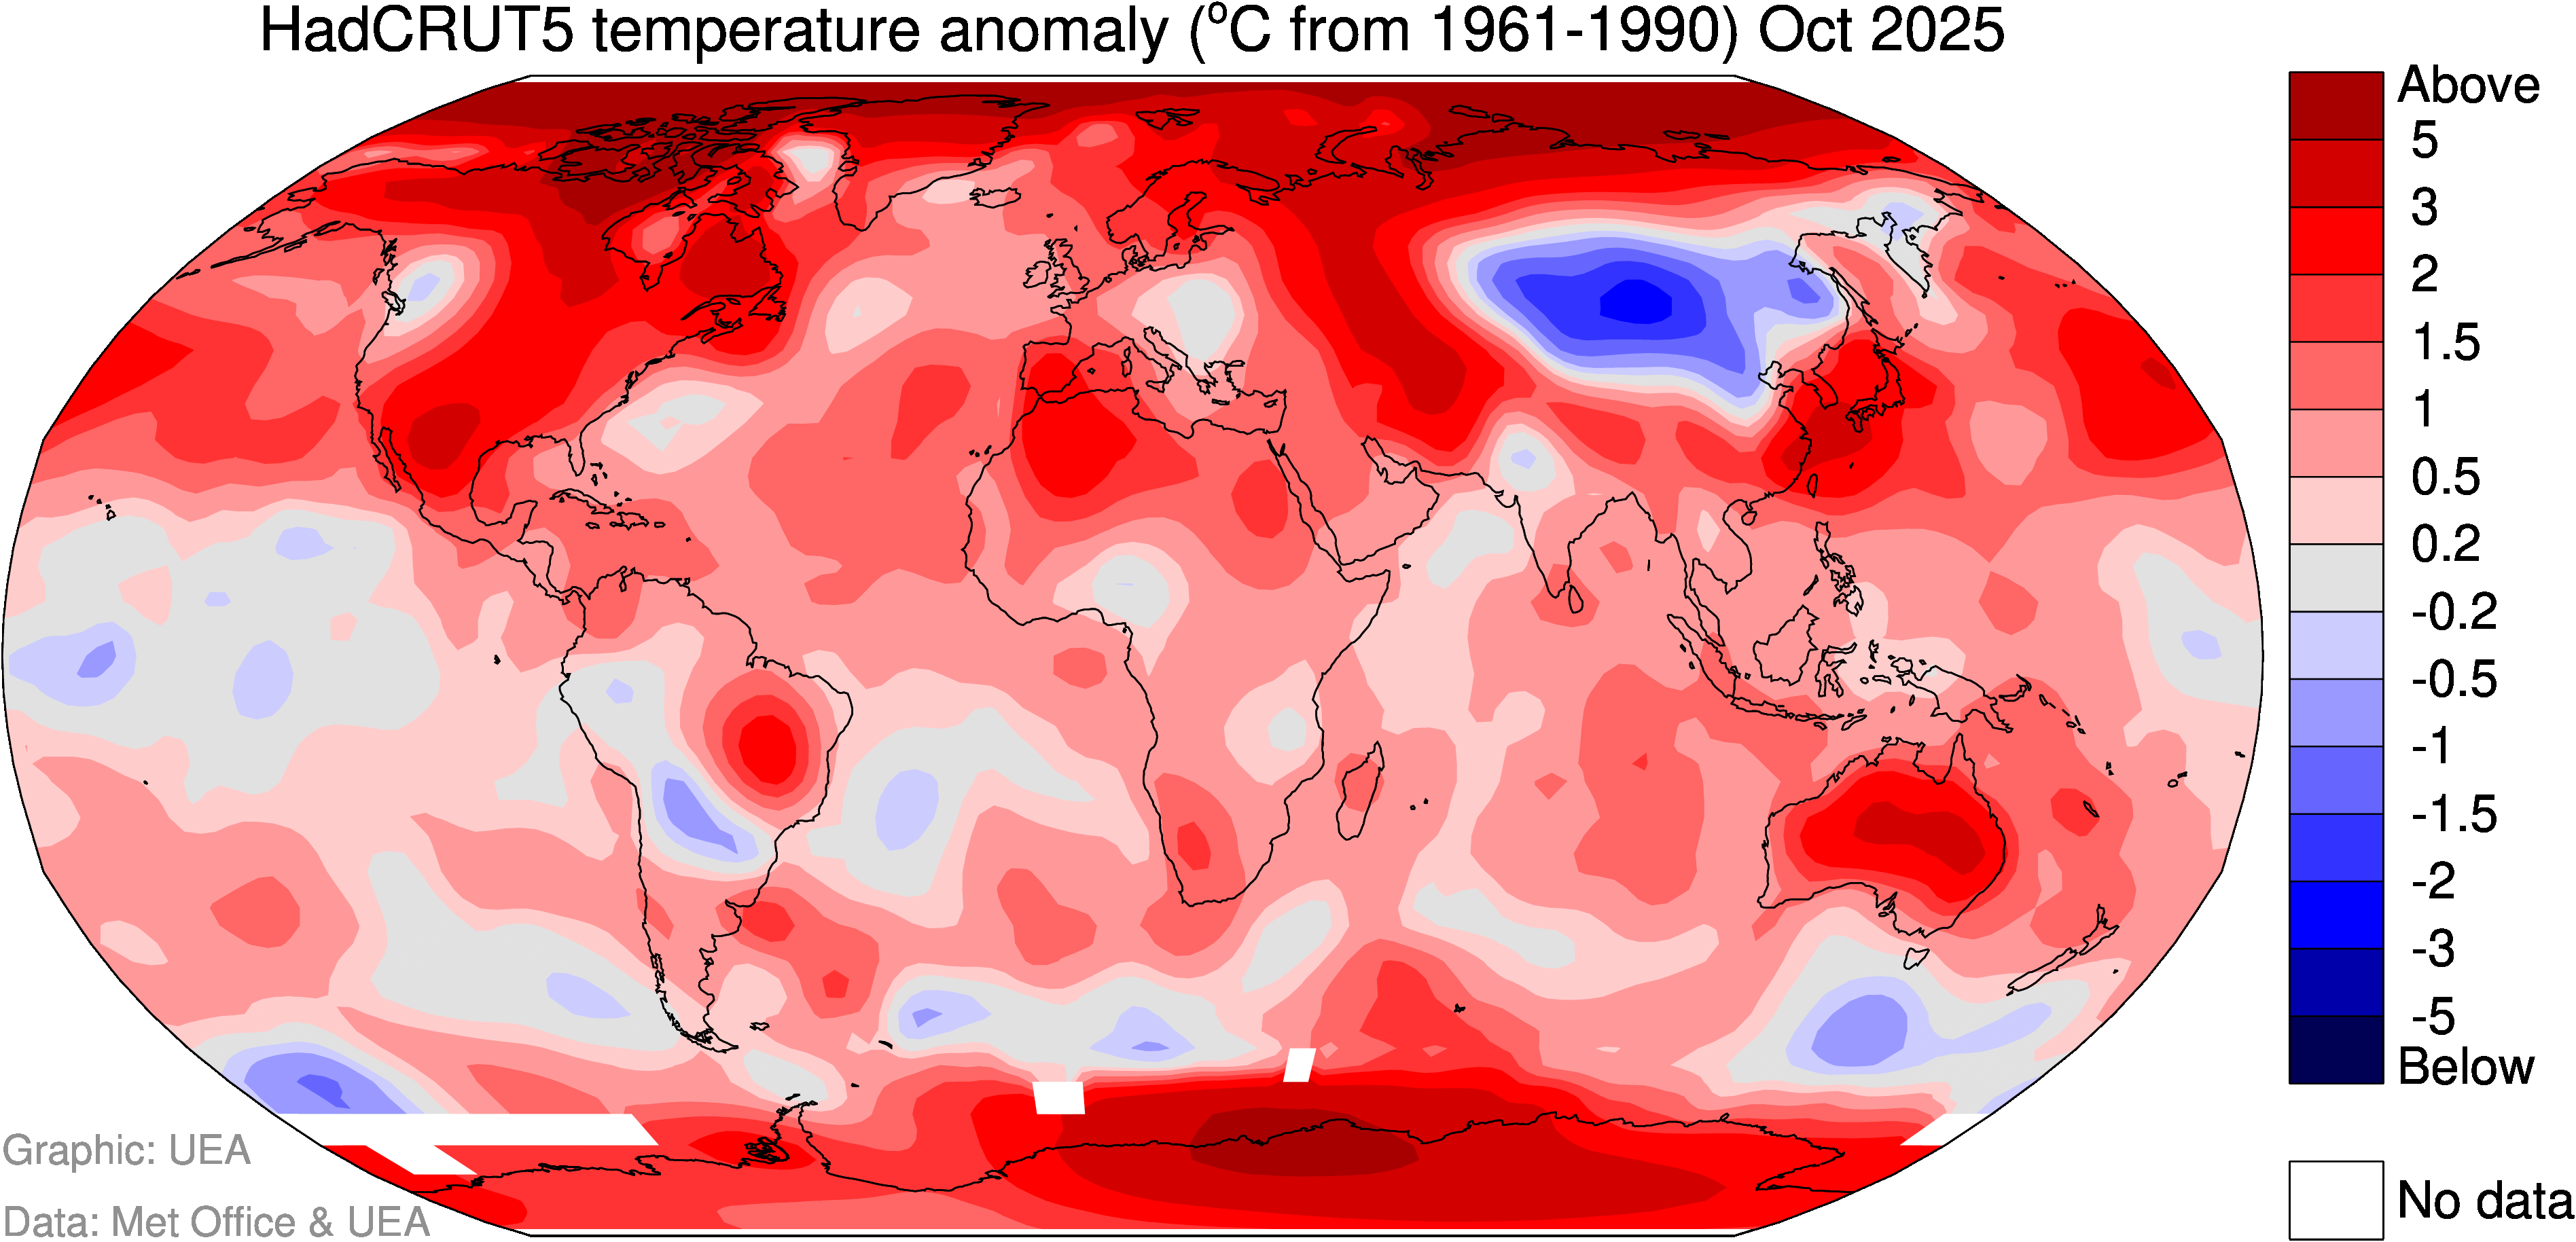
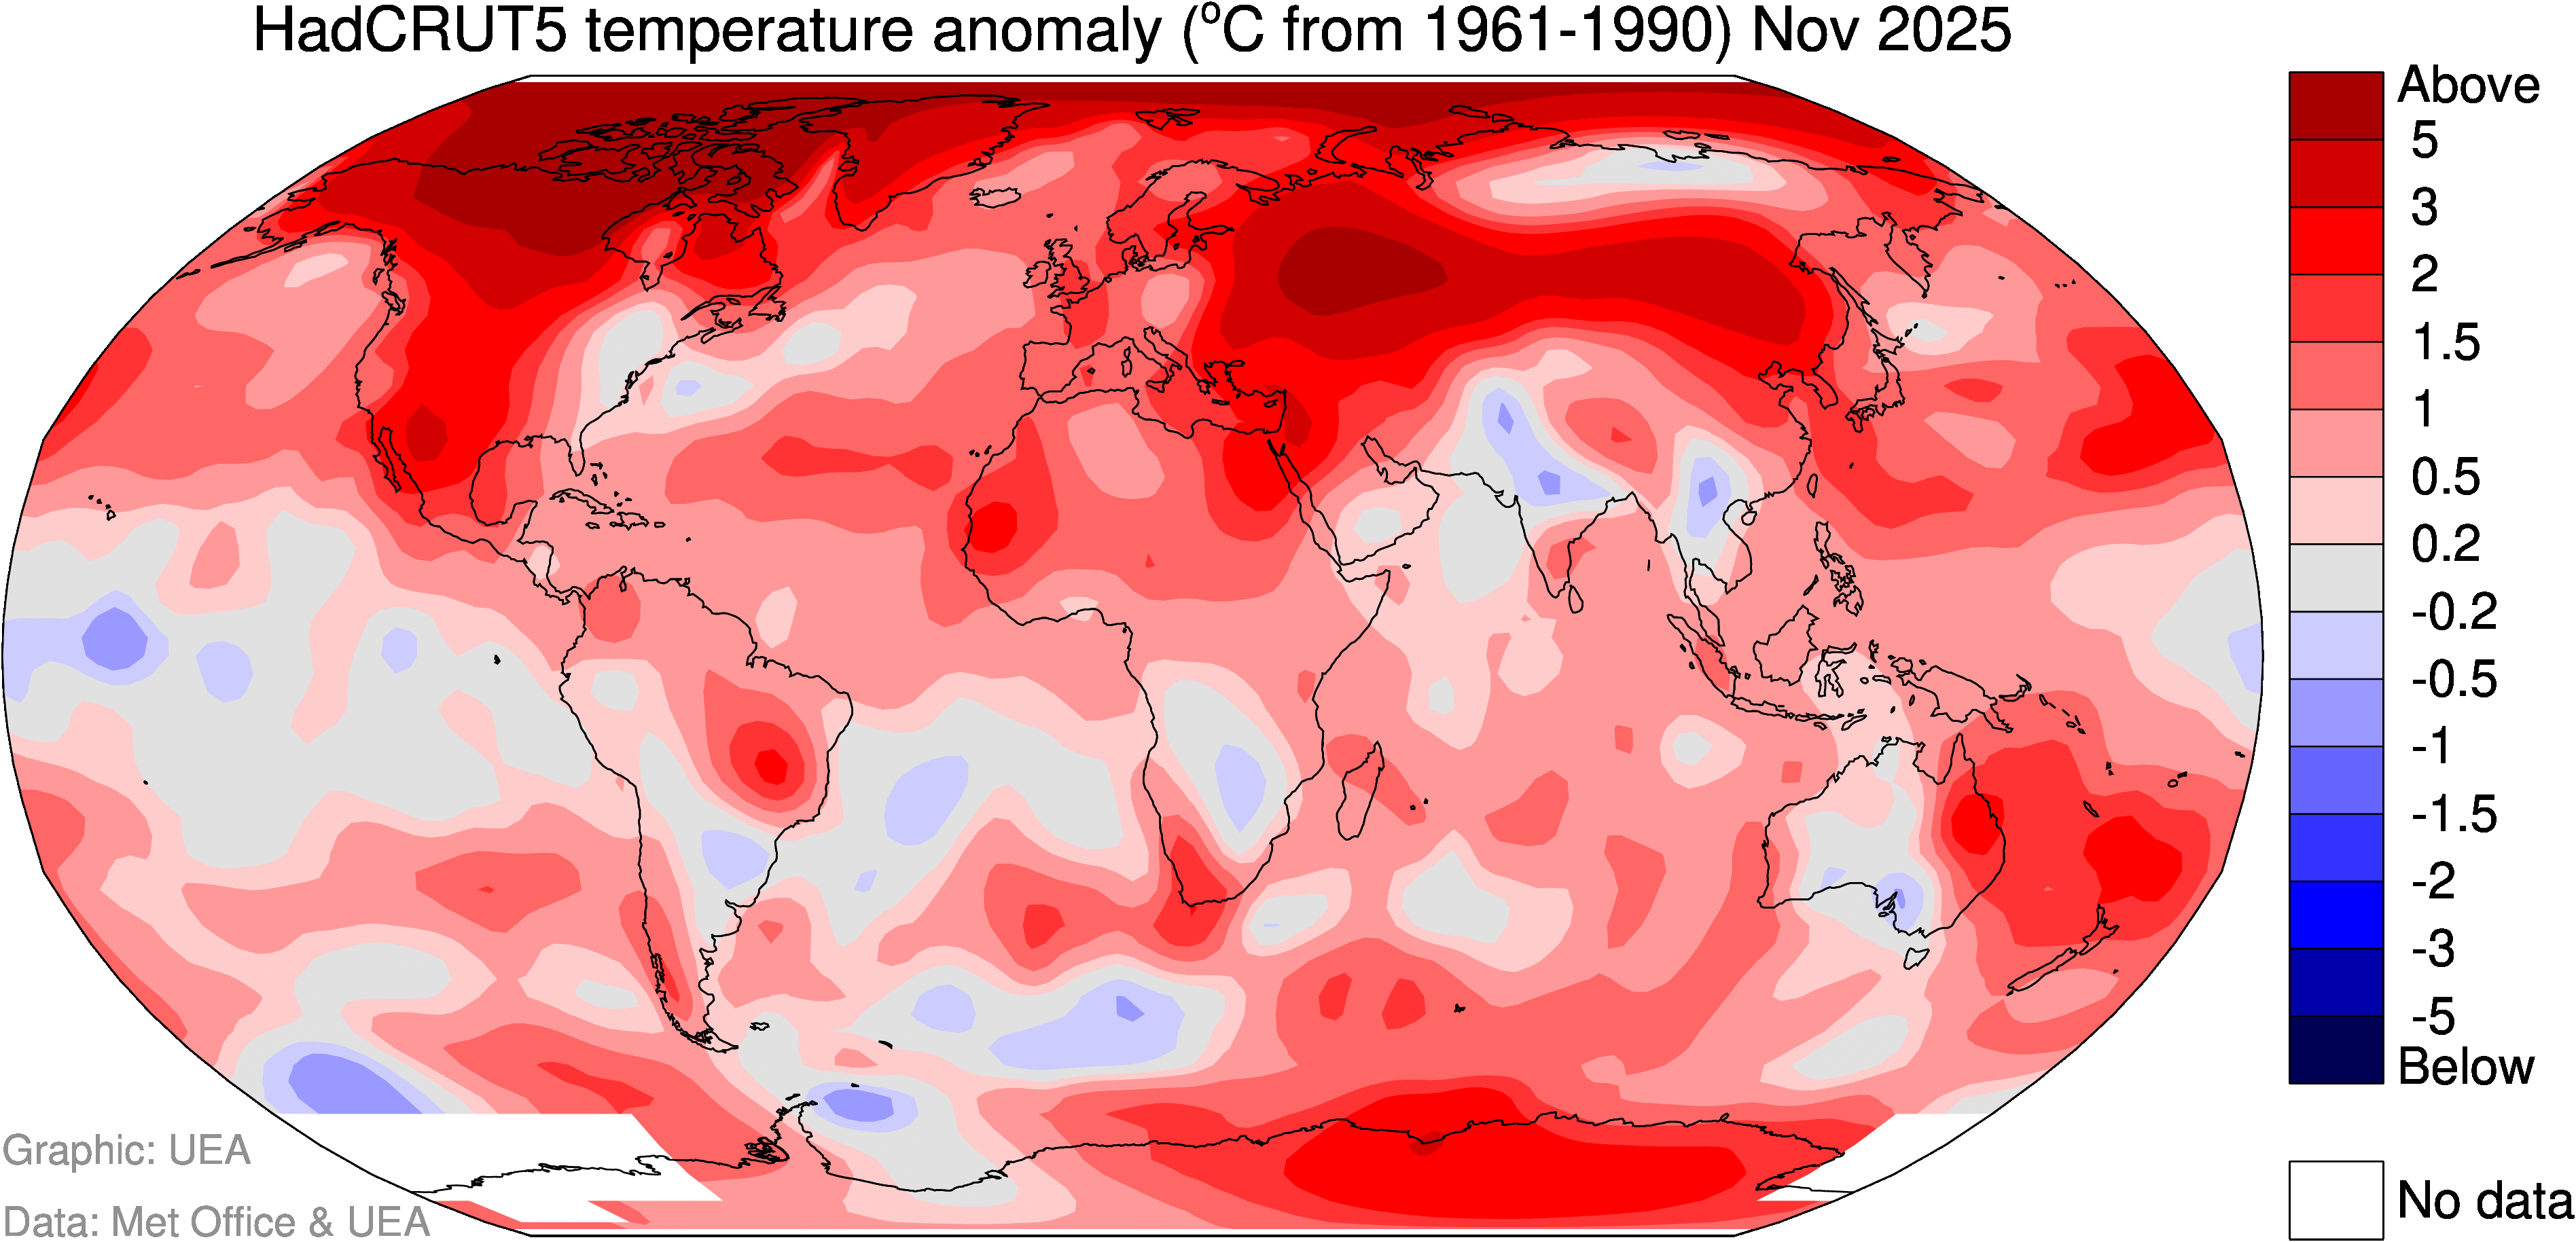
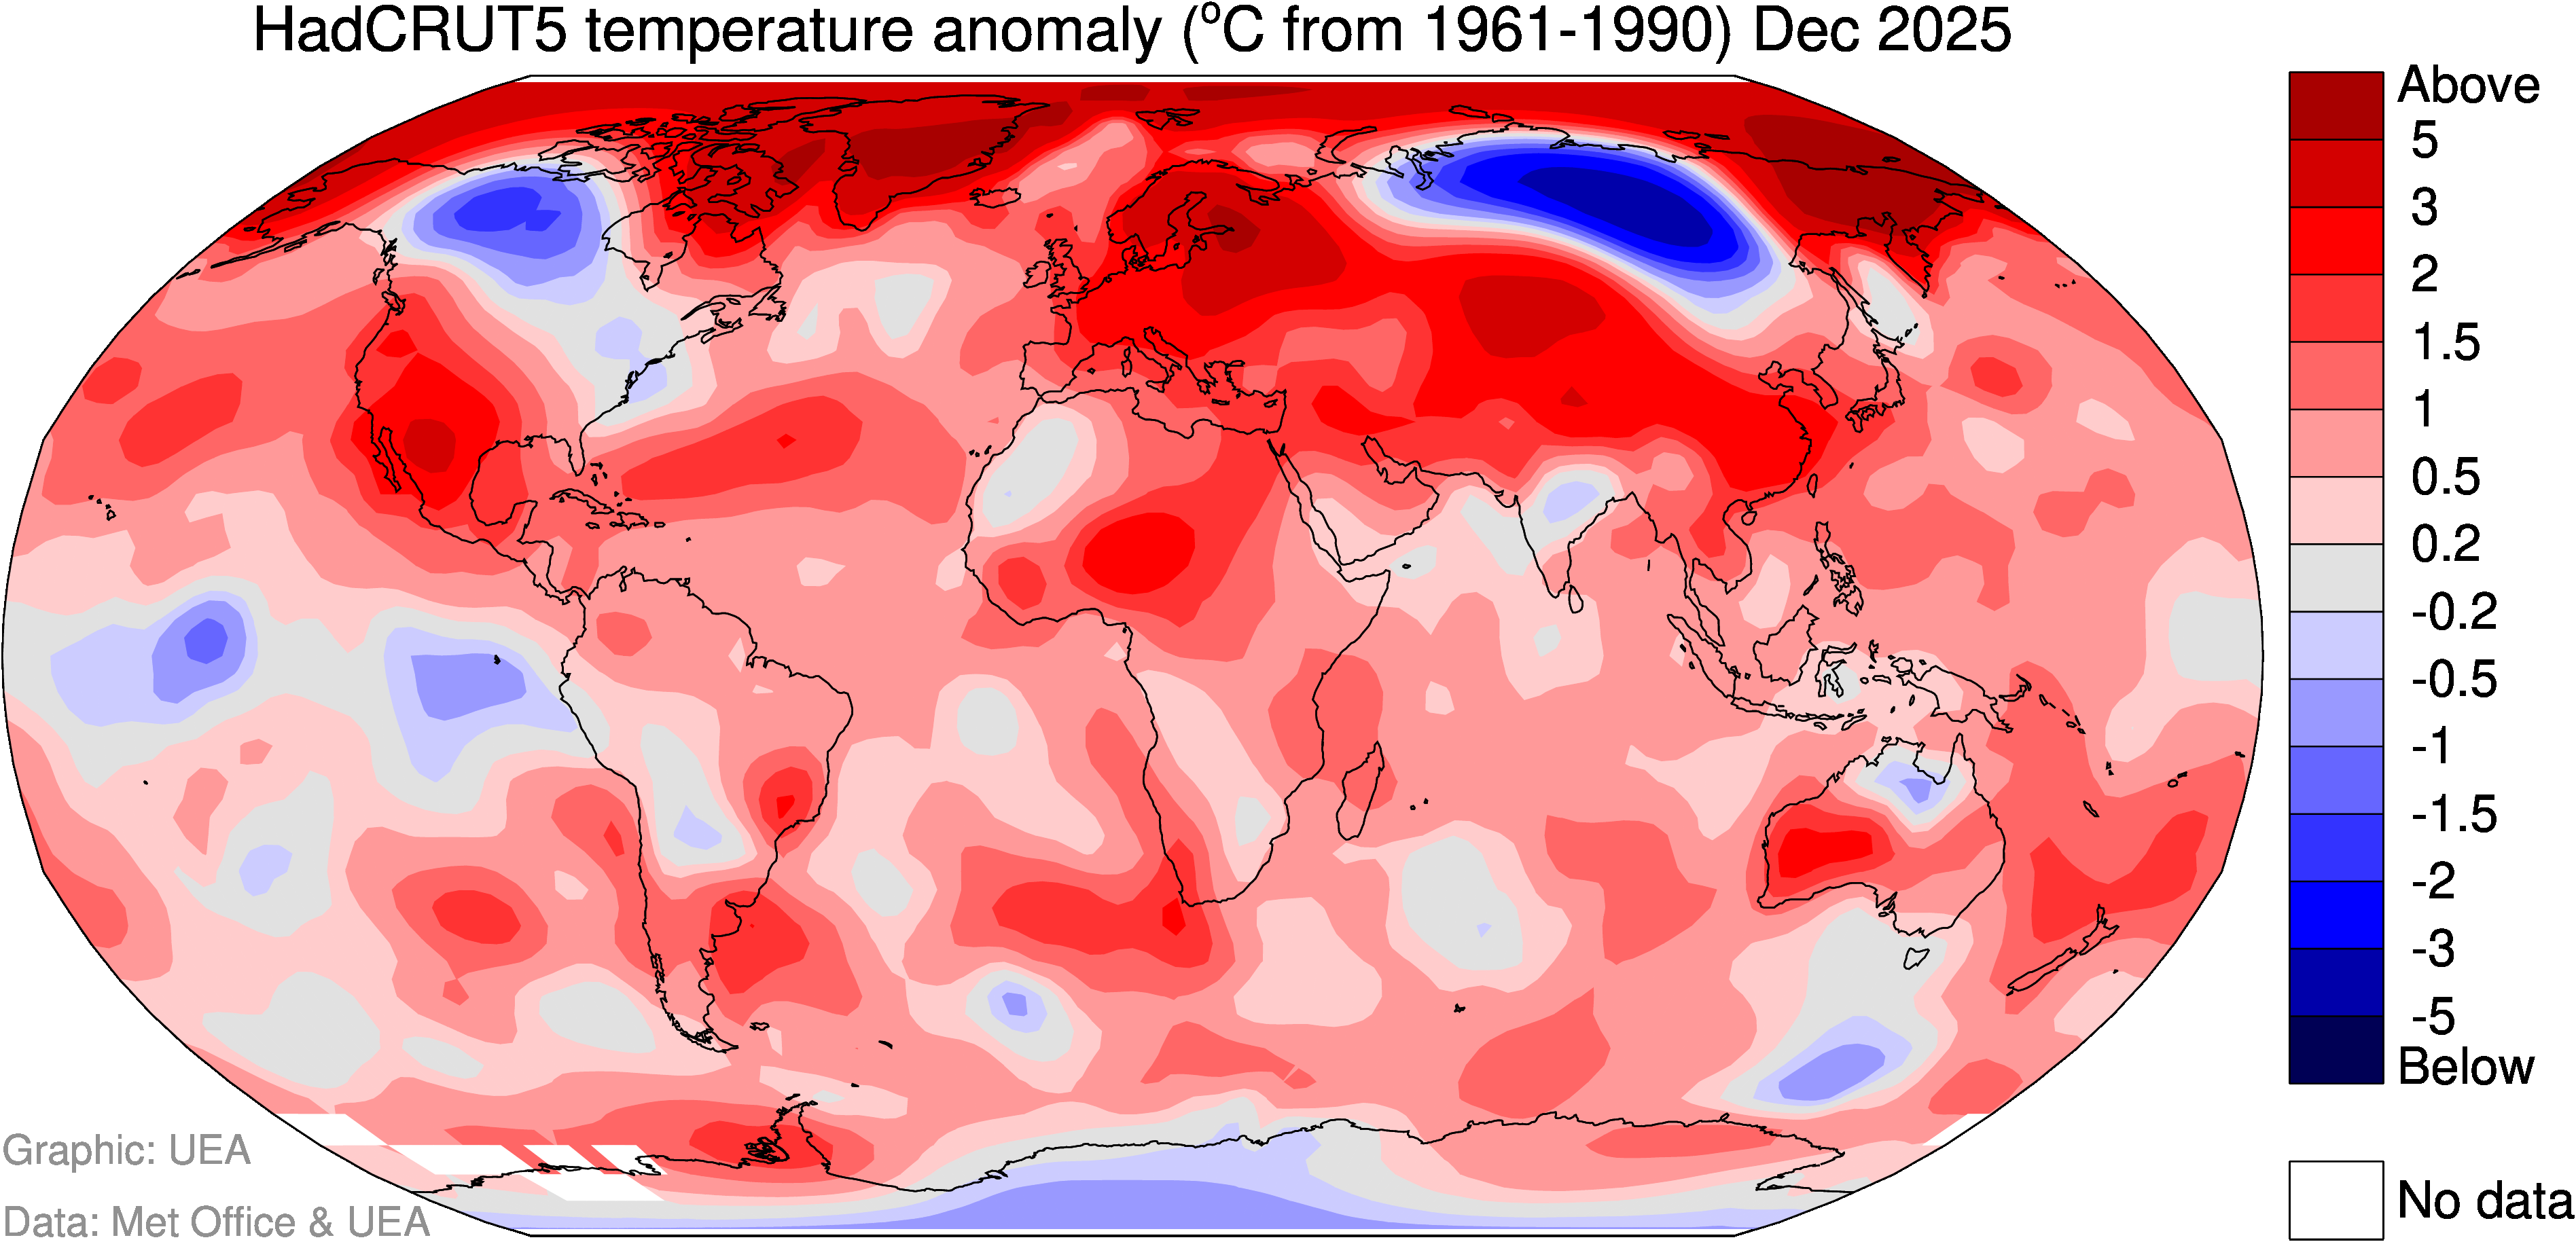
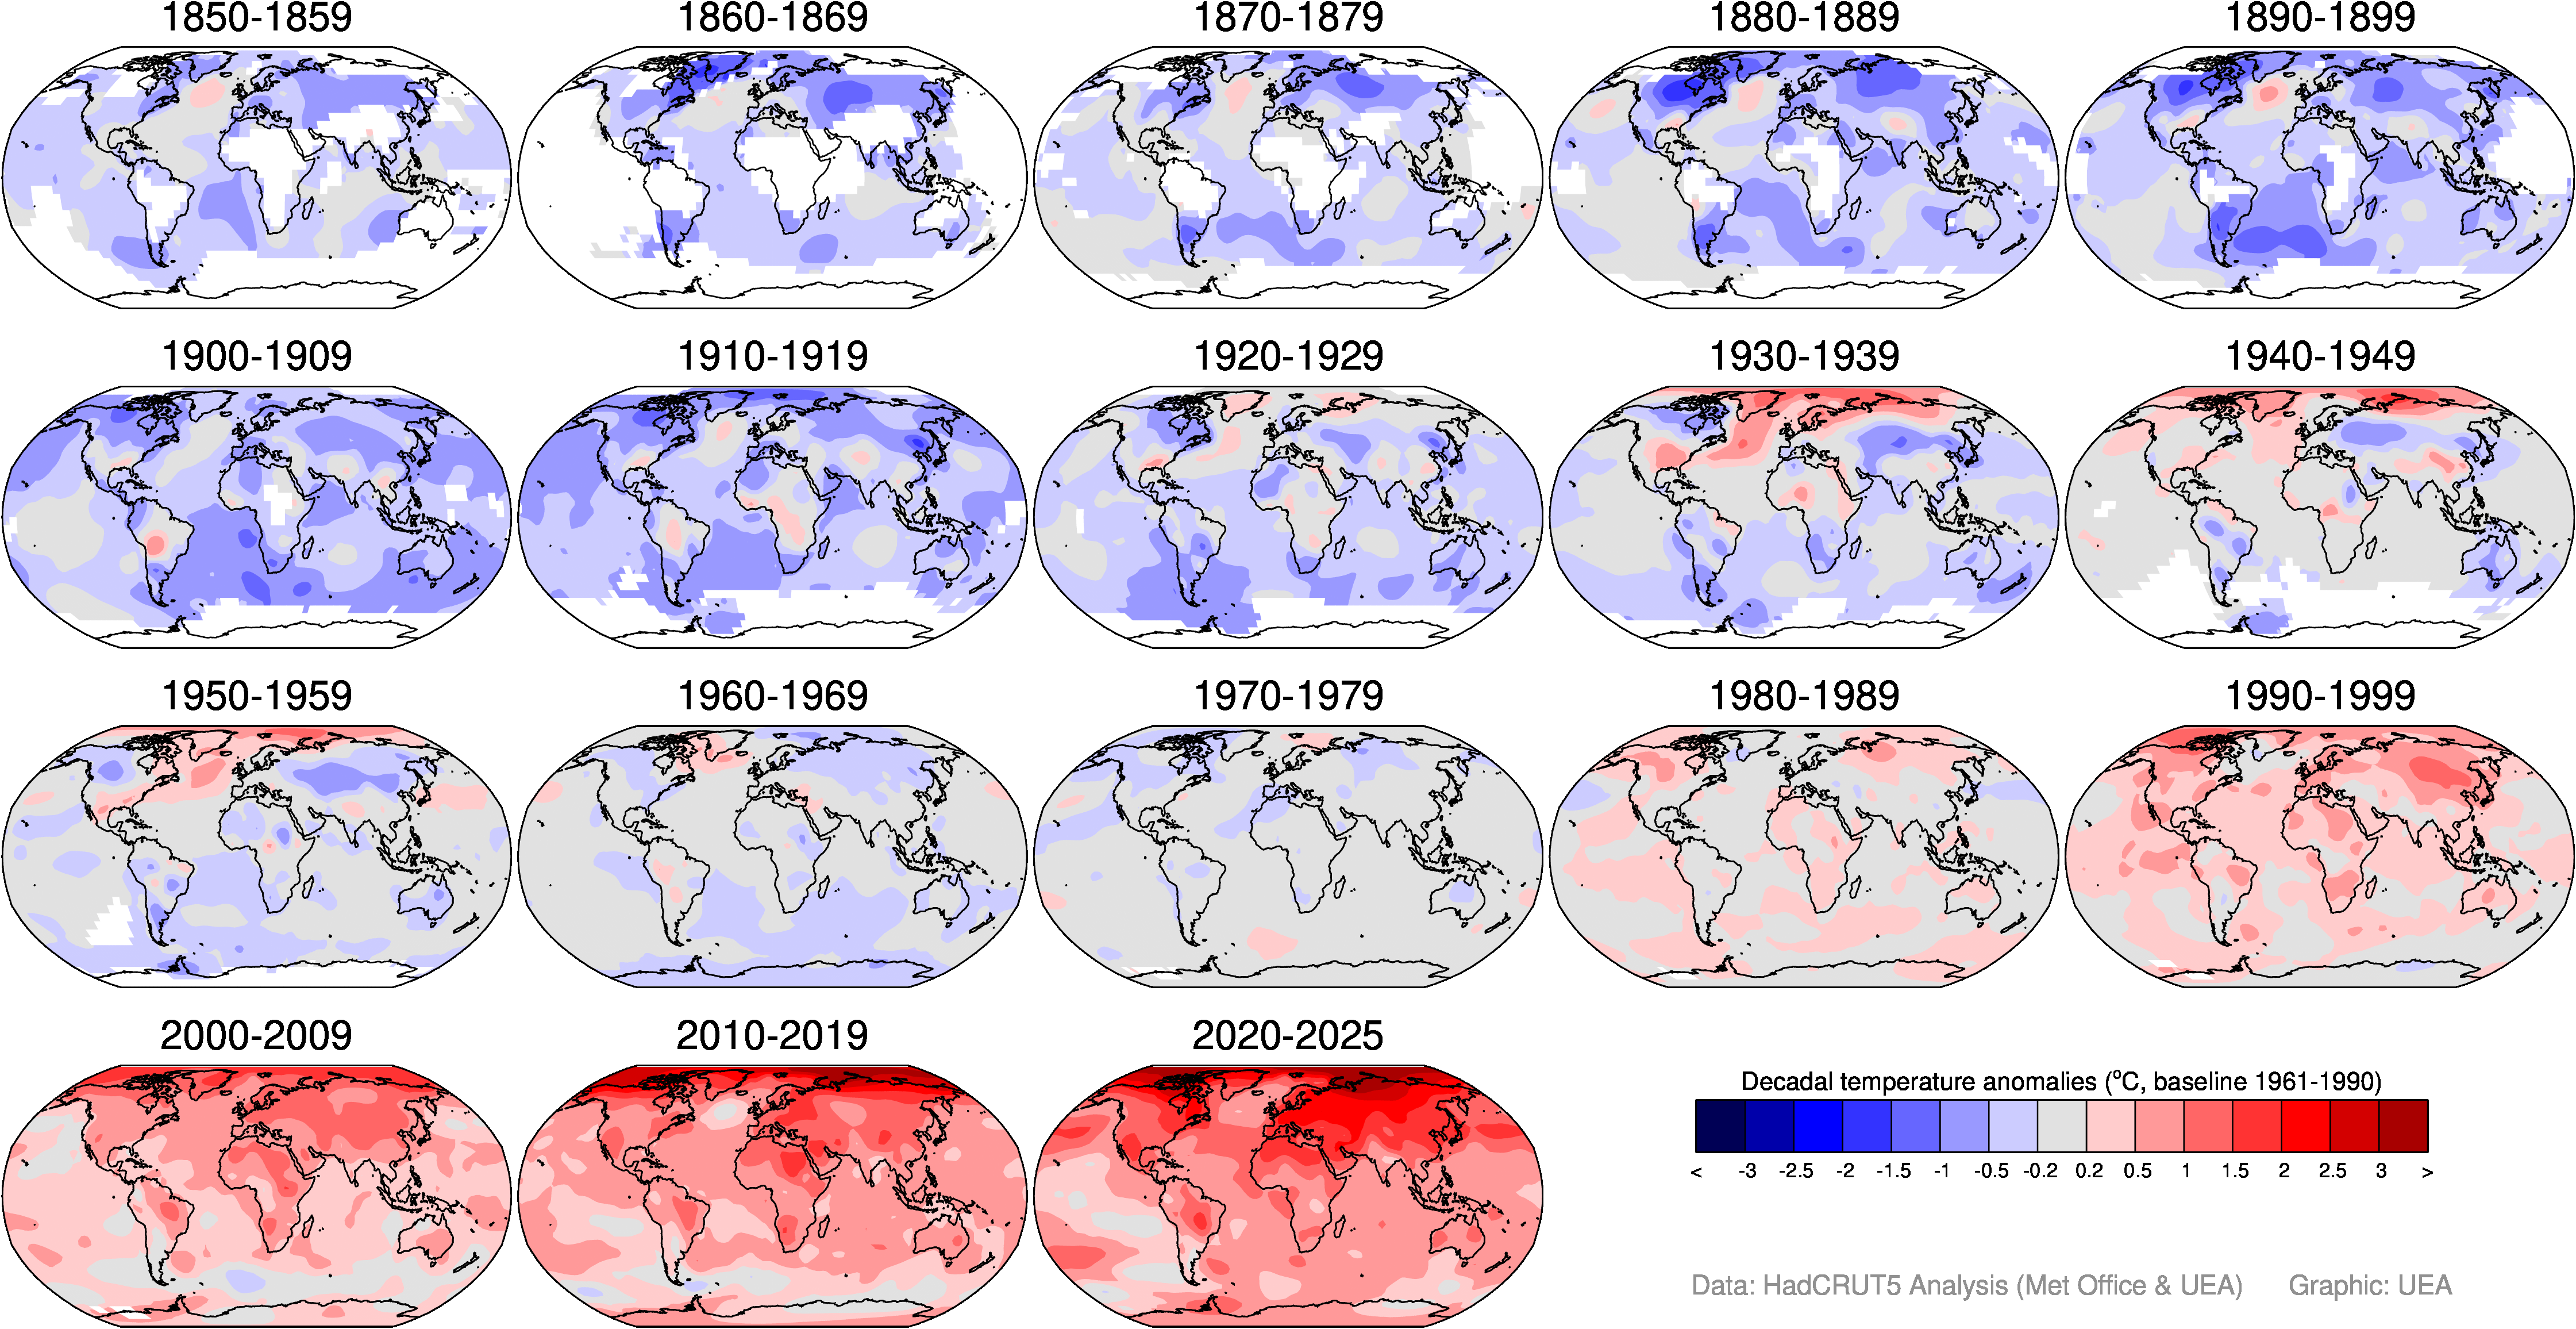
Annual average 2025 temperatures were warmest on record across parts of the North Pacific Ocean, in western Antarctica, western Russia and parts of the North Atlantic close to the UK and Ireland.
Click image for a larger version
Click here if the video doesn't play in your browser
Click image for a larger version
Click image for a larger version
A joint press release from the Met Office and the University of East Anglia (UEA).
The main reference for the HadCRUT5 dataset is:
We hope that these datasets and images/figures are used widely.
Graphs and maps. These images are made available under the Creative Commons Attribution 4.0 International License (CC-BY-4.0). You may freely share, copy, adapt and redistribute these images for both commercial and non-commercial purposes provided that you give credit to UEA. If the image already says it is from UEA, then just use it. If the image doesn't already credit UEA or if you adapt it so the UEA name is removed, then you should specifically credit UEA (e.g. "Used with permission from the University of East Anglia (UEA)").
Datasets. These datasets are made available under the Open Database License. Any rights in individual contents of the datasets are licensed under the Database Contents License under the conditions of Attribution and Share-Alike.
Updated: Jan 2026