CRUTEM is a dataset derived from air temperatures near to the land surface recorded at weather stations across all continents of Earth. It has been developed and maintained by the Climatic Research Unit since the early 1980s, with funding provided mostly by the US Department of Energy. The lead scientist for most of this work was Professor Phil Jones, though many colleagues have also contributed. In recent years, the Met Office Hadley Centre (MOHC) have also been involved, especially in the regular updating of the operational version of CRUTEM (current version CRUTEM5). CRUTEM has been combined with the MOHC's dataset of sea surface temperatures to provide a near-global dataset of temperatures across Earth's surface, called HadCRUT. For example, the current version HadCRUT5 combines CRUTEM5 and HadSST4. These datasets have been widely used for assessing anthropogenic climate change.
The latest version of CRUTEM is available in text and netCDF formats at the Climatic Research Unit and at the Met Office Hadley Centre.
To access CRUTEM5 land temperature data through Google Earth, download the following KML file and open it in Google Earth:
CLICK HERE to access CRUTEM5 in Google Earth
Older versions still available:
IMPORTANT: on some Macs, running Mac OS X 10.10.0 or later, choosing to view a larger annual or seasonal plot may crash Google Earth when you try to go "Back to Google Earth". One work-around (April 2016) is to select/tick "Show web results in external browser" under the "General" tab in your Mac's Google Earth preferences.
To facilitate direct access to visualisations and the underlying data values, the CRUTEM land surface air temperature dataset is made available via Google Earth. An online rendition of the dataset -- the weather station monthly temperature data and their locations, the grid-box monthly temperature anomalies, and seasonal and annual timeseries graphs of all these data -- is accessed via an overlay written in Keyhole Markup Language (KML). The KML file overlays these locations onto the three-dimensional representation of the Earth provided by the Google Earth software, enabling the dataset to be explored and accessed interactively and graphically. This significantly enhances the accessibility of this key climate dataset, whether for exploring the data and extracting regional information for research and teaching, or for identifying any errors or limitations, without the need to develop bespoke software to analyse the data. Given that the Google Earth software is freely available and has been downloaded more than one billion times this represents an important additional dissemination route for the CRUTEM dataset.
If you don't already have the Google Earth Pro app installed, then follow these instructions to install it.
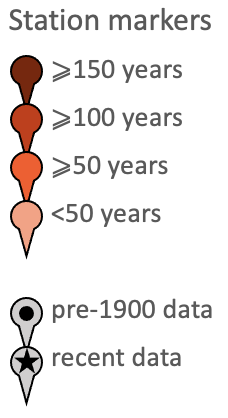
When you have clicked the KML file above, choose to open it with Google Earth. You will then see a dark and light grey (previously green and red) checkerboard over the Earth. These are the boxes that we have weather station data in (note that sea surface temperatures are not included in CRUTEM, only in HadCRUT). You can click any grey box you choose and it will show the annual temperature anomaly timeseries for that grid box, plus clickable links to seasonal images and the grid-box data. There is also a link called "Stations": clicking this will show the approximate locations of all weather stations in our archive for that grid box with marker pins and the ID/name of the station. You can click any station pin to see the annual temperature timeseries for that station, and to access the seasonal images and the station data itself. The data files are in a suitable format to import into a spreadsheet: save them and then open as comma-deliminated (CSV) files.
The primary reference for the CRUTEM5 dataset, which should be cited whenever CRUTEM5 data are used, is:
The primary reference for the CRUTEM4 dataset, which should be cited whenever CRUTEM4 data are used, is:
If you use the information provided by this Google Earth interface, then please also acknowledge our work by citing:
We hope that these datasets and images/figures are used widely.
Graphs and maps. These images are made available under the Creative Commons Attribution 4.0 International License (CC-BY-4.0). You may freely share, copy, adapt and redistribute these images for both commercial and non-commercial purposes provided that you give credit to UEA. If the image already says it is from UEA, then just use it. If the image doesn't already credit UEA or if you adapt it so the UEA name is removed, then you should specifically credit UEA (e.g. "Used with permission from the University of East Anglia (UEA)").
Datasets. These datasets are made available under the Open Database License. Any rights in individual contents of the datasets are licensed under the Database Contents License under the conditions of Attribution and Share-Alike.
Updated: November 2024 by Tim Osborn